[~](https://fgeerolf.com/)/data/oecd/
INCOMEAW
Code
TABLE_I4 %>%
  left_join(TABLE_I4_var$INCOMEAW, by = "INCOMEAW") %>%
  group_by(INCOMEAW, Incomeaw) %>%
  summarise(Nobs = n()) %>%
  arrange(-Nobs) %>%
  {if (is_html_output()) print_table(.) else .}
| 100 |
100 |
6118 |
| 133 |
133 |
6118 |
| 167 |
167 |
6118 |
| 67 |
67 |
6118 |
MARGRATES
Code
TABLE_I4 %>%
  left_join(TABLE_I4_var$MARGRATES, by = "MARGRATES") %>%
  group_by(MARGRATES, Margrates) %>%
  summarise(Nobs = n()) %>%
  arrange(-Nobs) %>%
  {if (is_html_output()) print_table(.) else .}
| ALL_IN |
All-in |
3496 |
| CENT_GOV |
Central government |
3496 |
| COMB_GOV |
Combined central and sub-central government |
3496 |
| EMPLOYEE_SSC |
Employee SSC |
3496 |
| EMPLOYER_SSC |
Employer SSC |
3496 |
| SUBCENT_GOV |
Sub-central government |
3496 |
| TOT_TAX_WEDGE |
Total tax wedge |
3496 |
COU
Code
TABLE_I4 %>%
  left_join(TABLE_I4_var$COU, by = "COU") %>%
  group_by(COU, Cou) %>%
  summarise(Nobs = n()) %>%
  arrange(-Nobs) %>%
  mutate(Flag = gsub(" ", "-", str_to_lower(gsub(" ", "-", Cou))),
         Flag = paste0('<img src="../../icon/flag/vsmall/', Flag, '.png" alt="Flag">')) %>%
  select(Flag, everything()) %>%
  {if (is_html_output()) datatable(., filter = 'top', rownames = F, escape = F) else .}
Table
Code
TABLE_I4 %>%
  filter(MARGRATES %in% c("EMPLOYEE_SSC", "EMPLOYER_SSC", "ALL_IN"),
         obsTime == "2018") %>%
  left_join(TABLE_I4_var$COU, by = "COU") %>%
  mutate(obsValue = round(obsValue, 1),
         INCOMEAW = paste(INCOMEAW, "% Avg Wage"),
         MARGRATES = gsub("_SSC", "", MARGRATES) %>% str_to_title) %>%
  select(Country = Cou, `Who` = MARGRATES, `% of Avg Wage` = INCOMEAW, obsValue) %>%
  spread(`% of Avg Wage`, obsValue) %>%
  {if (is_html_output()) datatable(., filter = 'top', rownames = F) else .}
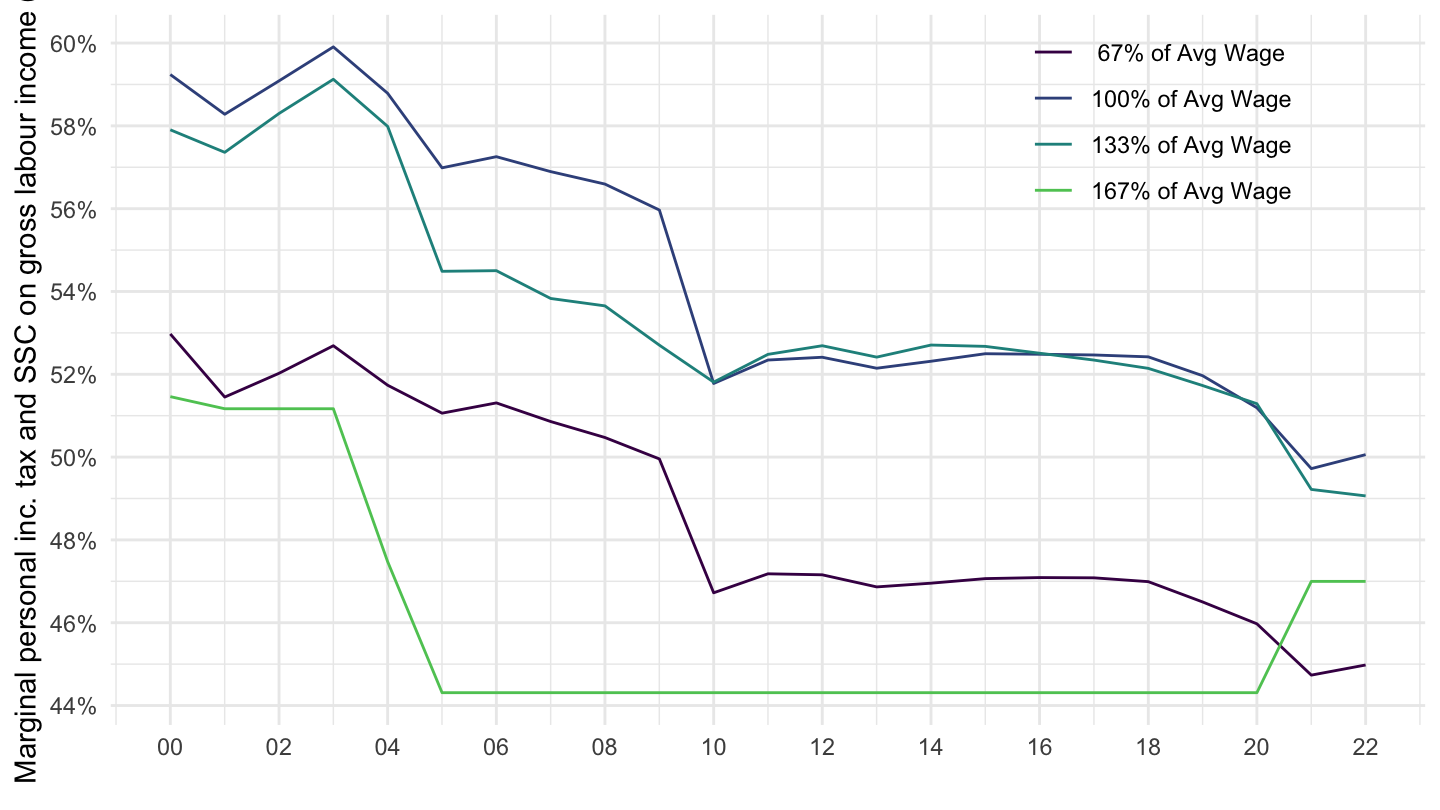
Germany
Code
TABLE_I4 %>%
  filter(COU == "DEU",
         MARGRATES == "ALL_IN") %>%
  year_to_date %>%
  left_join(tibble(INCOMEAW = c("67", "100", "133", "167"),
                   Incomeaw = c(" 67% of Avg Wage",
                                "100% of Avg Wage",
                                "133% of Avg Wage",
                                "167% of Avg Wage")), by = "INCOMEAW") %>%
  mutate(obsValue = obsValue/100) %>%
  ggplot() + geom_line(aes(x = date, y = obsValue, color = Incomeaw)) +
  scale_color_manual(values = viridis(5)[1:4]) +
  theme_minimal() +
  scale_x_date(breaks = seq(1920, 2025, 2) %>% paste0("-01-01") %>% as.Date,
               labels = date_format("%y")) +
  theme(legend.position = c(0.8, 0.85),
        legend.title = element_blank()) +
  scale_y_continuous(breaks = 0.01*seq(0, 70, 2),
                     labels = percent_format(accuracy = 1)) +
  ylab("Marginal personal inc. tax and SSC on gross labour income (%)") + xlab("")
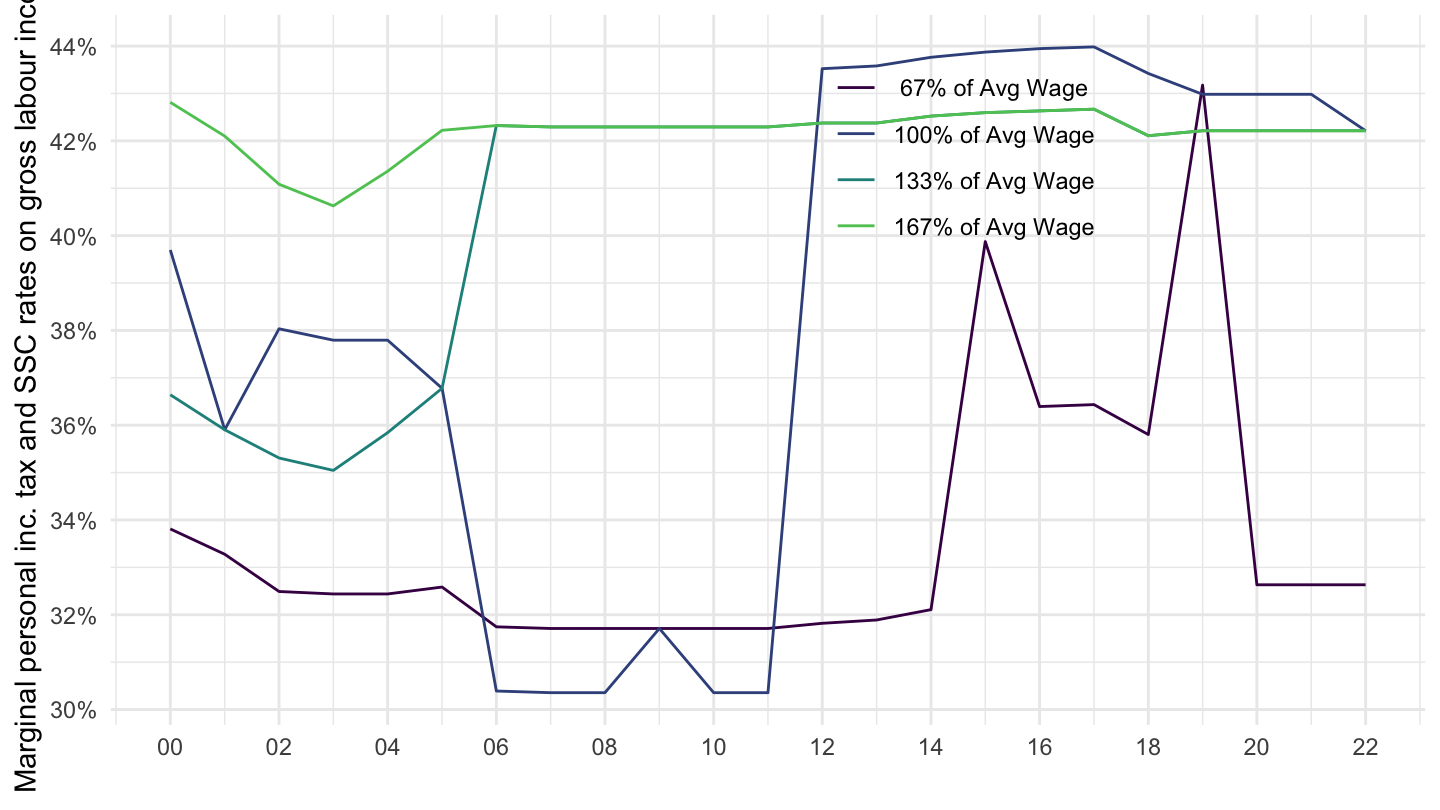
France
ALL_IN
Code
TABLE_I4 %>%
  filter(COU == "FRA",
         MARGRATES == "ALL_IN") %>%
  year_to_date %>%
  left_join(tibble(INCOMEAW = c("67", "100", "133", "167"),
                   Incomeaw = c(" 67% of Avg Wage",
                                "100% of Avg Wage",
                                "133% of Avg Wage",
                                "167% of Avg Wage")), by = "INCOMEAW") %>%
  mutate(obsValue = obsValue/100) %>%
  ggplot() + geom_line(aes(x = date, y = obsValue, color = Incomeaw)) +
  scale_color_manual(values = viridis(5)[1:4]) +
  theme_minimal() +
  scale_x_date(breaks = seq(1920, 2025, 2) %>% paste0("-01-01") %>% as.Date,
               labels = date_format("%y")) +
  theme(legend.position = c(0.65, 0.8),
        legend.title = element_blank()) +
  scale_y_continuous(breaks = 0.01*seq(0, 70, 2),
                     labels = percent_format(accuracy = 1)) +
  ylab("Marginal personal inc. tax and SSC rates on gross labour income") + xlab("")