STAN Indicators 2009 - STAN_INDICATORS_2009
Data - OECD
Nobs - Javascript
Data Structure
| id | description |
|---|---|
| COU | Country |
| VAR | Variable |
| IND | Industry |
| TIME | Time |
| OBS_VALUE | Observation Value |
| TIME_FORMAT | Time Format |
| OBS_STATUS | Observation Status |
VAR
IND
TIME_FORMAT
| id | label |
|---|---|
| P1Y | Annual |
| P1M | Monthly |
| P3M | Quarterly |
| P6M | Half-yearly |
| P1D | Daily |
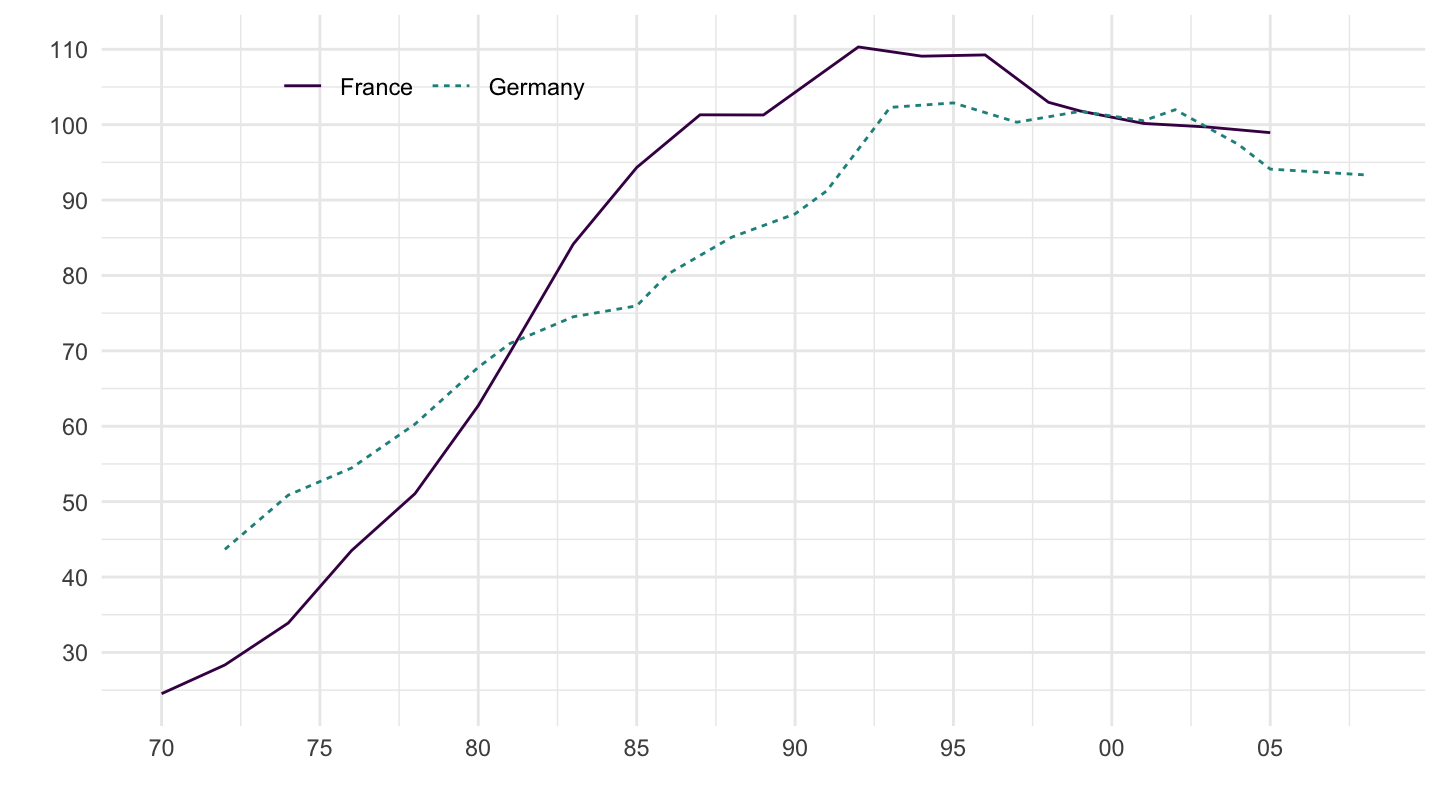
Example 1: Unit labour cost index (Total)
Code
STAN_INDICATORS_2009 %>%
  filter(IND == "0199",
         VAR == "IULC",
         COU == c("FRA", "DEU")) %>%
  year_to_date %>%
  left_join(STAN_INDICATORS_2009_var %>% pluck("VAR"), by = c("VAR" = "id")) %>%
  rename(VAR_desc = label) %>%
  left_join(STAN_INDICATORS_2009_var %>% pluck("COU"), by = c("COU" = "id")) %>%
  rename(COU_desc = label) %>%
  select(VAR_desc, COU_desc, date, obsValue) %>%
  ggplot(.) + theme_minimal() + xlab("") + ylab("") +
  geom_line(aes(x = date, y = obsValue, color = COU_desc, linetype = COU_desc)) +
  scale_color_manual(values = viridis(3)[1:2]) +
  scale_x_date(breaks = seq(1960, 2100, 5) %>% paste0("-01-01") %>% as.Date,
               labels = date_format("%Y")) +
  scale_y_continuous(breaks = seq(0, 200, 10)) +
  theme(legend.position = c(0.25, 0.9),
        legend.title = element_blank(),
        legend.direction = "horizontal")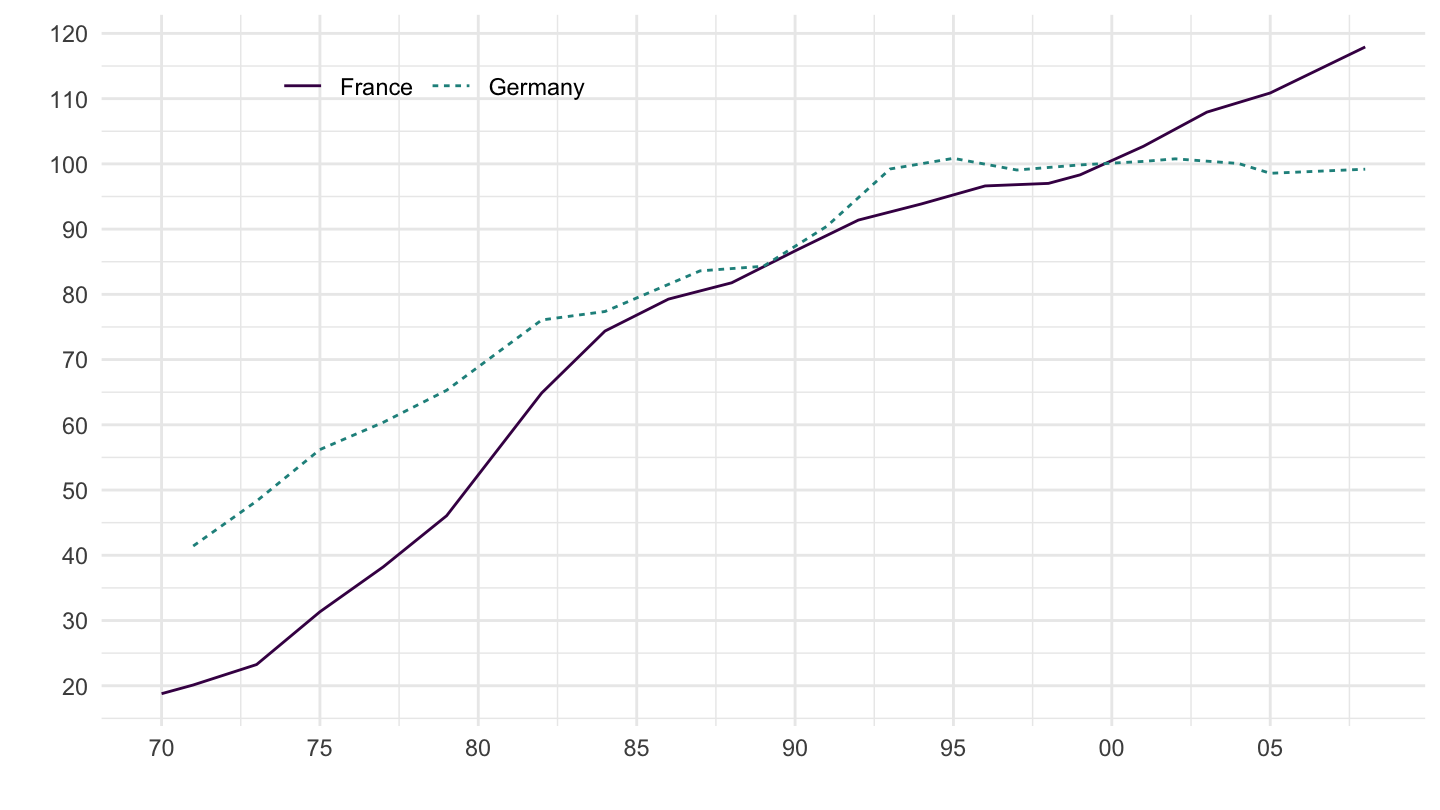
Example 2: Unit labour cost index (Total)
Code
STAN_INDICATORS_2009 %>%
  filter(IND == "1537",
         VAR == "IULC",
         COU == c("FRA", "DEU")) %>%
  year_to_date %>%
  left_join(STAN_INDICATORS_2009_var %>% pluck("VAR"), by = c("VAR" = "id")) %>%
  rename(VAR_desc = label) %>%
  left_join(STAN_INDICATORS_2009_var %>% pluck("COU"), by = c("COU" = "id")) %>%
  rename(COU_desc = label) %>%
  select(VAR_desc, COU_desc, date, obsValue) %>%
  ggplot(.) + theme_minimal() + xlab("") + ylab("") +
  geom_line(aes(x = date, y = obsValue, color = COU_desc, linetype = COU_desc)) +
  scale_color_manual(values = viridis(3)[1:2]) +
  scale_x_date(breaks = seq(1960, 2100, 5) %>% paste0("-01-01") %>% as.Date,
               labels = date_format("%Y")) +
  scale_y_continuous(breaks = seq(0, 200, 10)) +
  theme(legend.position = c(0.25, 0.9),
        legend.title = element_blank(),
        legend.direction = "horizontal")