STAN (STructural ANalysis) Industrial - STANI4_2016
Data - OECD
Nobs - Javascript
Data Structure
| id | description |
|---|---|
| LOCATION | Country |
| VAR | Variable |
| IND | Industry |
| TIME | Time |
| OBS_VALUE | Observation Value |
| TIME_FORMAT | Time Format |
| OBS_STATUS | Observation Status |
| UNIT | Unit |
| POWERCODE | Unit multiplier |
| REFERENCEPERIOD | Reference period |
VAR
IND
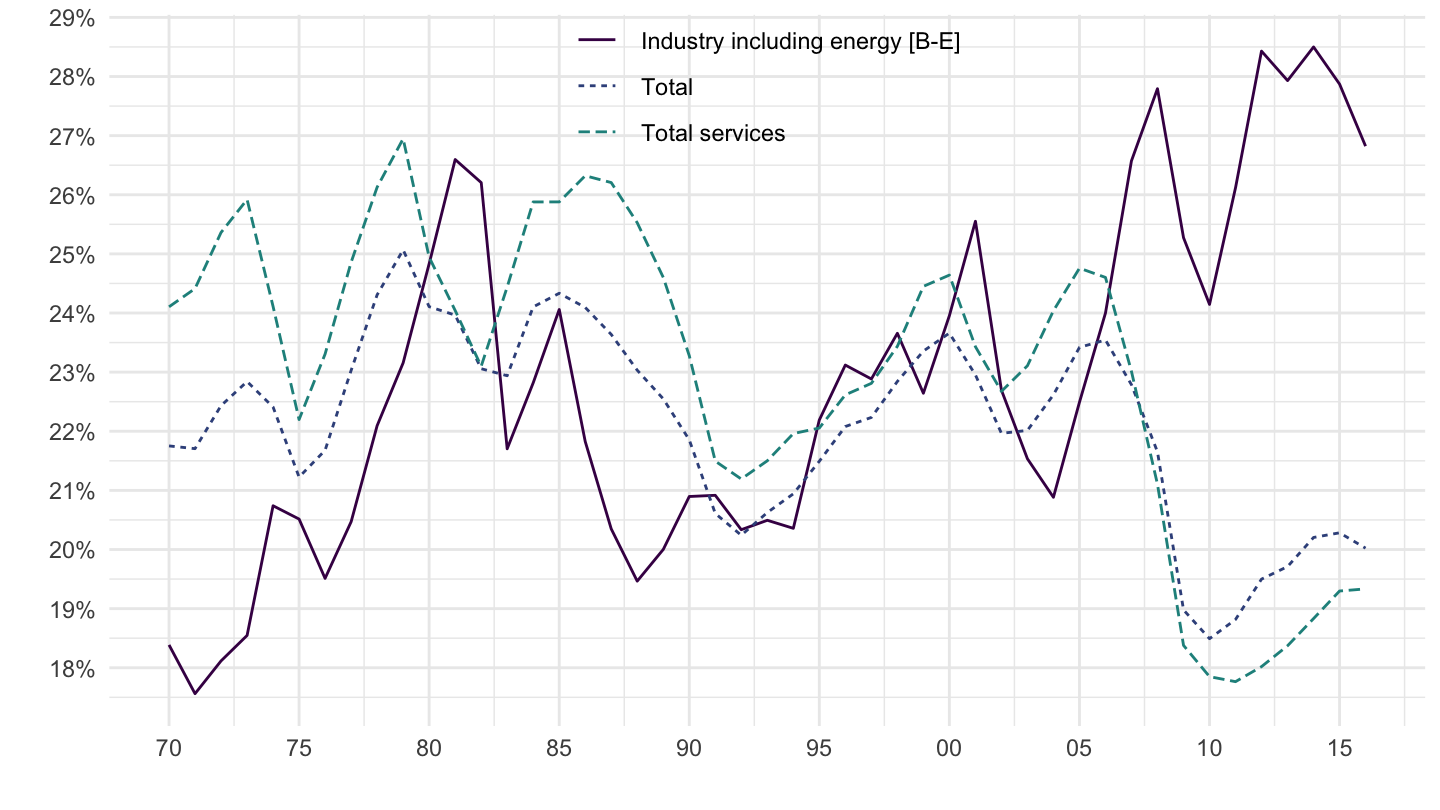
Ex 1: Investment Share
Code
STANI4_2016 %>%
  filter(VAR %in% c("GFCF", "VALU"),
         # D01T99: Total
         # D45T99: Total services
         # D05T39: Industry including energy [B-E]
         IND %in% c("D01T99", "D05T39", "D45T99"),
         LOCATION == "USA") %>%
  left_join(STANI4_2016_var %>% pluck("IND"), by = c("IND" = "id")) %>%
  rename(IND_desc = label) %>%
  select(LOCATION, VAR, IND_desc, obsTime, obsValue) %>%
  spread(VAR, obsValue) %>%
  mutate(GFCF_share = GFCF / VALU) %>%
  year_to_date %>%
  ggplot(.) +
  geom_line(aes(x = date, y = GFCF_share, color = IND_desc, linetype = IND_desc)) +
  theme_minimal() + xlab("") + ylab("") +
  scale_x_date(breaks = seq(1960, 2020, 5) %>% paste0("-01-01") %>% as.Date,
               labels = date_format("%y")) +
  scale_y_continuous(breaks = 0.01*seq(-10, 50, 1),
                     labels = percent_format(accuracy = 1)) +
  scale_color_manual(values = viridis(5)[1:4]) +
  theme(legend.position = c(0.5, 0.90),
        legend.title = element_blank())