| id | description |
|---|---|
| NPROG | Name of Programme |
| TIME | Year |
| OBS_VALUE | Observation Value |
| TIME_FORMAT | Time Format |
| OBS_STATUS | Observation Status |
| UNIT | Unit |
| POWERCODE | Unit multiplier |
| REFERENCEPERIOD | Reference period |
Social Expenditure - Aggregated data - SOCX_DET
Data - OECD
Data Structure
NPROG
Example 1: Detail in Germany
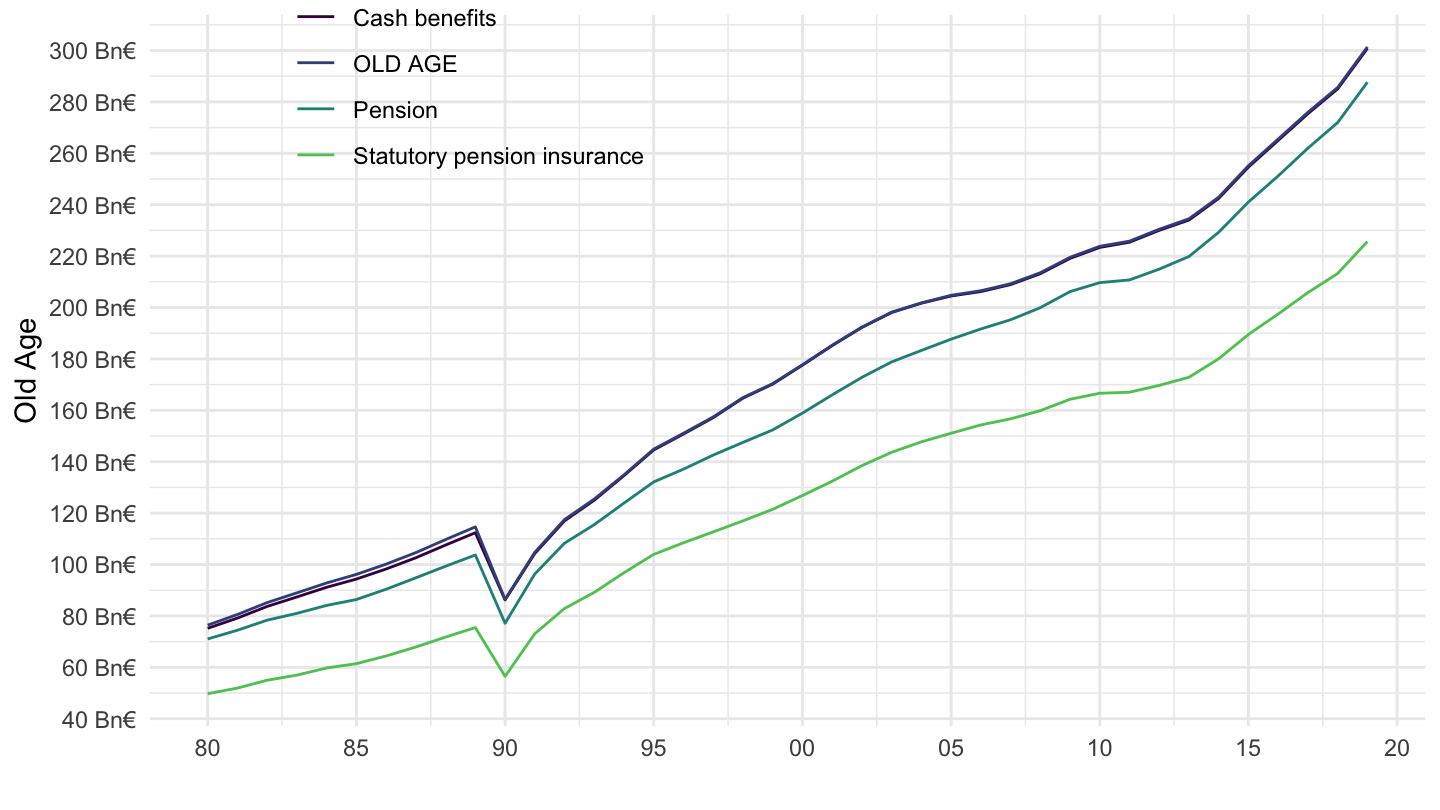
Example 2: Germany - Old Age
Code
SOCX_DET %>%
  filter(NPROG %in% c("DEU-10-1-0-0-0", "DEU-10-1-1-1-0",
                      "DEU-10-1-1-1-1", "DEU-10-1-1-0-0")) %>%
  left_join(SOCX_DET_var %>% pluck("NPROG"), by = c("NPROG" = "id")) %>%
  rename(NPROG_desc = label) %>%
  year_to_date() %>%
  ggplot() +
  geom_line(aes(x = date, y = obsValue/1000, color = NPROG_desc)) +
  theme_minimal()  +
  scale_x_date(breaks = as.Date(paste0(seq(1960, 2020, 5), "-01-01")),
               labels = date_format("%y")) +
  scale_color_manual(values = viridis(5)[1:4]) +
  xlab("") + ylab("Old Age") +
  theme(legend.position = c(0.25, 0.9),
        legend.title = element_blank()) +
  scale_y_continuous(breaks = seq(0, 4000, 20),
                     labels = dollar_format(suffix = " Bn€", prefix = "", accuracy = 1))