Code
RS_GBL <- read_parquet("RS_GBL.parquet")
load_data("oecd/RS_GBL_var.RData")RS_GBL <- read_parquet("RS_GBL.parquet")
load_data("oecd/RS_GBL_var.RData")RS_GBL_var$VAR_DESC %>%
{if (is_html_output()) print_table(.) else .}| id | description |
|---|---|
| COU | Country |
| GOV | Level of government |
| TAX | Tax revenue |
| VAR | Indicator |
| YEA | Year |
| OBS_VALUE | Observation Value |
| TIME_FORMAT | Time Format |
| OBS_STATUS | Observation Status |
RS_GBL |>
  filter(COU == "DEU",
         GOV == "NES",
         TAX == "TOTALTAX",
         VAR == "TAXNAT") |>
  year_to_date() |>
  filter(date >= as.Date("1995-01-01"),
         date <= as.Date("2020-01-01")) |>
  ggplot() +
  geom_line(aes(x = date, y = obsValue)) + theme_minimal() +
  theme(legend.title = element_blank(),
        legend.position = c(0.1, 0.25)) +
  scale_x_date(breaks = as.Date(paste0(seq(1920, 2020, 1), "-01-01")),
               labels = date_format("%Y")) +
  scale_y_continuous(breaks = seq(-0.10, 0.03, 0.01),
                     labels = scales::percent_format(accuracy = 1)) +
  xlab("") + ylab("Total Taxes in Germany") +
  scale_y_continuous(breaks = seq(0, 2000, 100),
                     labels = dollar_format(suffix = " Bn€", prefix = "", accuracy = 1)) +
  geom_rect(data = data_frame(start = as.Date("1998-01-01"),
                              end = as.Date("1999-01-01")),
            aes(xmin = start, xmax = end, ymin = -Inf, ymax = +Inf),
            fill = viridis(3)[2], alpha = 0.2) +
  geom_vline(xintercept = as.Date("1998-01-01"), linetype = "dashed", color = viridis(3)[2]) +
  geom_vline(xintercept = as.Date("1999-01-01"), linetype = "dashed", color = viridis(3)[2])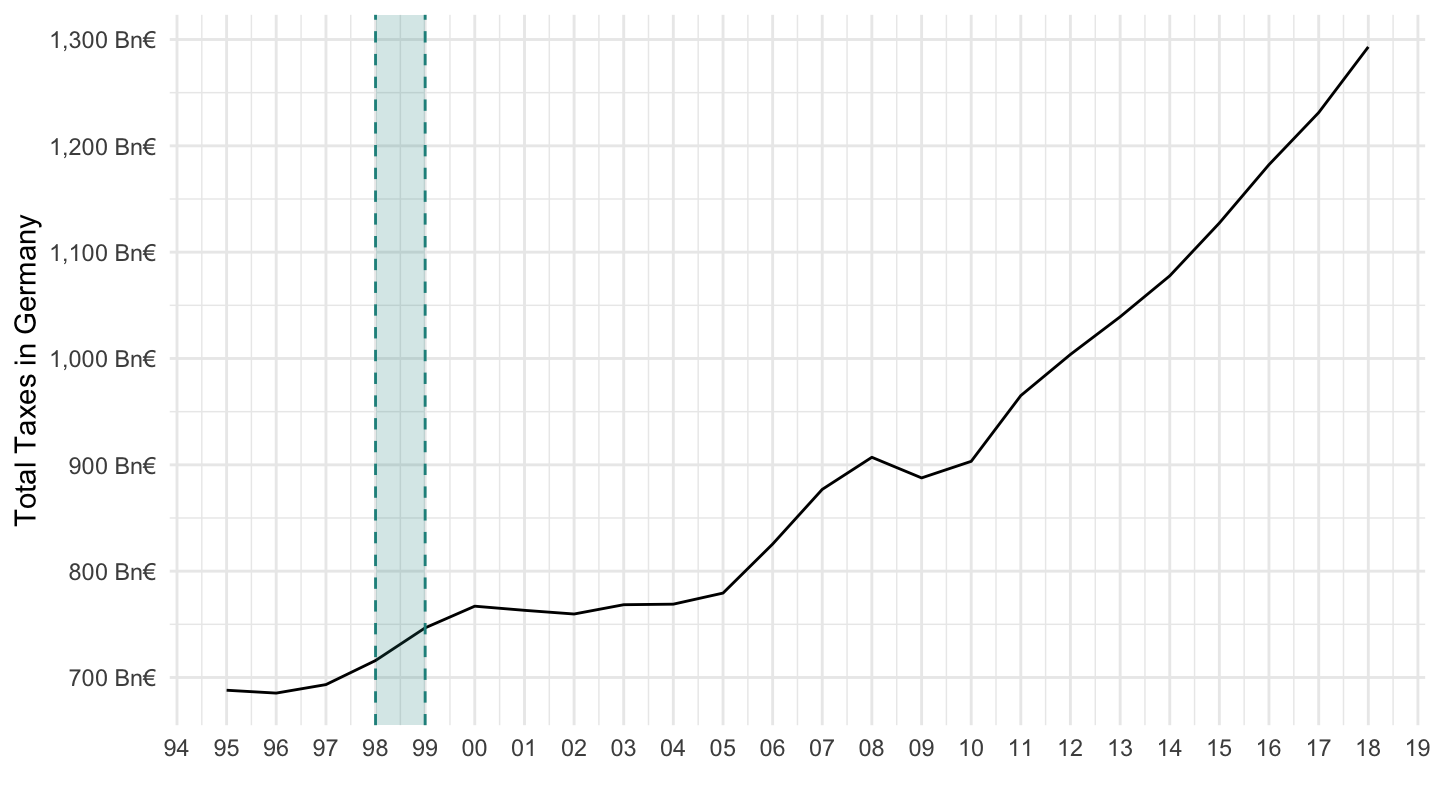
RS_GBL |>
  filter(COU == "DEU",
         GOV == "NES",
         TAX == "TOTALTAX",
         VAR == "TAXGDP") |>
  year_to_date() |>
  filter(date >= as.Date("1995-01-01"),
         date <= as.Date("2020-01-01")) |>
  ggplot() + xlab("") + ylab("Total Taxes (% of GDP)") +
  geom_line(aes(x = date, y = obsValue/100)) + theme_minimal() +
  theme(legend.title = element_blank(),
        legend.position = c(0.1, 0.25)) +
  scale_x_date(breaks = as.Date(paste0(seq(1920, 2020, 1), "-01-01")),
               labels = date_format("%Y")) +
  scale_y_continuous(breaks = seq(0, 0.50, 0.005),
                     labels = scales::percent_format(accuracy = 0.1))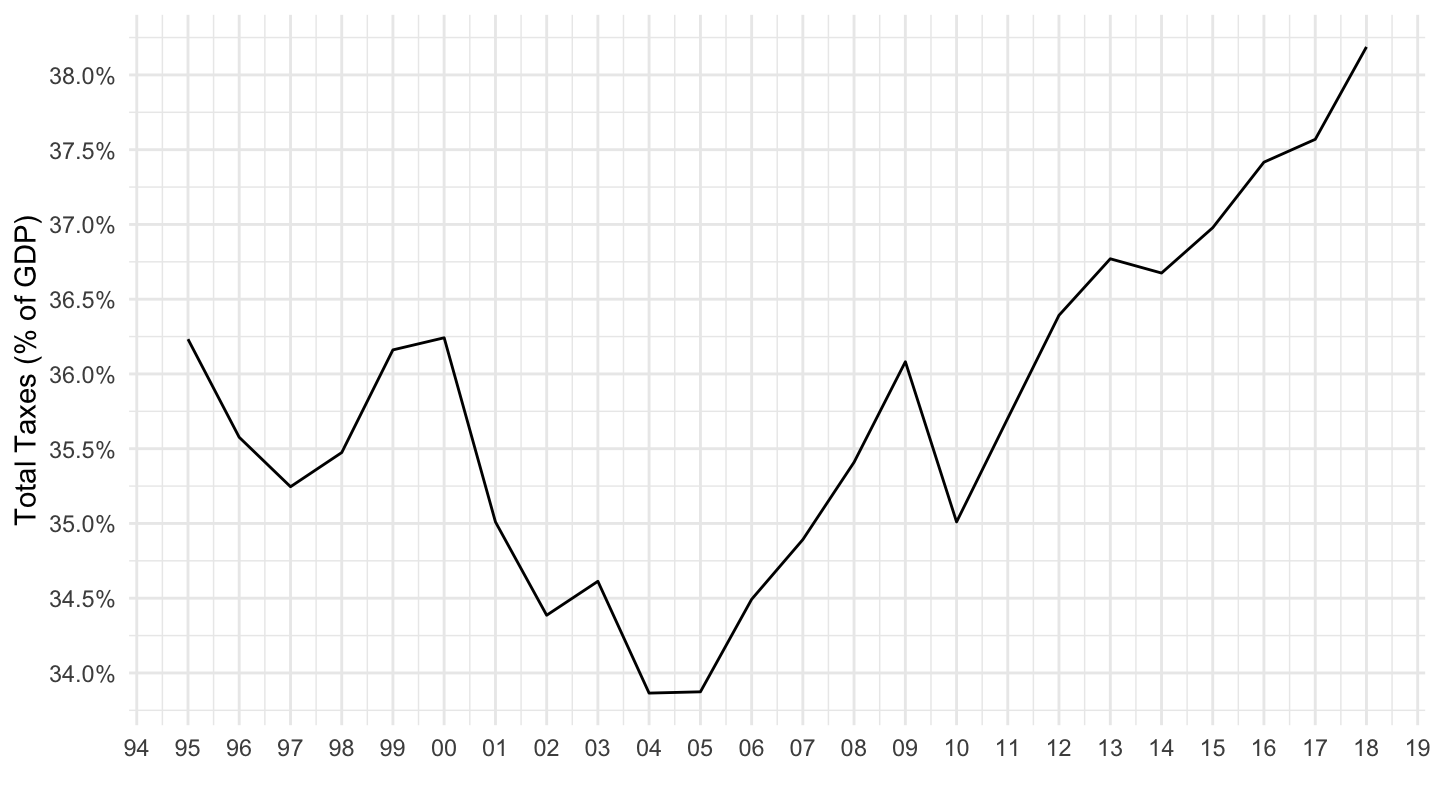
RS_GBL |>
  filter(COU == "DEU",
         GOV == "NES",
         TAX %in% c("5100", "5110", "5120"),
         VAR == "TAXGDP") |>
  select(TAX, obsValue, obsTime) |>
  year_to_enddate() |>
  left_join(RS_GBL_var$TAX |> setNames(c("TAX", "TAX_desc")), by = "TAX") |>
  ggplot() + theme_minimal() + xlab("") + ylab("") +
  geom_line(aes(x = date, y = obsValue/100, color = TAX_desc, linetype = TAX_desc)) +
  scale_color_manual(values = viridis(4)[1:3]) +
  scale_x_date(breaks = seq(1960, 2100, 5) |> paste0("-01-01") |> as.Date(),
               labels = date_format("%Y")) +
  theme(legend.position = c(0.6, 0.9),
        legend.title = element_blank(),
        legend.direction = "vertical") +
  scale_y_continuous(breaks = 0.01*seq(00, 150, 1),
                     labels = scales::percent_format(accuracy = 1),
                     limits = 0.01*c(2.5, 13))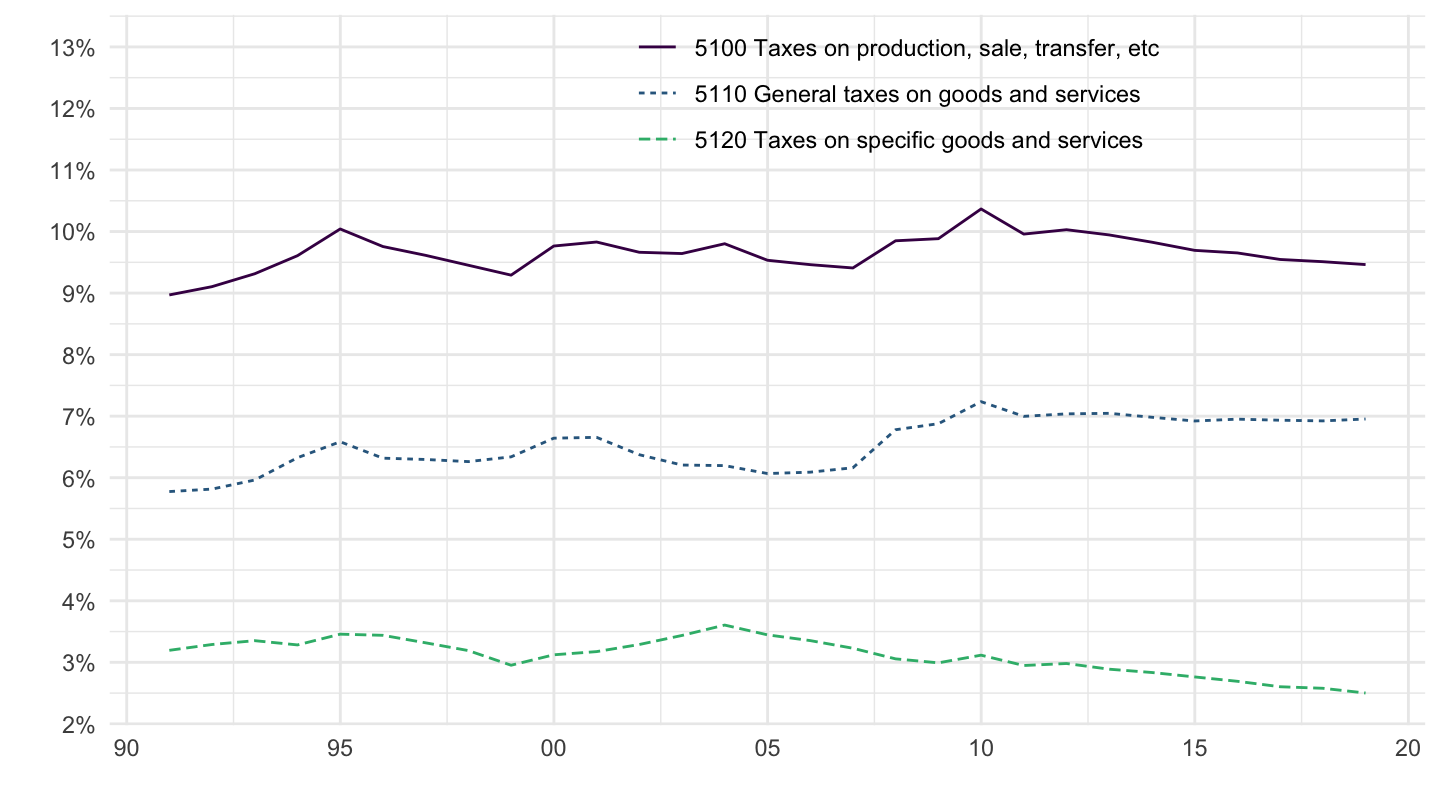
RS_GBL |>
  filter(COU == "FRA",
         GOV == "NES",
         TAX %in% c("5100", "5110", "5120"),
         VAR == "TAXGDP") |>
  select(TAX, obsValue, obsTime) |>
  year_to_enddate() |>
  left_join(RS_GBL_var$TAX |> setNames(c("TAX", "TAX_desc")), by = "TAX") |>
  ggplot() + theme_minimal() + xlab("") + ylab("") +
  geom_line(aes(x = date, y = obsValue/100, color = TAX_desc, linetype = TAX_desc)) +
  scale_color_manual(values = viridis(4)[1:3]) +
  scale_x_date(breaks = seq(1960, 2100, 5) |> paste0("-01-01") |> as.Date(),
               labels = date_format("%Y")) +
  theme(legend.position = c(0.6, 0.9),
        legend.title = element_blank(),
        legend.direction = "vertical") +
  scale_y_continuous(breaks = 0.01*seq(00, 150, 1),
                     labels = scales::percent_format(accuracy = 1),
                     limits = 0.01*c(2.5, 16))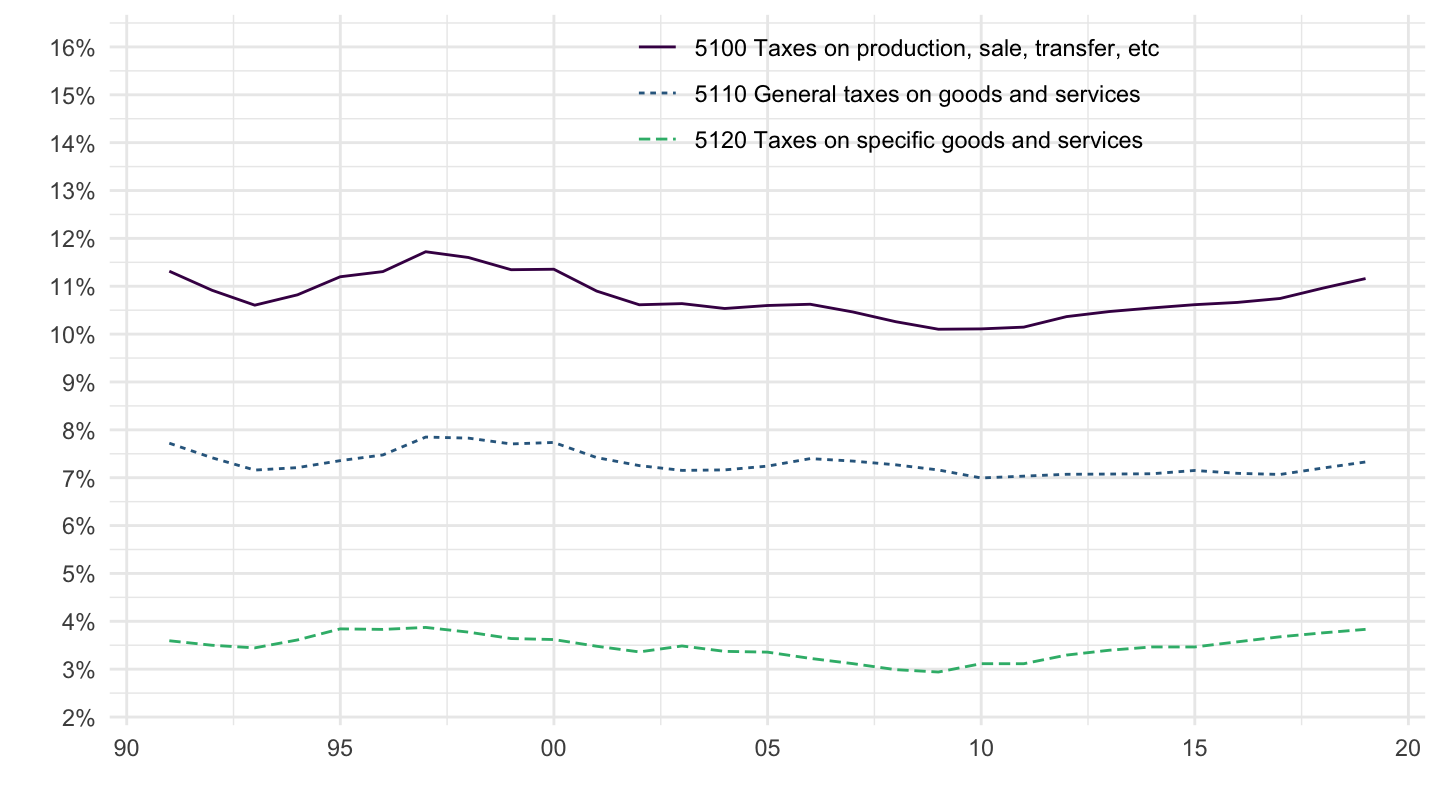
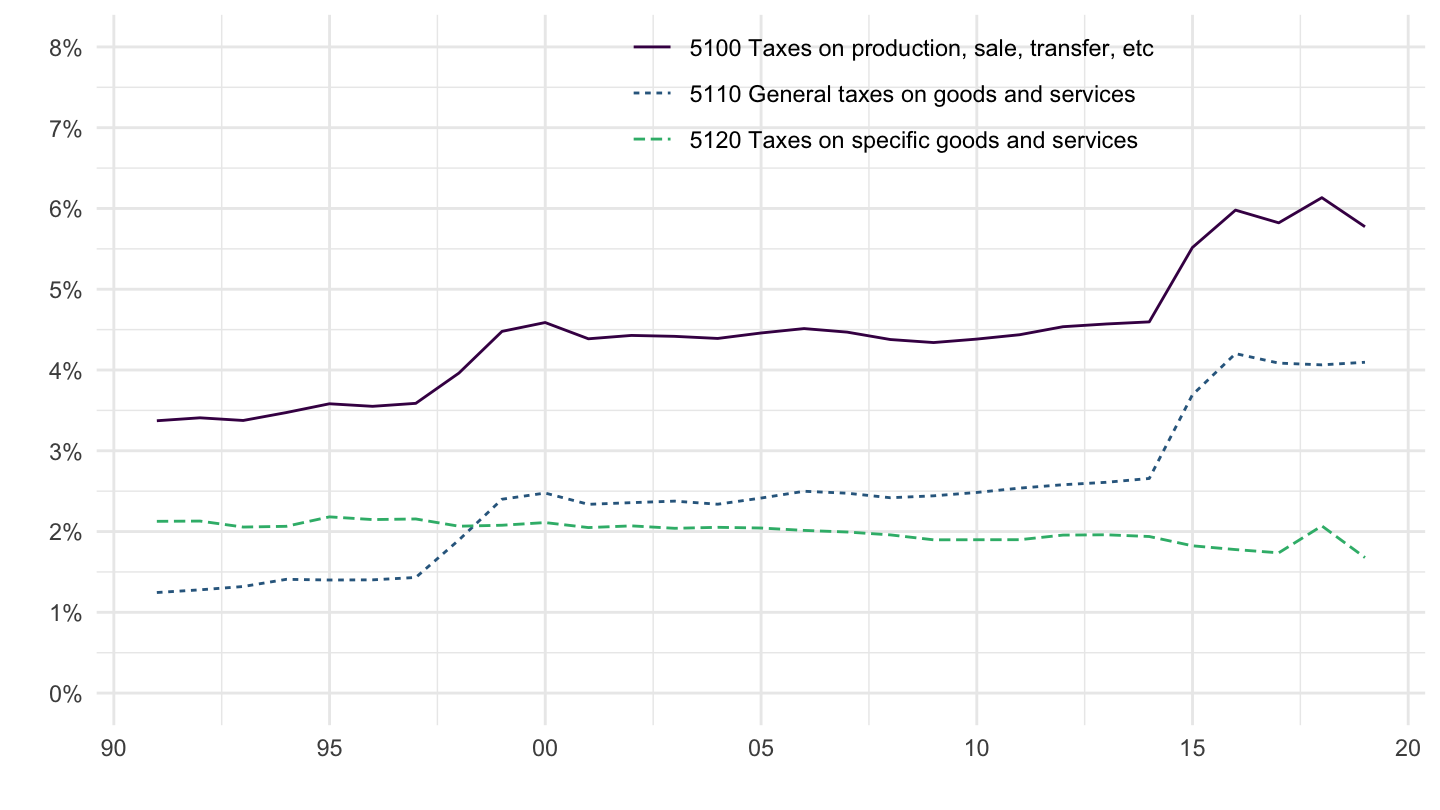
RS_GBL |>
  filter(COU == "JPN",
         GOV == "NES",
         TAX %in% c("5100", "5110", "5120"),
         VAR == "TAXGDP") |>
  select(TAX, obsValue, obsTime) |>
  year_to_enddate() |>
  left_join(RS_GBL_var$TAX |> setNames(c("TAX", "TAX_desc")), by = "TAX") |>
  ggplot() + theme_minimal() + xlab("") + ylab("") +
  geom_line(aes(x = date, y = obsValue/100, color = TAX_desc, linetype = TAX_desc)) +
  scale_color_manual(values = viridis(4)[1:3]) +
  scale_x_date(breaks = seq(1960, 2100, 5) |> paste0("-01-01") |> as.Date(),
               labels = date_format("%Y")) +
  theme(legend.position = c(0.6, 0.9),
        legend.title = element_blank(),
        legend.direction = "vertical") +
  scale_y_continuous(breaks = 0.01*seq(00, 150, 1),
                     labels = scales::percent_format(accuracy = 1),
                     limits = 0.01*c(0, 8))