Code
REVDEU %>%
  left_join(REVDEU_var$TAX, by = "TAX") %>%
  group_by(TAX, Tax, GOV) %>%
  summarise(Nobs = n()) %>%
  arrange(-Nobs) %>%
{if (is_html_output()) datatable(., filter = 'top', rownames = F) else .}Data - OECD
REVDEU %>%
left_join(REVDEU_var$TAX, by = "TAX") %>%
group_by(TAX, Tax, GOV) %>%
summarise(Nobs = n()) %>%
arrange(-Nobs) %>%
{if (is_html_output()) datatable(., filter = 'top', rownames = F) else .}REVDEU %>%
left_join(REVDEU_var$GOV, by = "GOV") %>%
group_by(GOV, Gov) %>%
summarise(Nobs = n()) %>%
arrange(-Nobs) %>%
{if (is_html_output()) print_table(.) else .}| GOV | Gov | Nobs |
|---|---|---|
| NES | Total | 7440 |
| STATE | State/Regional | 5299 |
| LOCAL | Local government | 5014 |
| FED | Federal or Central government | 4880 |
| SUPRA | Supranational | 1766 |
| SOCSEC | Social Security Funds | 1310 |
REVDEU %>%
  left_join(REVDEU_var$TAX, by = "TAX") %>%
  group_by(TAX, Tax) %>%
  summarise(Nobs = n()) %>%
  arrange(-Nobs) %>%
{if (is_html_output()) datatable(., filter = 'top', rownames = F) else .}REVDEU %>%
filter(obsTime %in% c("1998", "2003"),
obsValue != 0) %>%
left_join(REVDEU_var$TAX, by = "TAX") %>%
select(TAX, Tax, GOV, obsTime, obsValue) %>%
spread(obsTime, obsValue) %>%
na.omit %>%
gather(obsTime, obsValue, -TAX, -Tax, -GOV) %>%
group_by(TAX, Tax, GOV) %>%
summarise(`Initial Value` = round(obsValue[1]),
`Change` = round(obsValue[2] - obsValue[1]),
`Change (%)`= round(100*(obsValue[2]/obsValue[1] - 1), 1)) %>%
arrange(-`Change (%)`) %>%
{if (is_html_output()) datatable(., filter = 'top', rownames = F) else .}REVDEU %>%
filter(obsTime %in% c("1998", "2000"),
obsValue != 0) %>%
left_join(REVDEU_var$TAX %>%
setNames(c("TAX", "Tax")), by = "TAX") %>%
select(TAX, Tax, GOV, obsTime, obsValue) %>%
spread(obsTime, obsValue) %>%
na.omit %>%
gather(obsTime, obsValue, -TAX, -Tax, -GOV) %>%
group_by(TAX, Tax, GOV) %>%
summarise(`Initial Value` = round(obsValue[1]),
`Change` = round(obsValue[2] - obsValue[1]),
`Change (%)`= round(100*(obsValue[2]/obsValue[1] - 1), 1)) %>%
arrange(-`Change (%)`) %>%
{if (is_html_output()) datatable(., filter = 'top', rownames = F) else .}REVDEU %>%
filter(GOV == "FED",
TAX == "5121") %>%
year_to_date %>%
filter(date >= as.Date("1995-01-01"),
date <= as.Date("2005-01-01")) %>%
ggplot(.) + xlab("") + ylab("Excises") +
geom_line(aes(x = date, y = obsValue/1000)) + theme_minimal() +
theme(legend.title = element_blank(),
legend.position = c(0.1, 0.25)) +
scale_x_date(breaks = as.Date(paste0(seq(1920, 2100, 1), "-01-01")),
labels = date_format("%Y")) +
scale_y_continuous(breaks = seq(0, 2000, 2),
labels = dollar_format(suffix = " Bn€", prefix = "", accuracy = 1)) +
geom_rect(data = data_frame(start = as.Date("1998-01-01"),
end = as.Date("2003-01-01")),
aes(xmin = start, xmax = end, ymin = -Inf, ymax = +Inf),
fill = viridis(3)[2], alpha = 0.2) +
geom_vline(xintercept = as.Date("1998-01-01"), linetype = "dashed", color = viridis(3)[2]) +
geom_vline(xintercept = as.Date("2003-01-01"), linetype = "dashed", color = viridis(3)[2])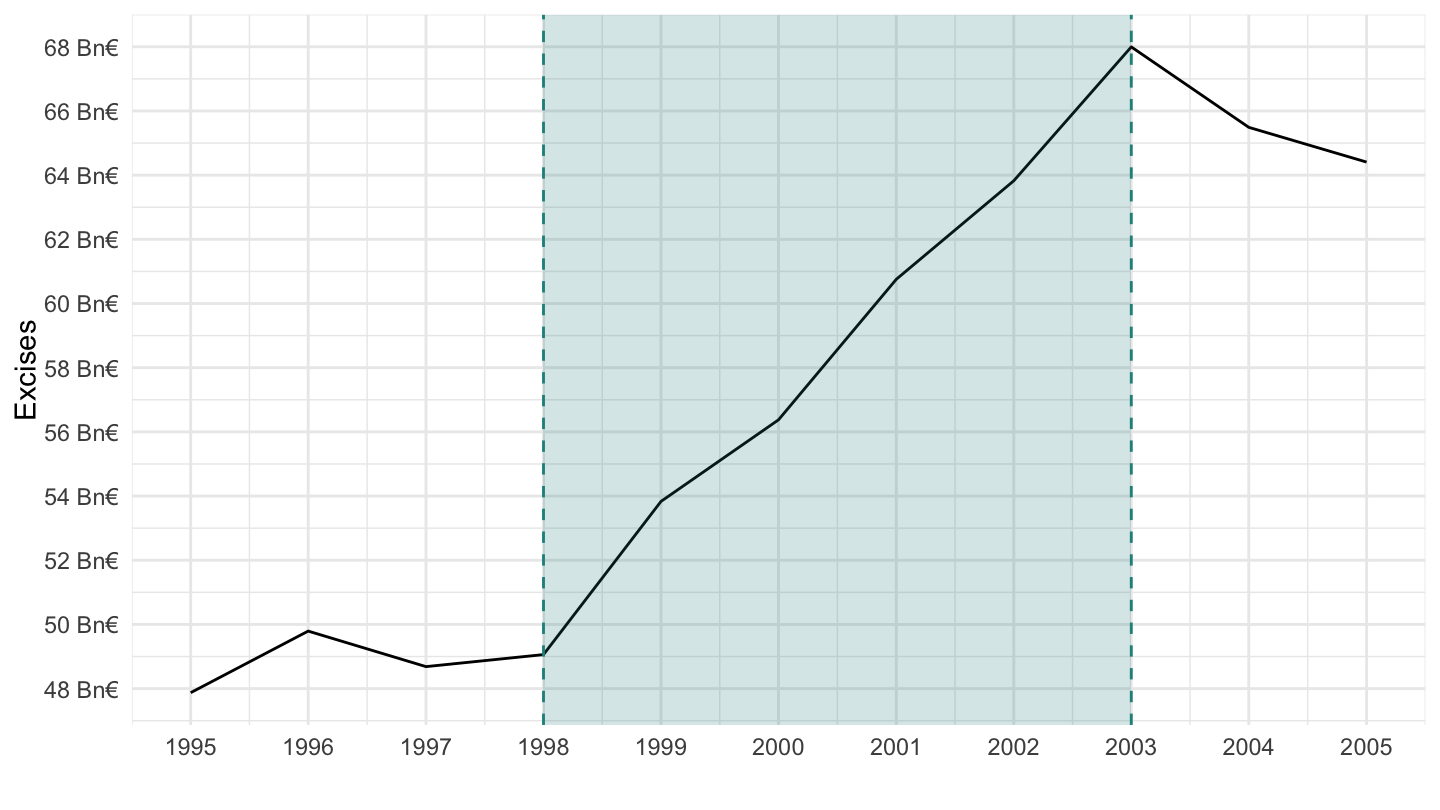
REVDEU %>%
  filter(GOV == "FED",
         TAX == "5120") %>%
  year_to_date %>%
  filter(date >= as.Date("1995-01-01"),
         date <= as.Date("2005-01-01")) %>%
  ggplot(.) + xlab("") + ylab("Taxes on specific goods and services") +
  geom_line(aes(x = date, y = obsValue/1000)) + theme_minimal() +
  theme(legend.title = element_blank(),
        legend.position = c(0.1, 0.25)) +
  scale_x_date(breaks = as.Date(paste0(seq(1920, 2100, 1), "-01-01")),
               labels = date_format("%Y")) +
  scale_y_continuous(breaks = seq(0, 2000, 2),
                     labels = dollar_format(suffix = " Bn€", prefix = "", accuracy = 1)) +
  geom_rect(data = data_frame(start = as.Date("1998-01-01"),
                              end = as.Date("2003-01-01")),
            aes(xmin = start, xmax = end, ymin = -Inf, ymax = +Inf),
            fill = viridis(3)[2], alpha = 0.2) +
  geom_vline(xintercept = as.Date("1998-01-01"), linetype = "dashed", color = viridis(3)[2]) +
  geom_vline(xintercept = as.Date("2003-01-01"), linetype = "dashed", color = viridis(3)[2])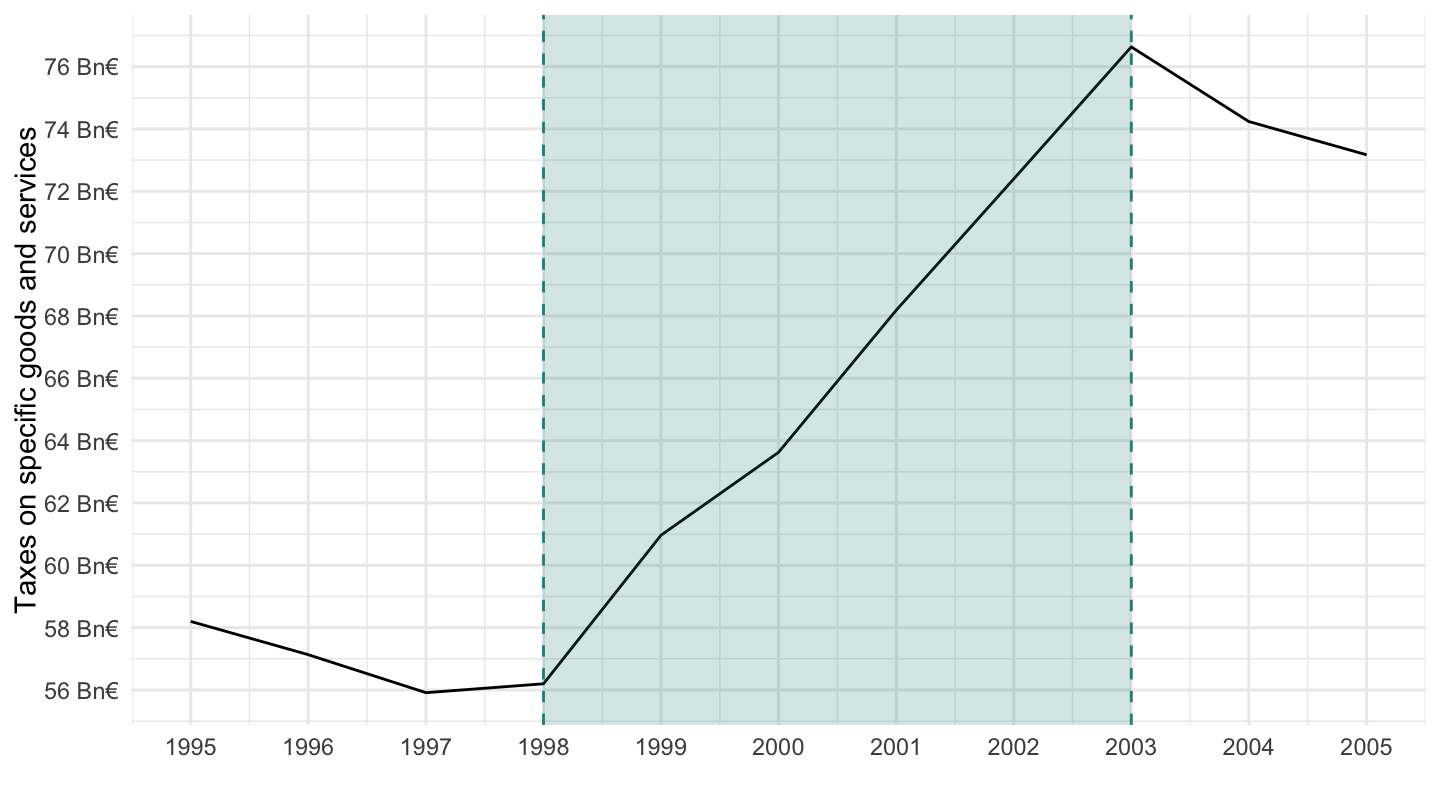
REVDEU %>%
  filter(GOV == "FED",
         TAX == "DEU_5121_L2") %>%
  year_to_date %>%
  filter(date >= as.Date("1995-01-01"),
         date <= as.Date("2005-01-01")) %>%
  ggplot(.) + xlab("") + ylab("Duty on mineral oils") +
  geom_line(aes(x = date, y = obsValue/1000)) + theme_minimal() +
  theme(legend.title = element_blank(),
        legend.position = c(0.1, 0.25)) +
  scale_x_date(breaks = as.Date(paste0(seq(1920, 2100, 1), "-01-01")),
               labels = date_format("%Y")) +
  scale_y_continuous(breaks = seq(0, 2000, 1),
                     labels = dollar_format(suffix = " Bn€", prefix = "", accuracy = 1)) +
  geom_rect(data = data_frame(start = as.Date("1998-01-01"),
                              end = as.Date("2003-01-01")),
            aes(xmin = start, xmax = end, ymin = -Inf, ymax = +Inf),
            fill = viridis(3)[2], alpha = 0.2) +
  geom_vline(xintercept = as.Date("1998-01-01"), linetype = "dashed", color = viridis(3)[2]) +
  geom_vline(xintercept = as.Date("2003-01-01"), linetype = "dashed", color = viridis(3)[2])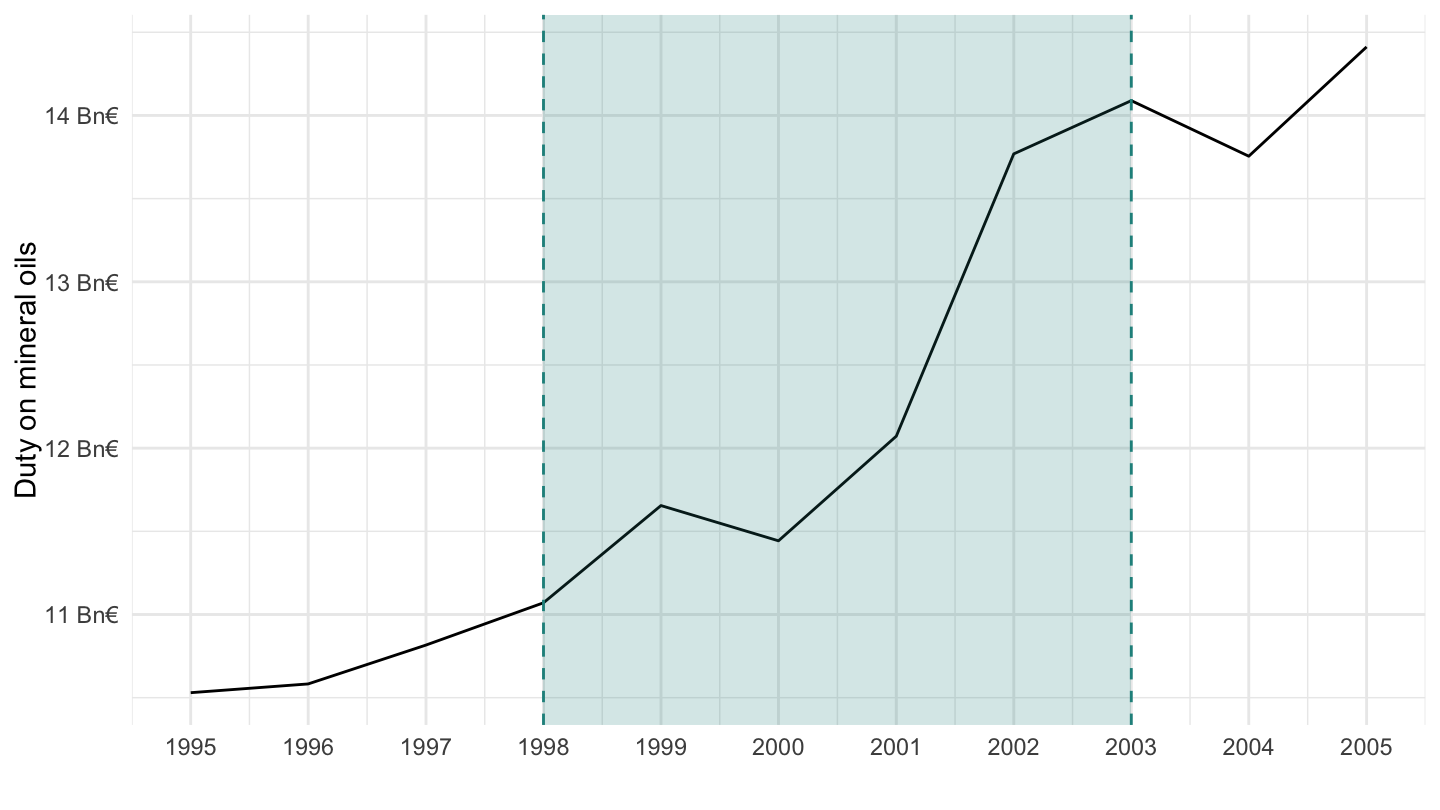
REVDEU %>%
  filter(GOV == "FED",
         TAX == "DEU_5121_L1") %>%
  year_to_date %>%
  filter(date >= as.Date("1995-01-01"),
         date <= as.Date("2005-01-01")) %>%
  ggplot(.) + xlab("") + ylab("Duty on mineral oils") +
  geom_line(aes(x = date, y = obsValue/1000)) + theme_minimal() +
  theme(legend.title = element_blank(),
        legend.position = c(0.1, 0.25)) +
  scale_x_date(breaks = as.Date(paste0(seq(1920, 2100, 1), "-01-01")),
               labels = date_format("%Y")) +
  scale_y_continuous(breaks = seq(0, 2000, 1),
                     labels = dollar_format(suffix = " Bn€", prefix = "", accuracy = 1)) +
  geom_rect(data = data_frame(start = as.Date("1998-01-01"),
                              end = as.Date("2003-01-01")),
            aes(xmin = start, xmax = end, ymin = -Inf, ymax = +Inf),
            fill = viridis(3)[2], alpha = 0.2) +
  geom_vline(xintercept = as.Date("1998-01-01"), linetype = "dashed", color = viridis(3)[2]) +
  geom_vline(xintercept = as.Date("2003-01-01"), linetype = "dashed", color = viridis(3)[2])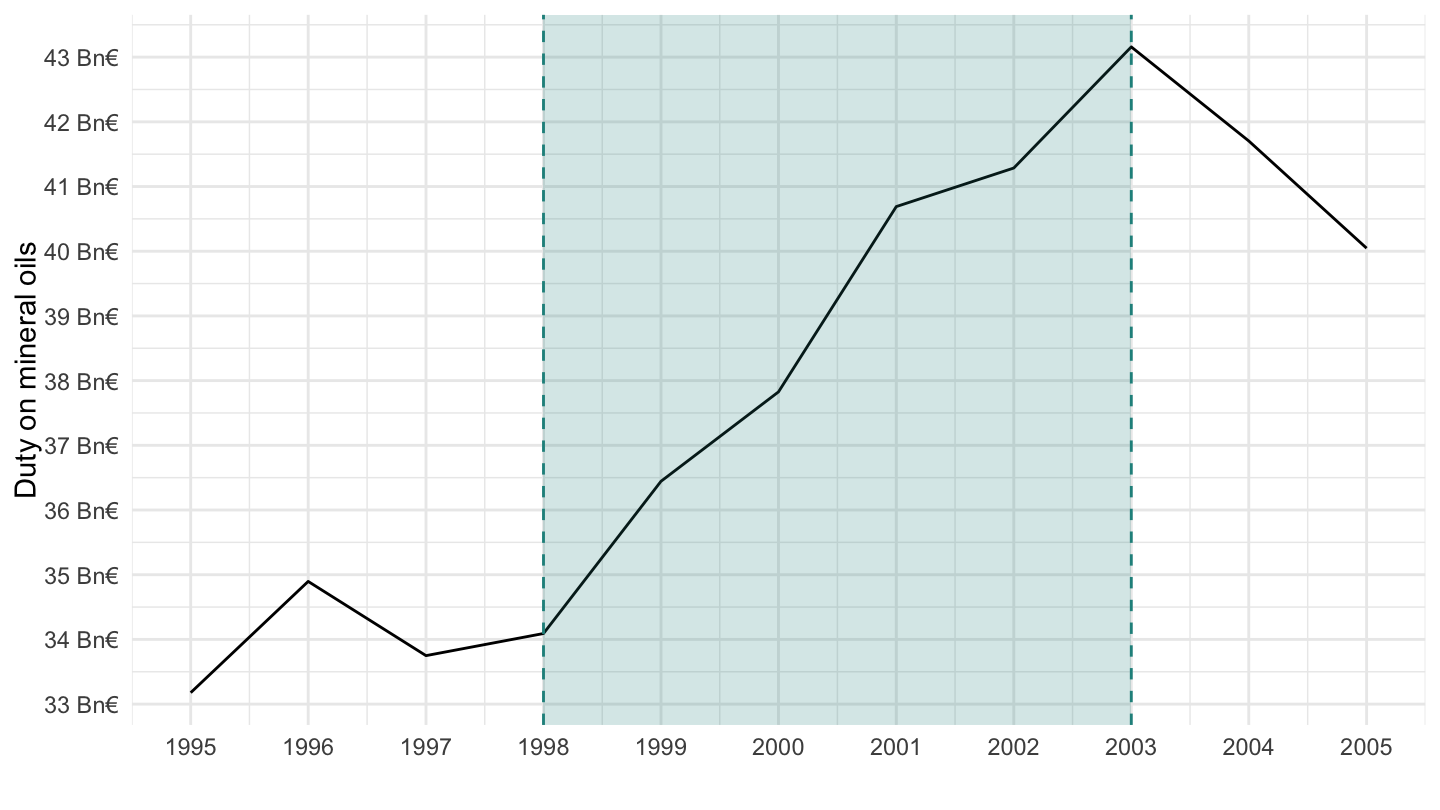
REVDEU %>%
  filter(GOV == "FED",
         TAX == "DEU_1210_L1") %>%
  year_to_date %>%
  filter(date >= as.Date("1995-01-01"),
         date <= as.Date("2005-01-01")) %>%
  ggplot(.) + xlab("") + ylab("Corporation tax") +
  geom_line(aes(x = date, y = obsValue/1000)) + theme_minimal() +
  theme(legend.title = element_blank(),
        legend.position = c(0.1, 0.25)) +
  scale_x_date(breaks = as.Date(paste0(seq(1920, 2100, 1), "-01-01")),
               labels = date_format("%Y")) +
  scale_y_continuous(breaks = seq(0, 2000, 1),
                     labels = dollar_format(suffix = " Bn€", prefix = "", accuracy = 1)) +
  geom_rect(data = data_frame(start = as.Date("1998-01-01"),
                              end = as.Date("2003-01-01")),
            aes(xmin = start, xmax = end, ymin = -Inf, ymax = +Inf),
            fill = viridis(3)[2], alpha = 0.2) +
  geom_vline(xintercept = as.Date("1998-01-01"), linetype = "dashed", color = viridis(3)[2]) +
  geom_vline(xintercept = as.Date("2003-01-01"), linetype = "dashed", color = viridis(3)[2])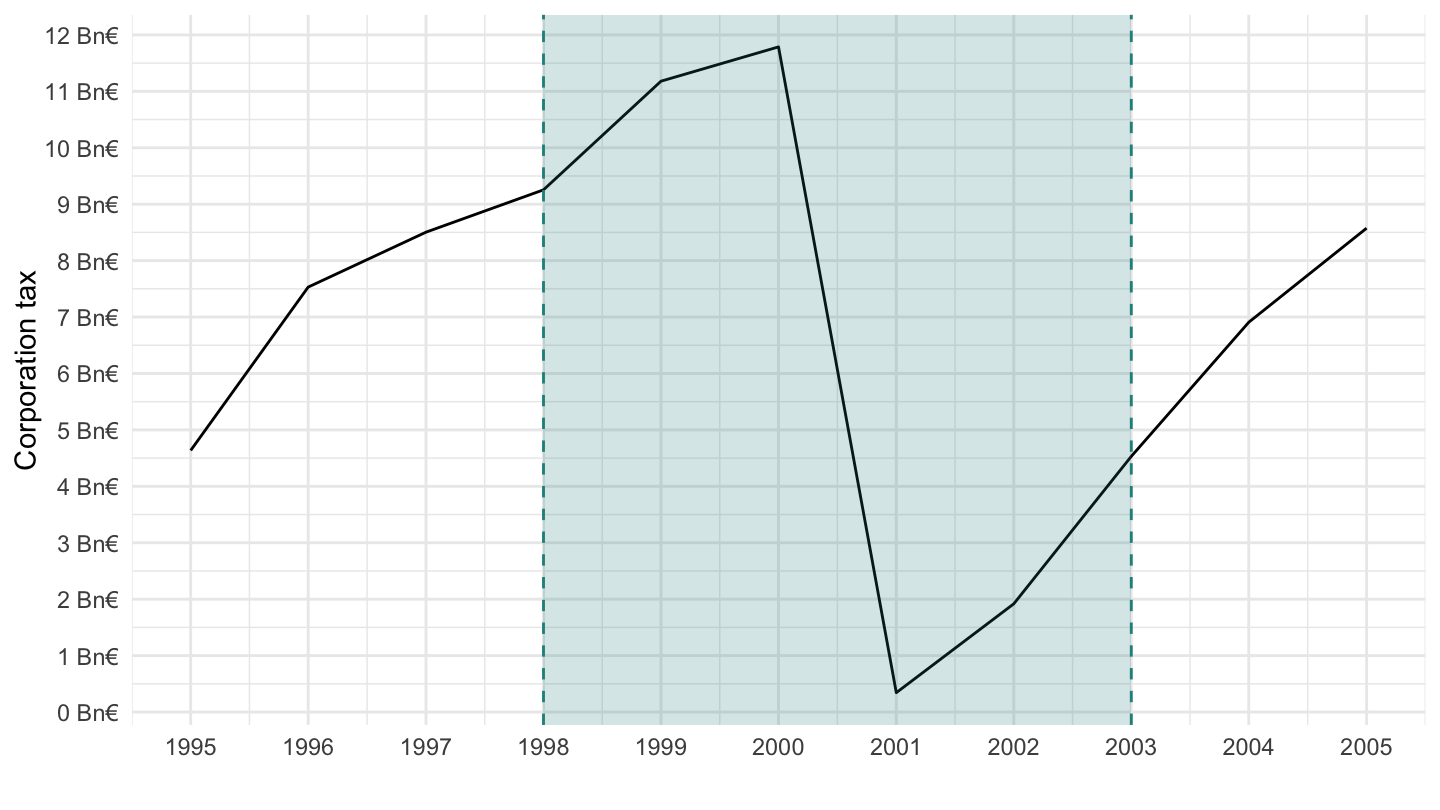
REVDEU %>%
  filter(GOV == "LOCAL",
         TAX == "DEU_1110_L5") %>%
  year_to_date %>%
  filter(date >= as.Date("1995-01-01"),
         date <= as.Date("2005-01-01")) %>%
  ggplot(.) + xlab("") + ylab("Enterprise tax") +
  geom_line(aes(x = date, y = obsValue/1000)) + theme_minimal() +
  theme(legend.title = element_blank(),
        legend.position = c(0.1, 0.25)) +
  scale_x_date(breaks = as.Date(paste0(seq(1920, 2100, 1), "-01-01")),
               labels = date_format("%Y")) +
  scale_y_continuous(breaks = seq(0, 2000, 1),
                     labels = dollar_format(suffix = " Bn€", prefix = "", accuracy = 1)) +
  geom_rect(data = data_frame(start = as.Date("1998-01-01"),
                              end = as.Date("2003-01-01")),
            aes(xmin = start, xmax = end, ymin = -Inf, ymax = +Inf),
            fill = viridis(3)[2], alpha = 0.2) +
  geom_vline(xintercept = as.Date("1998-01-01"), linetype = "dashed", color = viridis(3)[2]) +
  geom_vline(xintercept = as.Date("2003-01-01"), linetype = "dashed", color = viridis(3)[2])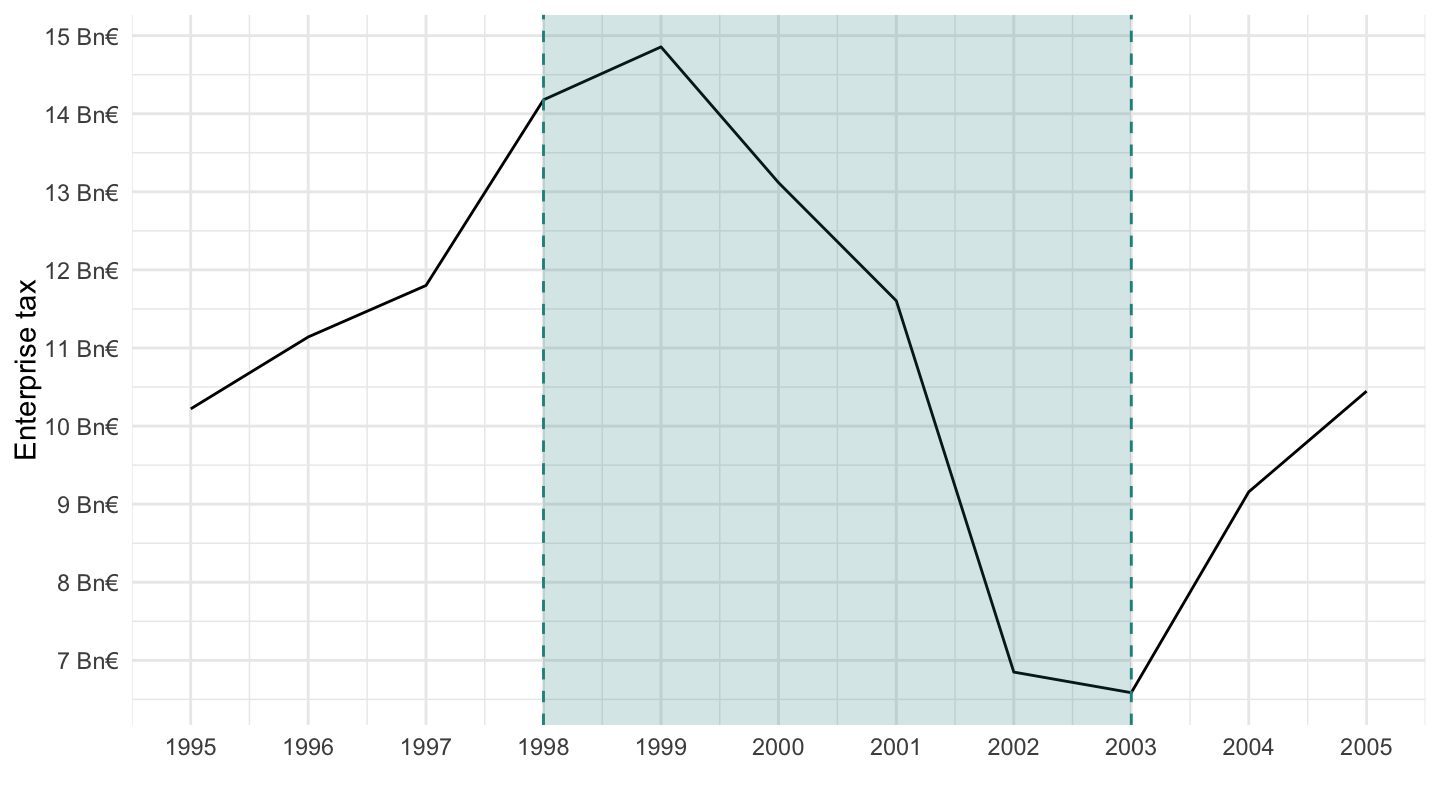
REVDEU %>%
  filter(GOV == "FED",
         TAX == "5121") %>%
  year_to_date %>%
  filter(date >= as.Date("1995-01-01"),
         date <= as.Date("2020-01-01")) %>%
  ggplot(.) + xlab("") + ylab("Excises") +
  geom_line(aes(x = date, y = obsValue/1000)) + theme_minimal() +
  theme(legend.title = element_blank(),
        legend.position = c(0.1, 0.25)) +
  scale_x_date(breaks = as.Date(paste0(seq(1920, 2100, 1), "-01-01")),
               labels = date_format("%Y")) +
  scale_y_continuous(breaks = seq(0, 2000, 2),
                     labels = dollar_format(suffix = " Bn€", prefix = "", accuracy = 1)) +
  geom_rect(data = data_frame(start = as.Date("1998-01-01"),
                              end = as.Date("2003-01-01")),
            aes(xmin = start, xmax = end, ymin = -Inf, ymax = +Inf),
            fill = viridis(3)[2], alpha = 0.2) +
  geom_vline(xintercept = as.Date("1998-01-01"), linetype = "dashed", color = viridis(3)[2]) +
  geom_vline(xintercept = as.Date("2003-01-01"), linetype = "dashed", color = viridis(3)[2])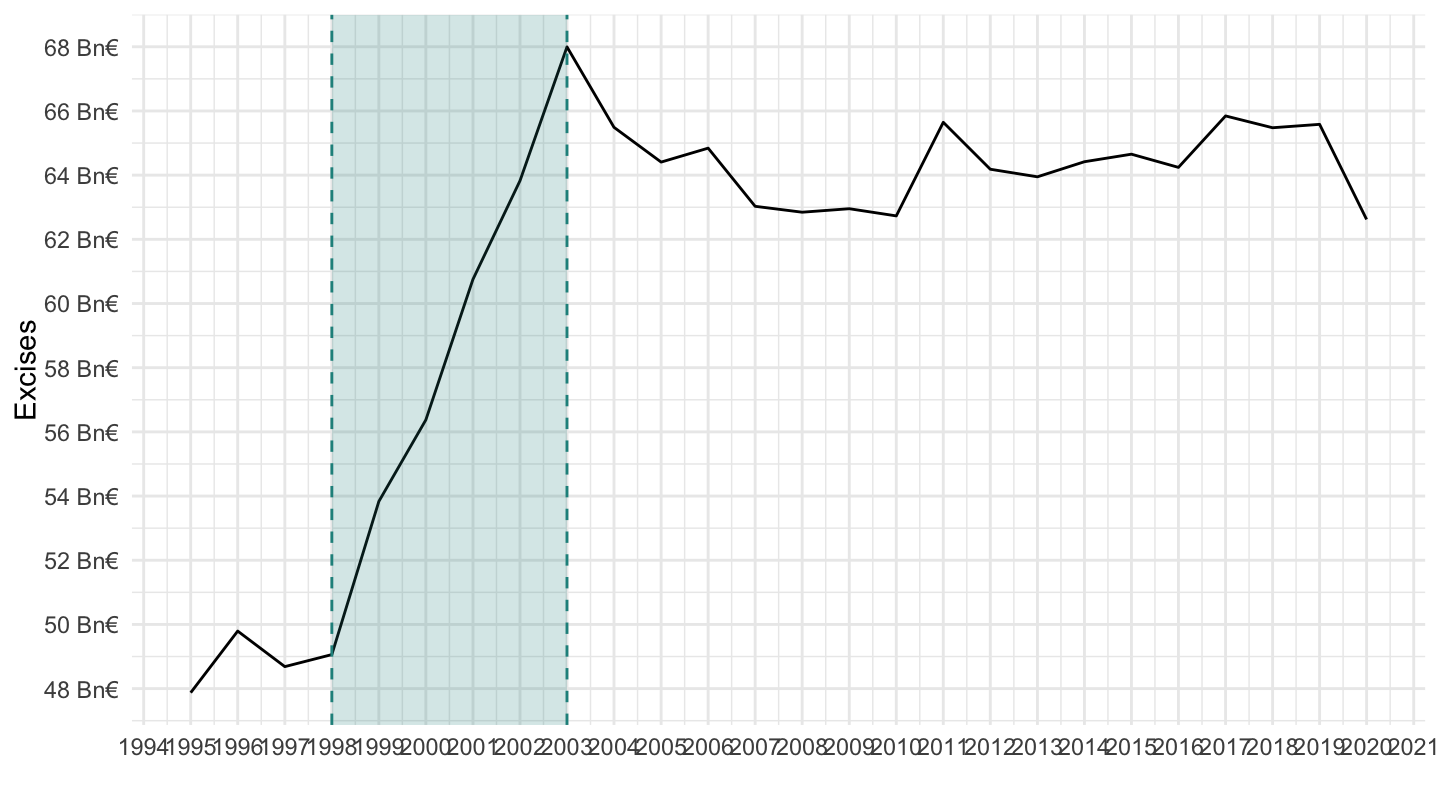
REVDEU %>%
  filter(GOV == "FED",
         TAX == "5120") %>%
  year_to_date %>%
  filter(date >= as.Date("1991-01-01"),
         date <= as.Date("2020-01-01")) %>%
  select(date, taxes_specific = obsValue) %>%
  left_join(PRICES_CPI_CPALTT01_IXOB %>%
              filter(LOCATION == "DEU") %>%
              select(date, CPI = CPALTT01_IXOB), by = "date") %>%
  mutate(taxes_specific2 = taxes_specific*CPI[24]/CPI) %>%
  ggplot(.) + xlab("") + ylab("Impôts spécifiques sur l'essence, le tabac, l'alcool, etc.") +
  geom_line(aes(x = date, y = taxes_specific2/1000)) + theme_minimal() +
  theme(legend.title = element_blank(),
        legend.position = c(0.1, 0.25)) +
  scale_x_date(breaks = as.Date(paste0(seq(1920, 2100, 1), "-01-01")),
               labels = date_format("%Y")) +
  scale_y_continuous(breaks = seq(0, 2000, 5),
                     labels = dollar_format(suffix = " Mds€", prefix = "", accuracy = 1)) +
  geom_rect(data = data_frame(start = as.Date("1998-01-01"),
                              end = as.Date("2003-01-01")),
            aes(xmin = start, xmax = end, ymin = -Inf, ymax = +Inf),
            fill = viridis(3)[2], alpha = 0.2) +
  geom_vline(xintercept = as.Date("1998-01-01"), linetype = "dashed", color = viridis(3)[2]) +
  geom_vline(xintercept = as.Date("2003-01-01"), linetype = "dashed", color = viridis(3)[2])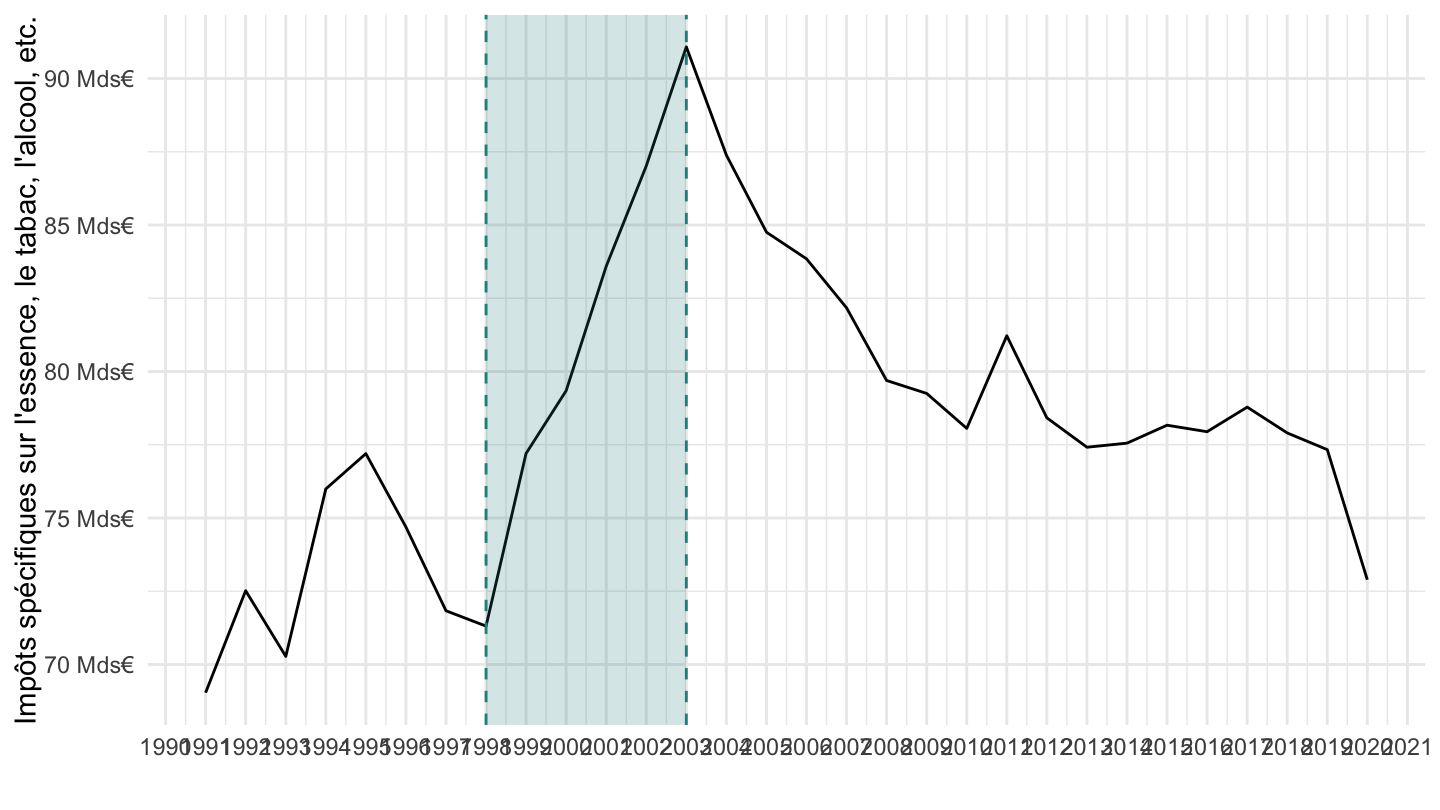
REVDEU %>%
  filter(GOV == "FED",
         TAX == "5120") %>%
  year_to_date %>%
  filter(date >= as.Date("1995-01-01"),
         date <= as.Date("2020-01-01")) %>%
  ggplot(.) + xlab("") + ylab("Taxes on specific goods and services") +
  geom_line(aes(x = date, y = obsValue/1000)) + theme_minimal() +
  theme(legend.title = element_blank(),
        legend.position = c(0.1, 0.25)) +
  scale_x_date(breaks = as.Date(paste0(seq(1920, 2100, 1), "-01-01")),
               labels = date_format("%Y")) +
  scale_y_continuous(breaks = seq(0, 2000, 2),
                     labels = dollar_format(suffix = " Bn€", prefix = "", accuracy = 1)) +
  geom_rect(data = data_frame(start = as.Date("1998-01-01"),
                              end = as.Date("2003-01-01")),
            aes(xmin = start, xmax = end, ymin = -Inf, ymax = +Inf),
            fill = viridis(3)[2], alpha = 0.2) +
  geom_vline(xintercept = as.Date("1998-01-01"), linetype = "dashed", color = viridis(3)[2]) +
  geom_vline(xintercept = as.Date("2003-01-01"), linetype = "dashed", color = viridis(3)[2])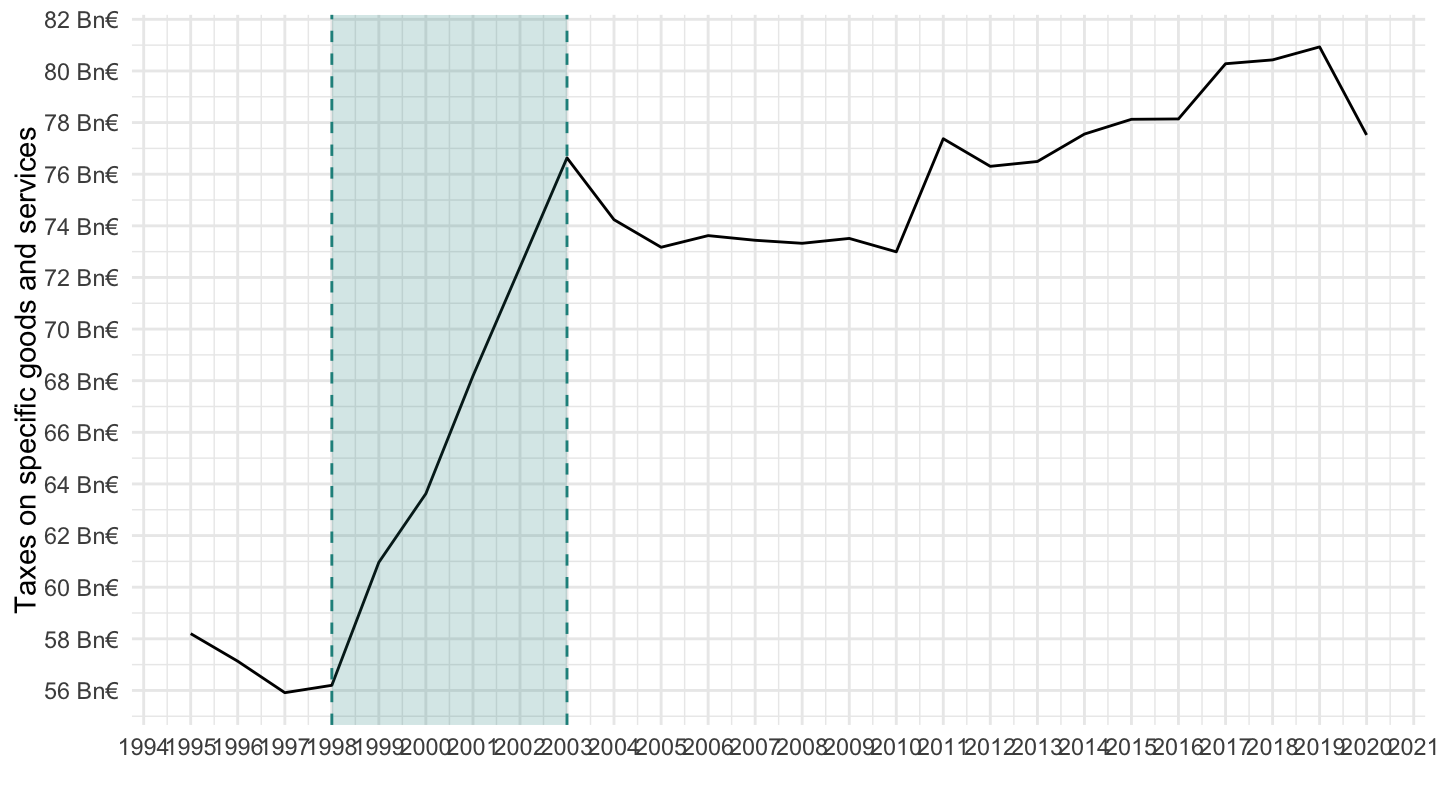
REVDEU %>%
  filter(GOV == "FED",
         TAX == "DEU_5121_L15") %>%
  year_to_date %>%
  filter(date >= as.Date("1995-01-01"),
         date <= as.Date("2020-01-01")) %>%
  ggplot(.) + xlab("") + ylab("Duty on Alcohol") +
  geom_line(aes(x = date, y = obsValue/1000)) + theme_minimal() +
  theme(legend.title = element_blank(),
        legend.position = c(0.1, 0.25)) +
  scale_x_date(breaks = as.Date(paste0(seq(1920, 2100, 1), "-01-01")),
               labels = date_format("%Y")) +
  scale_y_continuous(breaks = seq(0, 2000, 1),
                     labels = dollar_format(suffix = " Bn€", prefix = "", accuracy = 1)) +
  geom_rect(data = data_frame(start = as.Date("1998-01-01"),
                              end = as.Date("2003-01-01")),
            aes(xmin = start, xmax = end, ymin = -Inf, ymax = +Inf),
            fill = viridis(3)[2], alpha = 0.2) +
  geom_vline(xintercept = as.Date("1998-01-01"), linetype = "dashed", color = viridis(3)[2]) +
  geom_vline(xintercept = as.Date("2003-01-01"), linetype = "dashed", color = viridis(3)[2])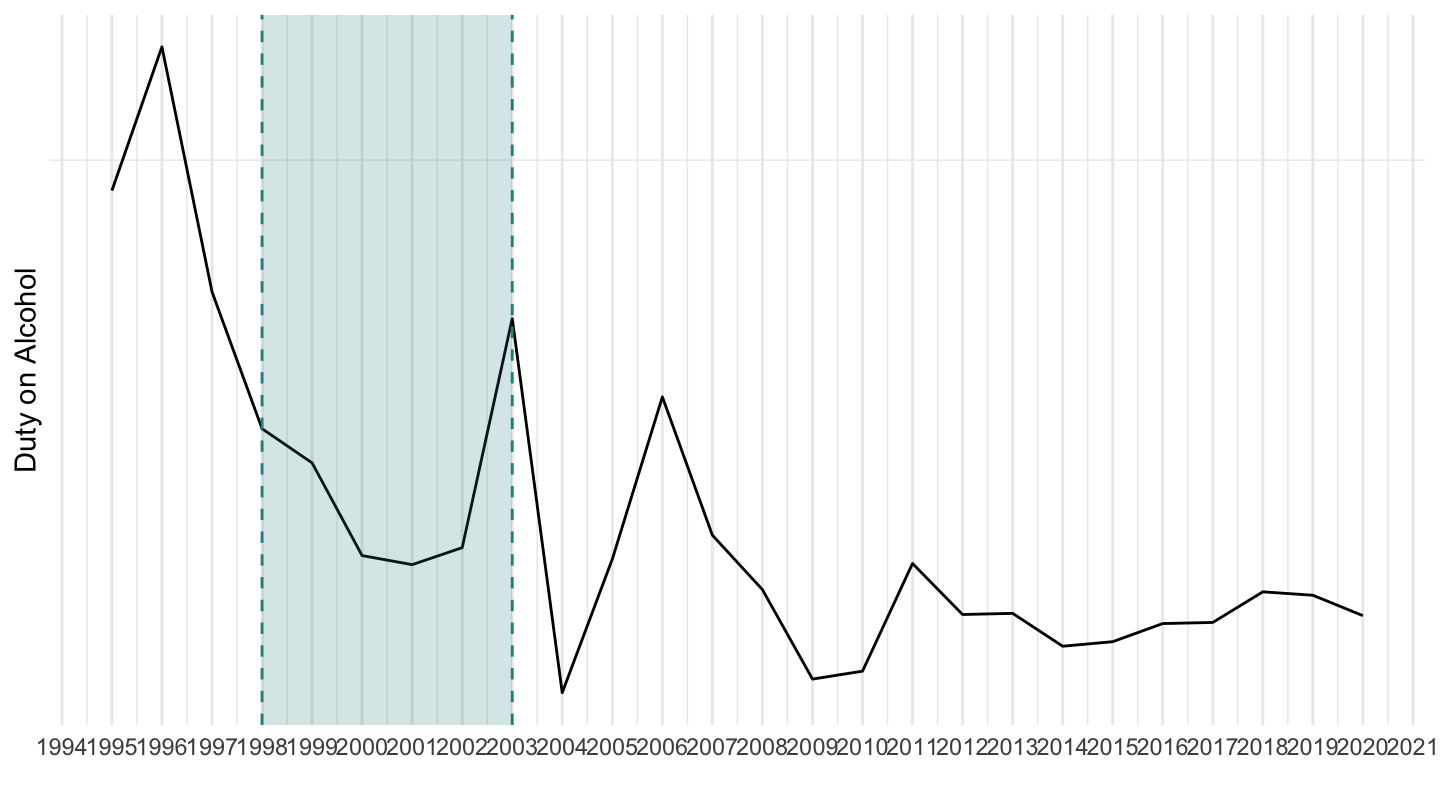
REVDEU %>%
  filter(GOV == "FED",
         TAX == "DEU_5121_L2") %>%
  year_to_date %>%
  filter(date >= as.Date("1995-01-01"),
         date <= as.Date("2020-01-01")) %>%
  ggplot(.) + xlab("") + ylab("Duty on Tobacco") +
  geom_line(aes(x = date, y = obsValue/1000)) + theme_minimal() +
  theme(legend.title = element_blank(),
        legend.position = c(0.1, 0.25)) +
  scale_x_date(breaks = as.Date(paste0(seq(1920, 2100, 1), "-01-01")),
               labels = date_format("%Y")) +
  scale_y_continuous(breaks = seq(0, 2000, 1),
                     labels = dollar_format(suffix = " Bn€", prefix = "", accuracy = 1)) +
  geom_rect(data = data_frame(start = as.Date("1998-01-01"),
                              end = as.Date("2003-01-01")),
            aes(xmin = start, xmax = end, ymin = -Inf, ymax = +Inf),
            fill = viridis(3)[2], alpha = 0.2) +
  geom_vline(xintercept = as.Date("1998-01-01"), linetype = "dashed", color = viridis(3)[2]) +
  geom_vline(xintercept = as.Date("2003-01-01"), linetype = "dashed", color = viridis(3)[2])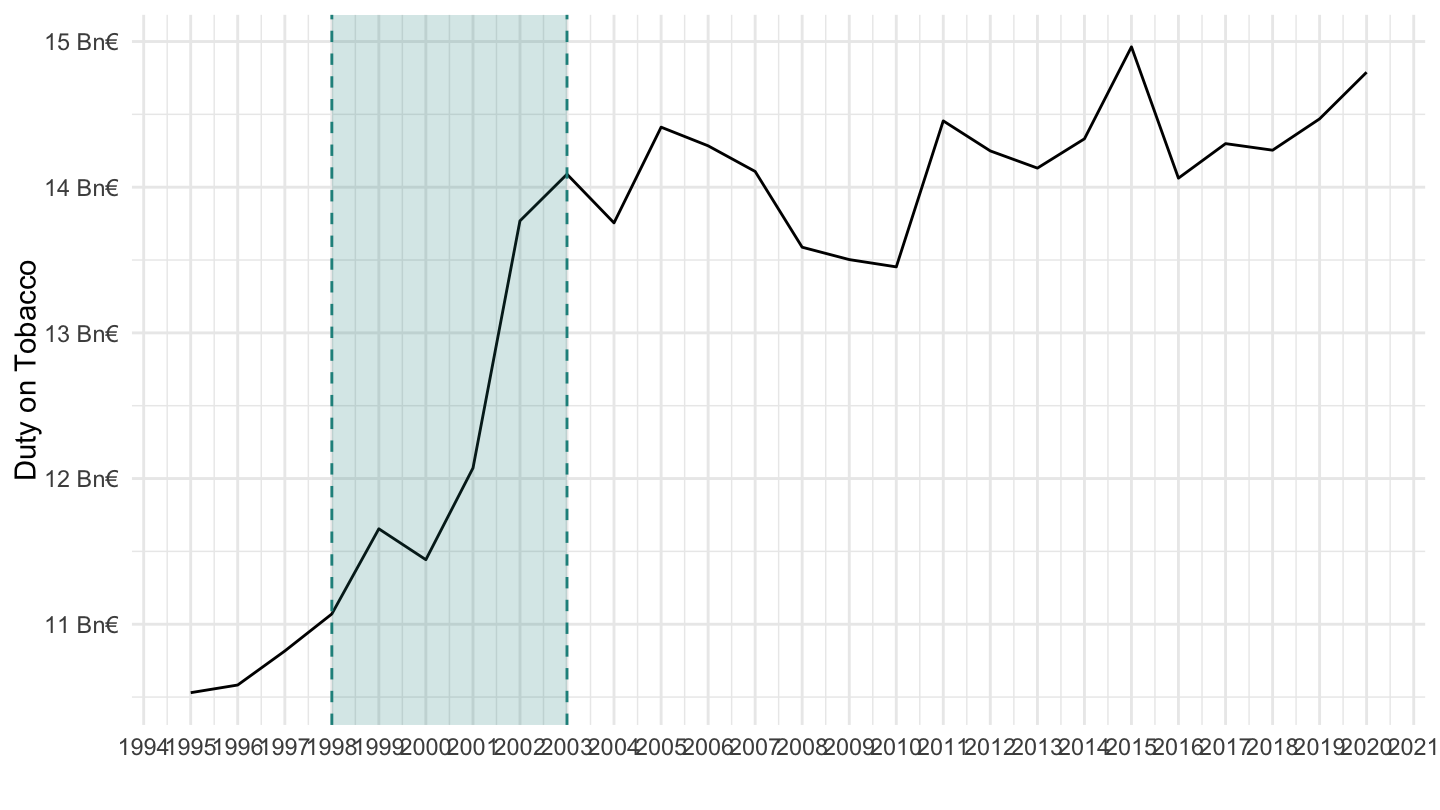
REVDEU %>%
  filter(GOV == "FED",
         TAX == "DEU_5121_L1") %>%
  year_to_date %>%
  filter(date >= as.Date("1995-01-01"),
         date <= as.Date("2020-01-01")) %>%
  ggplot(.) + xlab("") + ylab("Duty on mineral oils") +
  geom_line(aes(x = date, y = obsValue/1000)) + theme_minimal() +
  theme(legend.title = element_blank(),
        legend.position = c(0.1, 0.25)) +
  scale_x_date(breaks = as.Date(paste0(seq(1920, 2100, 1), "-01-01")),
               labels = date_format("%Y")) +
  scale_y_continuous(breaks = seq(0, 2000, 1),
                     labels = dollar_format(suffix = " Bn€", prefix = "", accuracy = 1)) +
  geom_rect(data = data_frame(start = as.Date("1998-01-01"),
                              end = as.Date("2003-01-01")),
            aes(xmin = start, xmax = end, ymin = -Inf, ymax = +Inf),
            fill = viridis(3)[2], alpha = 0.2) +
  geom_vline(xintercept = as.Date("1998-01-01"), linetype = "dashed", color = viridis(3)[2]) +
  geom_vline(xintercept = as.Date("2003-01-01"), linetype = "dashed", color = viridis(3)[2])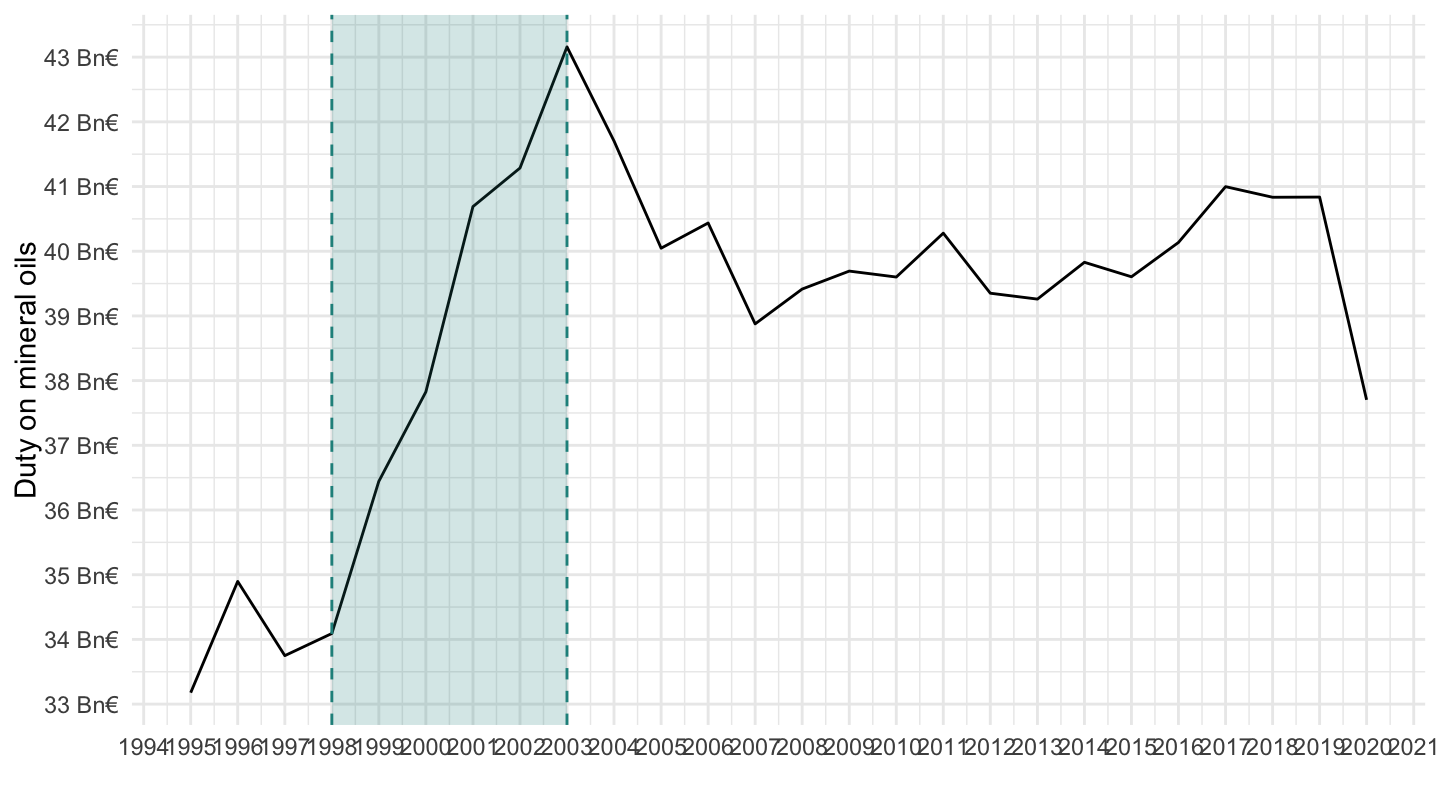
REVDEU %>%
  filter(GOV == "FED",
         TAX == "DEU_1210_L1") %>%
  year_to_date %>%
  filter(date >= as.Date("1995-01-01"),
         date <= as.Date("2020-01-01")) %>%
  ggplot(.) + xlab("") + ylab("Corporation tax") +
  geom_line(aes(x = date, y = obsValue/1000)) + theme_minimal() +
  theme(legend.title = element_blank(),
        legend.position = c(0.1, 0.25)) +
  scale_x_date(breaks = as.Date(paste0(seq(1920, 2100, 1), "-01-01")),
               labels = date_format("%Y")) +
  scale_y_continuous(breaks = seq(0, 2000, 1),
                     labels = dollar_format(suffix = " Bn€", prefix = "", accuracy = 1)) +
  geom_rect(data = data_frame(start = as.Date("1998-01-01"),
                              end = as.Date("2003-01-01")),
            aes(xmin = start, xmax = end, ymin = -Inf, ymax = +Inf),
            fill = viridis(3)[2], alpha = 0.2) +
  geom_vline(xintercept = as.Date("1998-01-01"), linetype = "dashed", color = viridis(3)[2]) +
  geom_vline(xintercept = as.Date("2003-01-01"), linetype = "dashed", color = viridis(3)[2])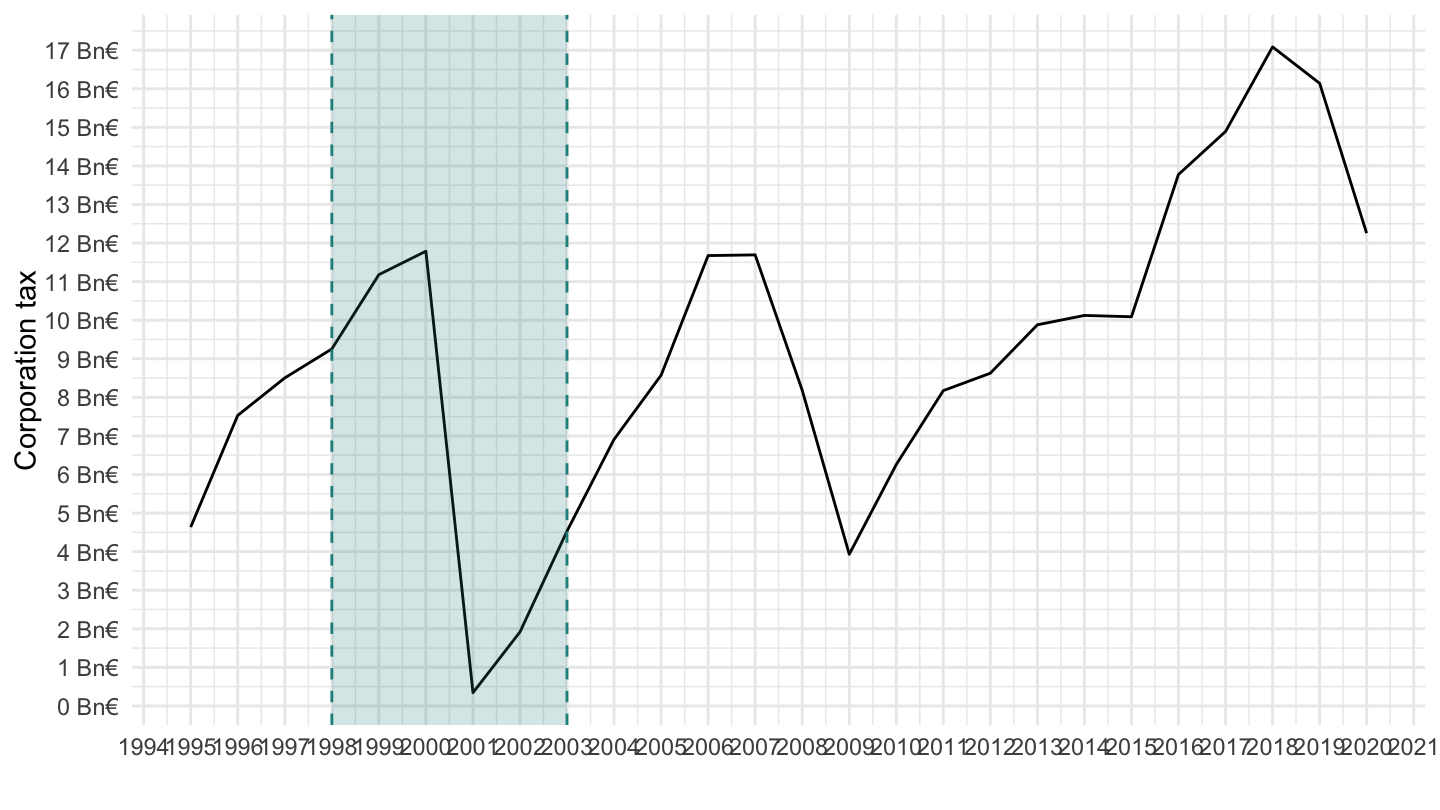
REVDEU %>%
  filter(GOV == "LOCAL",
         TAX == "DEU_1110_L5") %>%
  year_to_date %>%
  filter(date >= as.Date("1995-01-01"),
         date <= as.Date("2020-01-01")) %>%
  ggplot(.) + xlab("") + ylab("Enterprise tax") +
  geom_line(aes(x = date, y = obsValue/1000)) + theme_minimal() +
  theme(legend.title = element_blank(),
        legend.position = c(0.1, 0.25)) +
  scale_x_date(breaks = as.Date(paste0(seq(1920, 2100, 1), "-01-01")),
               labels = date_format("%Y")) +
  scale_y_continuous(breaks = seq(0, 2000, 1),
                     labels = dollar_format(suffix = " Bn€", prefix = "", accuracy = 1)) +
  geom_rect(data = data_frame(start = as.Date("1998-01-01"),
                              end = as.Date("2003-01-01")),
            aes(xmin = start, xmax = end, ymin = -Inf, ymax = +Inf),
            fill = viridis(3)[2], alpha = 0.2) +
  geom_vline(xintercept = as.Date("1998-01-01"), linetype = "dashed", color = viridis(3)[2]) +
  geom_vline(xintercept = as.Date("2003-01-01"), linetype = "dashed", color = viridis(3)[2])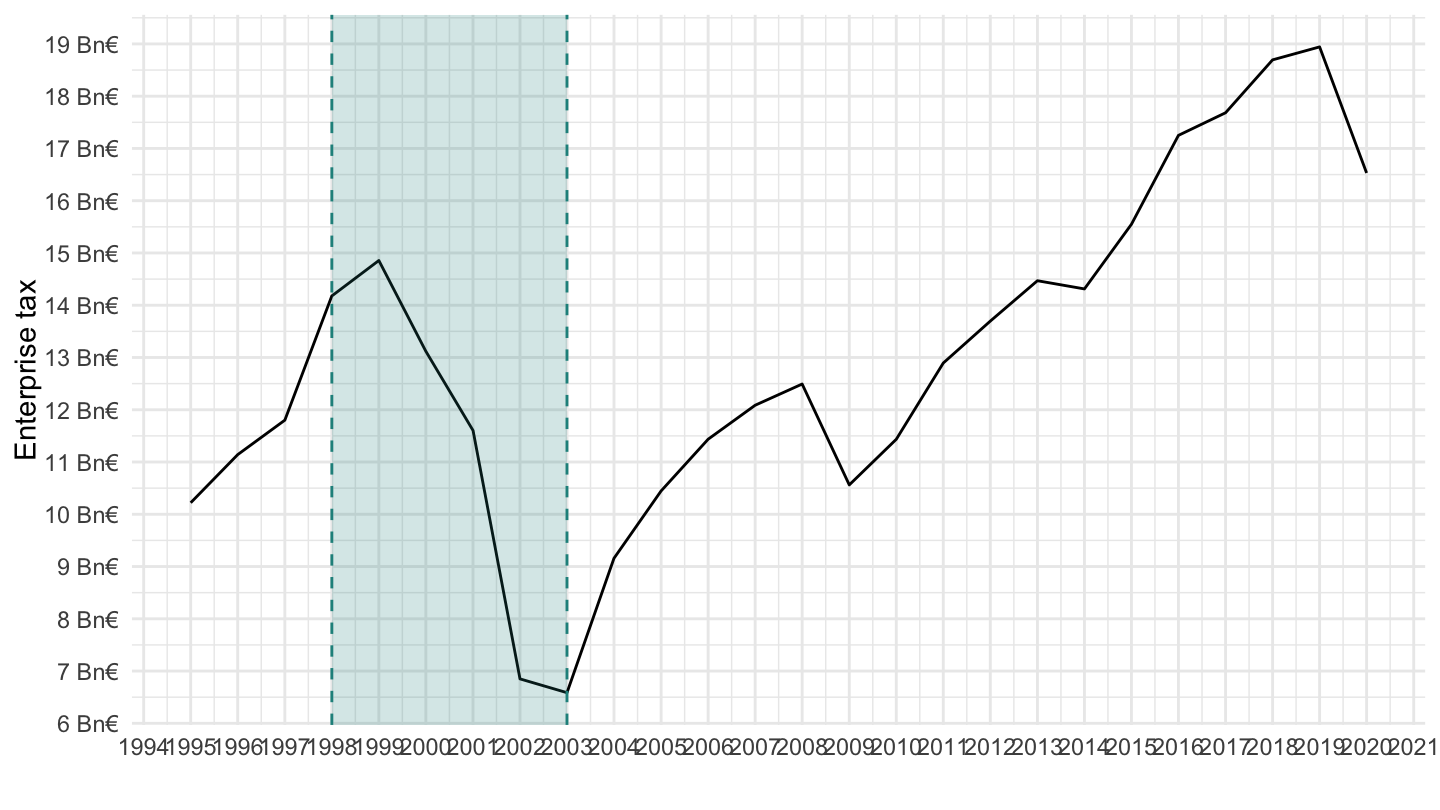
REVDEU %>%
  filter(GOV == "FED",
         TAX == "5120") %>%
  year_to_date %>%
  filter(date <= as.Date("2020-01-01")) %>%
  ggplot(.) + xlab("") + ylab("Taxes on specific goods and services") +
  geom_line(aes(x = date, y = obsValue/1000)) + theme_minimal() +
  theme(legend.title = element_blank(),
        legend.position = c(0.1, 0.25)) +
  scale_x_date(breaks = as.Date(paste0(seq(1920, 2100, 5), "-01-01")),
               labels = date_format("%Y")) +
  scale_y_continuous(breaks = seq(0, 2000, 5),
                     labels = dollar_format(suffix = " Bn€", prefix = "", accuracy = 1)) +
  geom_rect(data = data_frame(start = as.Date("1998-01-01"),
                              end = as.Date("2003-01-01")),
            aes(xmin = start, xmax = end, ymin = -Inf, ymax = +Inf),
            fill = viridis(3)[2], alpha = 0.2) +
  geom_vline(xintercept = as.Date("1998-01-01"), linetype = "dashed", color = viridis(3)[2]) +
  geom_vline(xintercept = as.Date("2003-01-01"), linetype = "dashed", color = viridis(3)[2])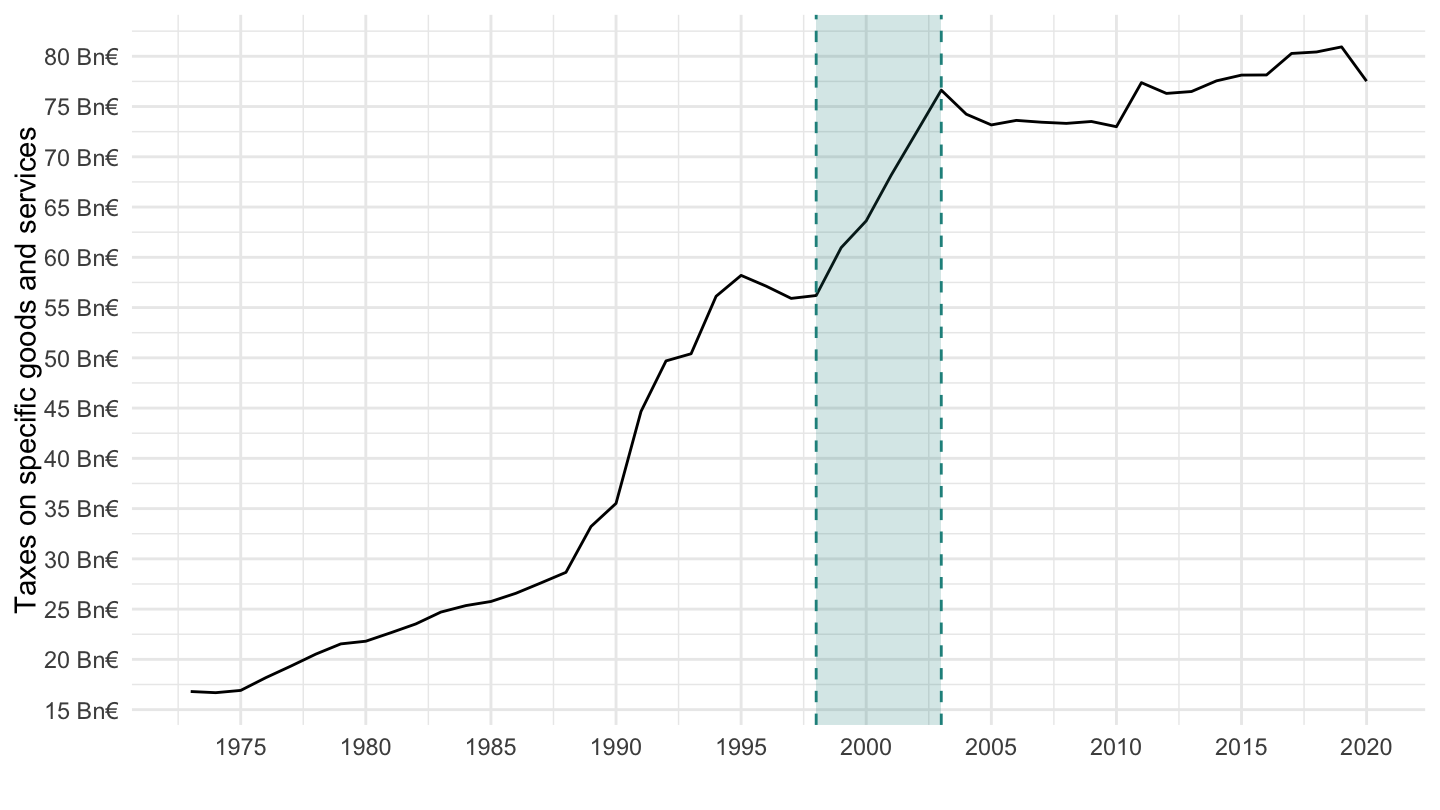
REVDEU %>%
  filter(GOV == "NES",
         TAX == "5111") %>%
  year_to_date %>%
  filter(date <= as.Date("2020-01-01")) %>%
  ggplot(.) + xlab("") + ylab("Value Added Tax") +
  geom_line(aes(x = date, y = obsValue/1000)) + theme_minimal() +
  theme(legend.title = element_blank(),
        legend.position = c(0.1, 0.25)) +
  scale_x_date(breaks = as.Date(paste0(seq(1920, 2100, 5), "-01-01")),
               labels = date_format("%Y")) +
  scale_y_continuous(breaks = seq(0, 2000, 20),
                     labels = dollar_format(suffix = " Bn€", prefix = "", accuracy = 1))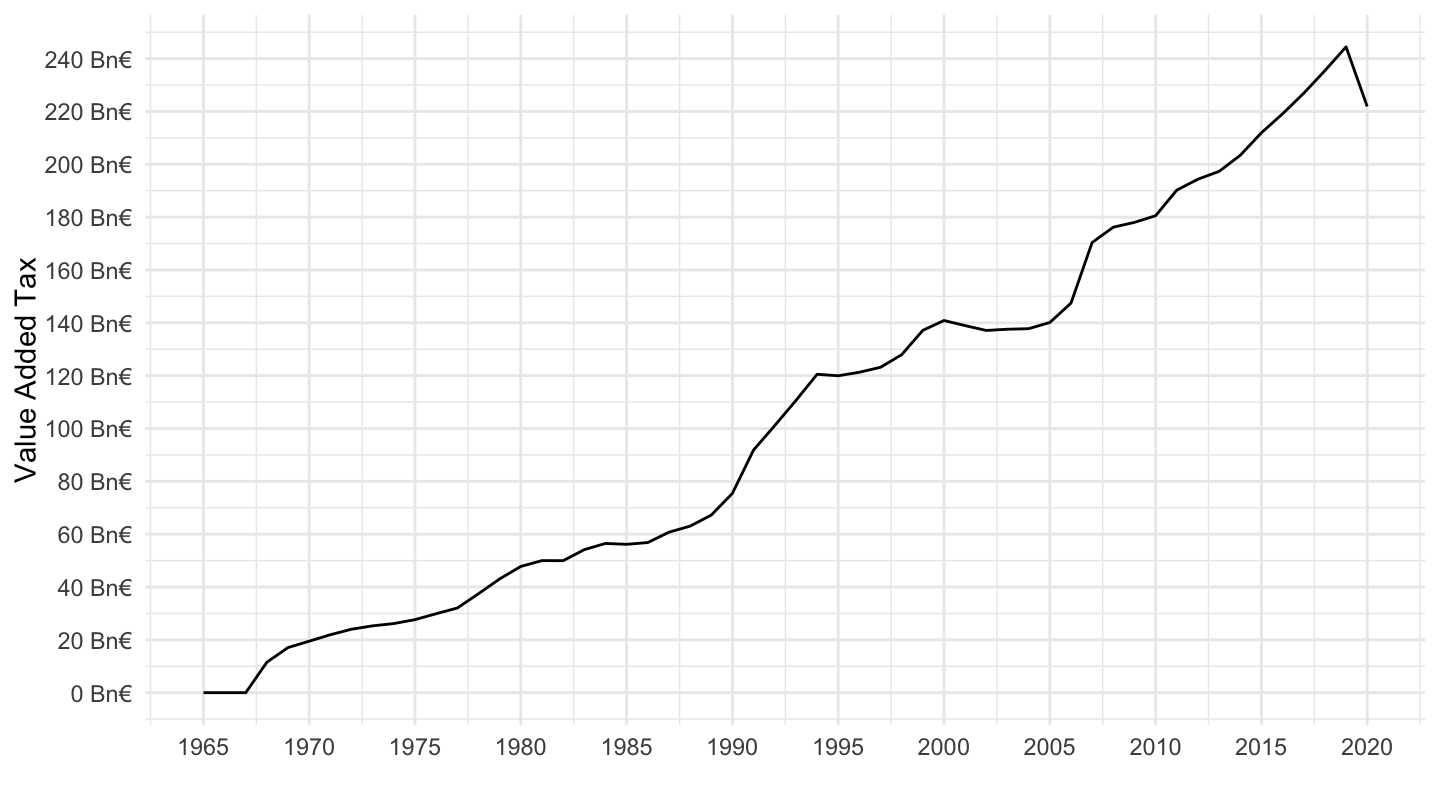
REVDEU %>%
  year_to_date() %>%
  filter(date == as.Date("2018-01-01")) %>%
  filter(obsValue != 0) %>%
  left_join(REVDEU_var$TAX, by = "TAX") %>%
  select(TAX, Tax, GOV, value = obsValue) %>%
  arrange(-value) %>%
  {if (is_html_output()) datatable(., filter = 'top', rownames = F) else .}