Code
tibble(LAST_DOWNLOAD = as.Date(file.info("~/iCloud/website/data/oecd/REV.RData")$mtime)) %>%
print_table_conditional()| LAST_DOWNLOAD |
|---|
| 2024-06-30 |
Data - OECD
tibble(LAST_DOWNLOAD = as.Date(file.info("~/iCloud/website/data/oecd/REV.RData")$mtime)) %>%
print_table_conditional()| LAST_DOWNLOAD |
|---|
| 2024-06-30 |
| LAST_COMPILE |
|---|
| 2026-07-24 |
REV %>%
  group_by(obsTime) %>%
  summarise(Nobs = n()) %>%
  arrange(desc(obsTime)) %>%
  head(1) %>%
print_table_conditional()| obsTime | Nobs |
|---|---|
| 2022 | 32954 |
REV %>%
  left_join(REV_var$COU, by = "COU") %>%
  group_by(COU, Cou) %>%
  summarise(Nobs = n()) %>%
  arrange(-Nobs) %>%
  mutate(Flag = gsub(" ", "-", str_to_lower(gsub(" ", "-", Cou))),
         Flag = paste0('<img src="../../icon/flag/vsmall/', Flag, '.png" alt="Flag">')) %>%
  select(Flag, everything()) %>%
{if (is_html_output()) datatable(., filter = 'top', rownames = F, escape = F) else .}REV %>%
left_join(REV_var$GOV, by = "GOV") %>%
group_by(GOV, Gov) %>%
summarise(Nobs = n()) %>%
arrange(-Nobs) %>%
print_table_conditional()| GOV | Gov | Nobs |
|---|---|---|
| NES | Total | 449993 |
| FED | Federal or Central government | 366827 |
| LOCAL | Local government | 295410 |
| SOCSEC | Social Security Funds | 173085 |
| SUPRA | Supranational | 113873 |
| STATE | State/Regional | 101175 |
REV %>%
  left_join(REV_var$TAX, by = "TAX") %>%
  group_by(TAX, Tax) %>%
  summarise(Nobs = n()) %>%
  arrange(-Nobs) %>%
print_table_conditional()REV %>%
left_join(REV_var$VAR, by = "VAR") %>%
group_by(VAR, Var) %>%
summarise(Nobs = n()) %>%
arrange(-Nobs) %>%
print_table_conditional()| VAR | Var | Nobs |
|---|---|---|
| TAXGDP | Tax revenue as % of GDP | 385109 |
| TAXPER | Tax revenue as % of total taxation | 377750 |
| TAXUSD | Total tax revenue in USD | 369267 |
| TAXNAT | Tax revenue in national currency | 359645 |
| TAXLOG | Tax revenues of sub-sectors of general government as % of total tax revenues | 8592 |
REV %>%
  group_by(obsTime) %>%
  summarise(Nobs = n()) %>%
  arrange(desc(obsTime)) %>%
print_table_conditional()REV %>%
filter(obsTime %in% c("2019", "1999", "1989"),
VAR == "TAXGDP",
TAX == "4100",
GOV == "NES") %>%
left_join(REV_var$COU, by = "COU") %>%
select(COU, Cou, obsTime, obsValue) %>%
spread(obsTime, obsValue) %>%
arrange(-`2019`) %>%
mutate(Flag = gsub(" ", "-", str_to_lower(gsub(" ", "-", Cou))),
Flag = paste0('<img src="../../icon/flag/vsmall/', Flag, '.png" alt="Flag">')) %>%
select(Flag, everything()) %>%
{if (is_html_output()) datatable(., filter = 'top', rownames = F, escape = F) else .}REV %>%
filter(COU %in% c("DEU", "FRA", "ITA", "ESP", "GBR"),
obsTime == "2018",
VAR == "TAXGDP",
GOV == "NES") %>%
left_join(REV_var$TAX, by = "TAX") %>%
left_join(REV_var$COU, by = "COU") %>%
mutate(obsValue = round(obsValue, 2)) %>%
select(TAX, Tax, Cou, obsValue) %>%
mutate(Cou = gsub(" ", "-", str_to_lower(gsub(" ", "-", Cou))),
Cou = paste0('<img src="../../icon/flag/vsmall/', Cou, '.png" alt="Flag">')) %>%
spread(Cou, obsValue) %>%
{if (is_html_output()) datatable(., filter = 'top', rownames = F, escape = F) else .}REV %>%
filter(COU %in% c("DEU", "FRA", "ITA", "ESP", "GBR"),
obsTime == "2018",
TAX %in% c("TOTALTAX", "1000", "1100", "1200", "2000", "2100",
"2200", "3000", "4000", "5000", "5110", "5120"),
VAR == "TAXGDP",
GOV == "NES") %>%
left_join(REV_var$TAX, by = "TAX") %>%
left_join(REV_var$COU, by = "COU") %>%
mutate(obsValue = round(obsValue, 2)) %>%
select(TAX, Tax, Cou, obsValue) %>%
mutate(Cou = gsub(" ", "-", str_to_lower(gsub(" ", "-", Cou))),
Cou = paste0('<img src="../../icon/flag/vsmall/', Cou, '.png" alt="Flag">')) %>%
spread(Cou, obsValue) %>%
{if (is_html_output()) datatable(., filter = 'top', rownames = F, escape = F, options = list(pageLength = 20)) else .}REV %>%
filter(COU %in% c("DEU", "FRA", "ITA", "ESP", "GBR"),
TAX == "TOTALTAX",
VAR == "TAXGDP",
GOV == "NES") %>%
left_join(REV_var$COU, by = "COU") %>%
year_to_date %>%
mutate(obsValue = obsValue / 100) %>%
left_join(colors, by = c("Cou" = "country")) %>%
ggplot + geom_line(aes(x = date, y = obsValue, color = color)) +
geom_image(data = . %>%
filter(date == as.Date("2019-01-01")) %>%
mutate(image = paste0("../../icon/flag/", str_to_lower(gsub(" ", "-", Cou)), ".png")),
aes(x = date, y = obsValue, image = image), asp = 1.5) +
ylab("Total tax revenue (% of GDP)") + xlab("") + theme_minimal() + scale_color_identity() +
scale_x_date(breaks = seq(1920, 2025, 5) %>% paste0("-01-01") %>% as.Date,
labels = date_format("%y")) +
scale_y_continuous(breaks = 0.01*seq(0, 60, 5),
labels = scales::percent_format(accuracy = 1))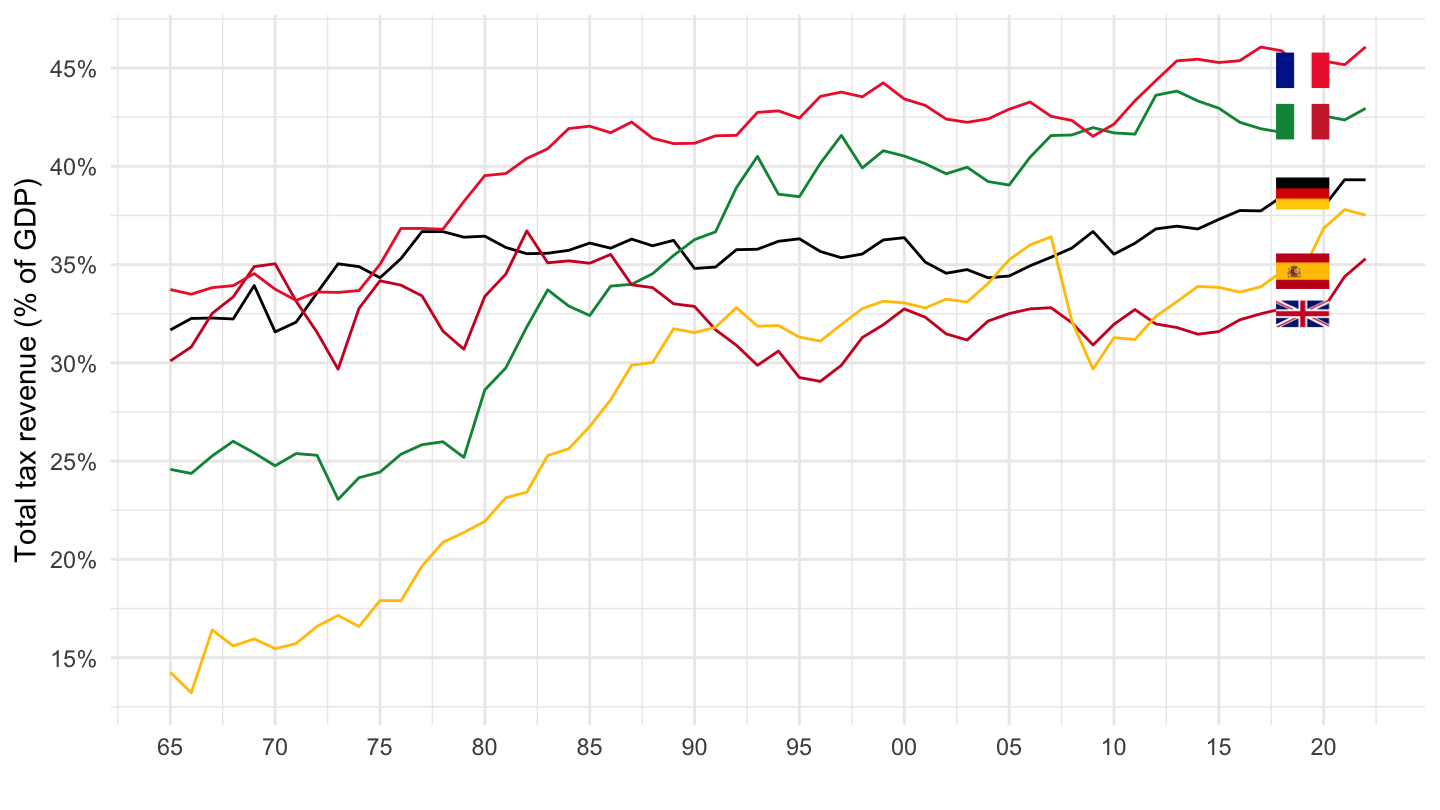
REV %>%
  filter(COU %in% c("DEU", "FRA", "ITA", "ESP", "GBR"),
         TAX == "1000",
         VAR == "TAXGDP",
         GOV == "NES") %>%
  left_join(REV_var$COU, by = "COU") %>%
  year_to_date %>%
  mutate(obsValue = obsValue / 100) %>%
  left_join(colors, by = c("Cou" = "country")) %>%
  ggplot + geom_line(aes(x = date, y = obsValue, color = color)) +
  geom_image(data = . %>%
               filter(date == as.Date("2019-01-01")) %>%
               mutate(image = paste0("../../icon/flag/", str_to_lower(gsub(" ", "-", Cou)), ".png")),
             aes(x = date, y = obsValue, image = image), asp = 1.5) +
  ylab("Taxes on income, profits and capital gains (% of GDP)") + xlab("") + theme_minimal() + scale_color_identity() +
  scale_x_date(breaks = seq(1920, 2025, 5) %>% paste0("-01-01") %>% as.Date,
               labels = date_format("%y")) +
  scale_y_continuous(breaks = 0.01*seq(0, 60, 1),
                     labels = scales::percent_format(accuracy = 1))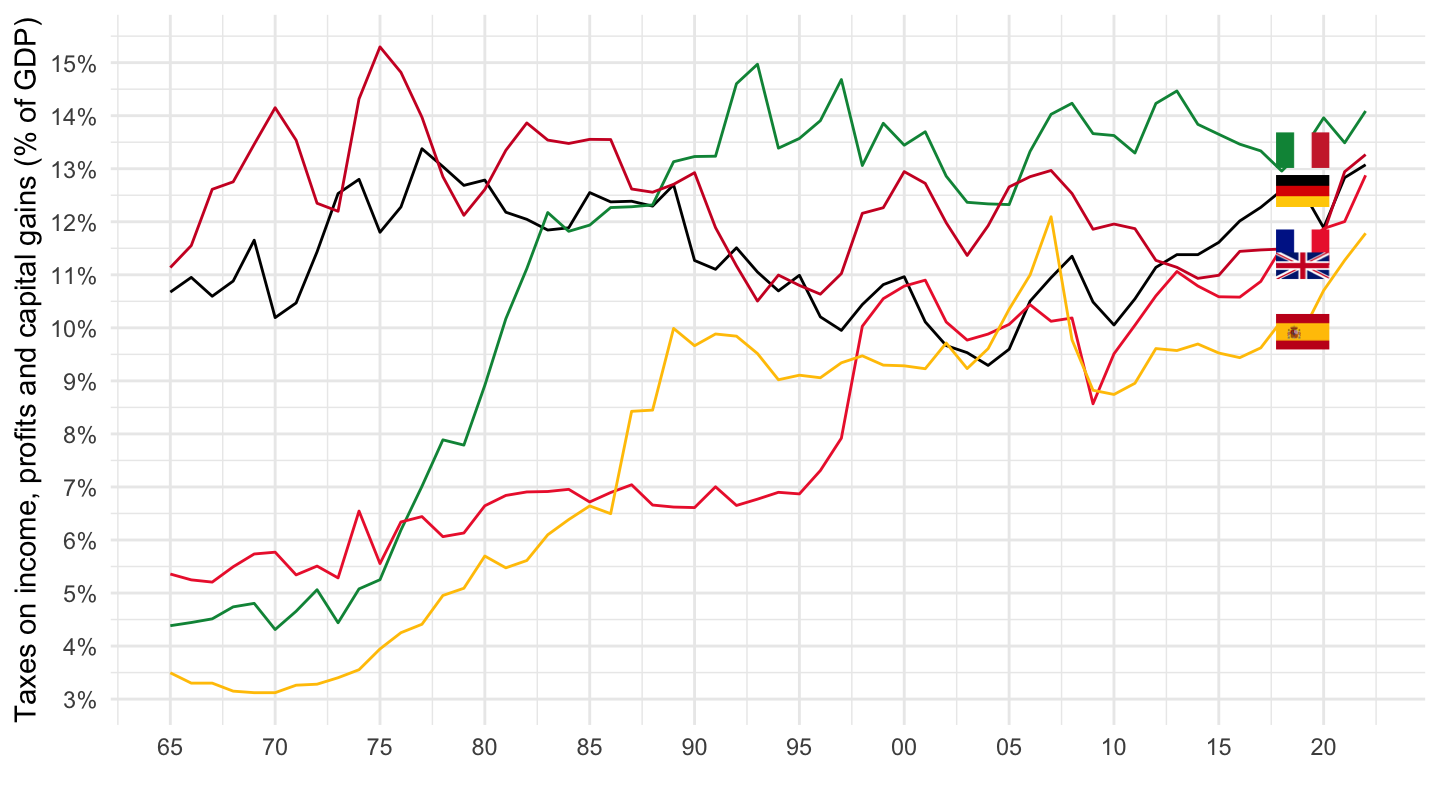
REV %>%
  filter(COU %in% c("DEU", "FRA", "ITA", "ESP", "GBR"),
         TAX == "1100",
         VAR == "TAXGDP",
         GOV == "NES") %>%
  left_join(REV_var$COU, by = "COU") %>%
  year_to_date %>%
  mutate(obsValue = obsValue / 100) %>%
  left_join(colors, by = c("Cou" = "country")) %>%
  ggplot + geom_line(aes(x = date, y = obsValue, color = color)) +
  geom_image(data = . %>%
               filter(date == as.Date("1965-01-01")) %>%
               mutate(image = paste0("../../icon/flag/", str_to_lower(gsub(" ", "-", Cou)), ".png")),
             aes(x = date, y = obsValue, image = image), asp = 1.5) +
  ylab("Taxes on income, profits and capital gains (% of GDP)") + xlab("") + theme_minimal() + scale_color_identity() +
  scale_x_date(breaks = seq(1920, 2025, 5) %>% paste0("-01-01") %>% as.Date,
               labels = date_format("%y")) +
  scale_y_continuous(breaks = 0.01*seq(0, 60, 1),
                     labels = scales::percent_format(accuracy = 1))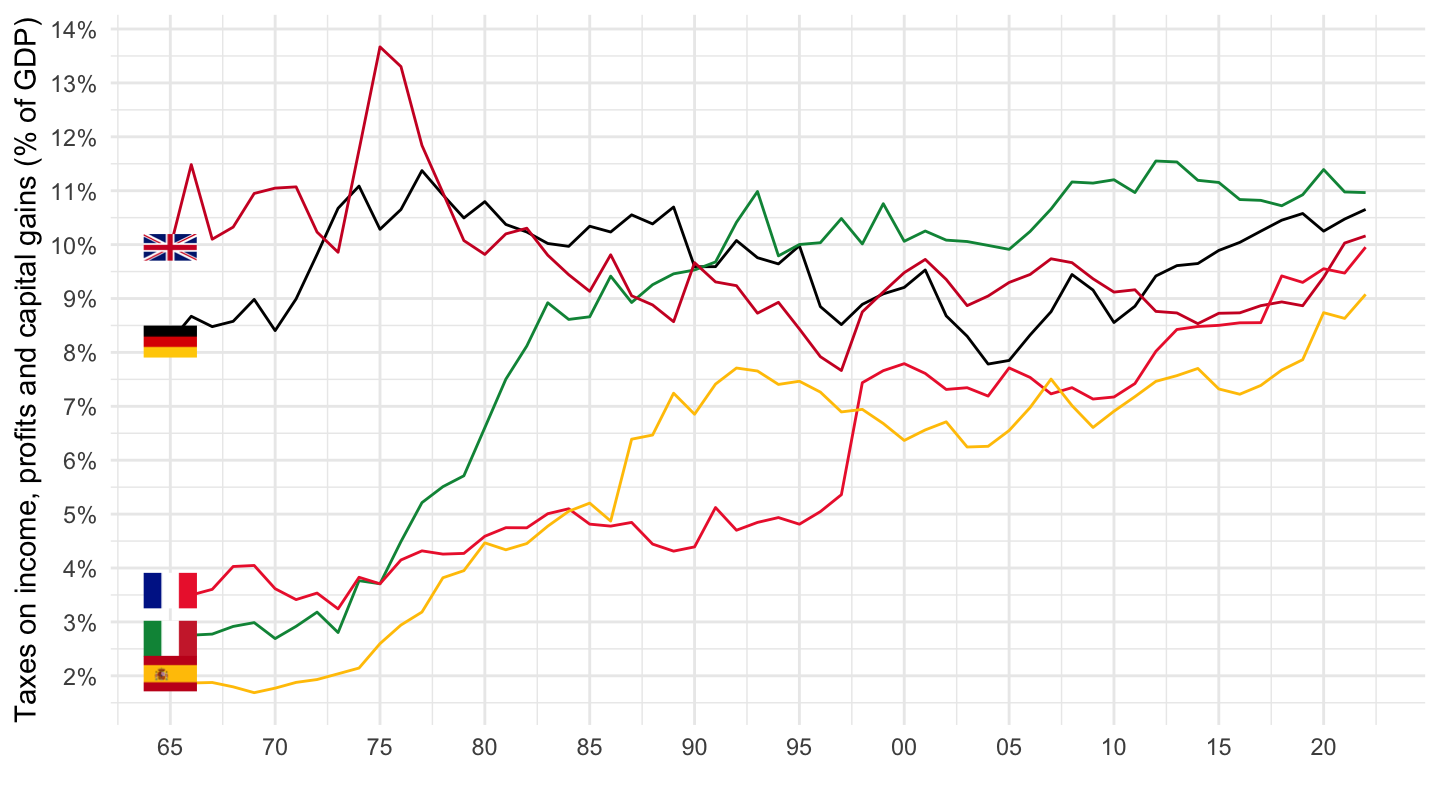
REV %>%
  filter(COU %in% c("DEU", "FRA", "ITA", "ESP", "GBR"),
         TAX == "1200",
         VAR == "TAXGDP",
         GOV == "NES") %>%
  left_join(REV_var$COU, by = "COU") %>%
  year_to_date %>%
  mutate(obsValue = obsValue / 100) %>%
  left_join(colors, by = c("Cou" = "country")) %>%
  ggplot + geom_line(aes(x = date, y = obsValue, color = color)) +
  geom_image(data = . %>%
               filter(date == as.Date("1985-01-01")) %>%
               mutate(image = paste0("../../icon/flag/", str_to_lower(gsub(" ", "-", Cou)), ".png")),
             aes(x = date, y = obsValue, image = image), asp = 1.5) +
  ylab("Taxes on income, profits and capital gains (% of GDP)") + xlab("") + theme_minimal() + scale_color_identity() +
  scale_x_date(breaks = seq(1920, 2025, 5) %>% paste0("-01-01") %>% as.Date,
               labels = date_format("%y")) +
  scale_y_continuous(breaks = 0.01*seq(0, 60, 1),
                     labels = scales::percent_format(accuracy = 1))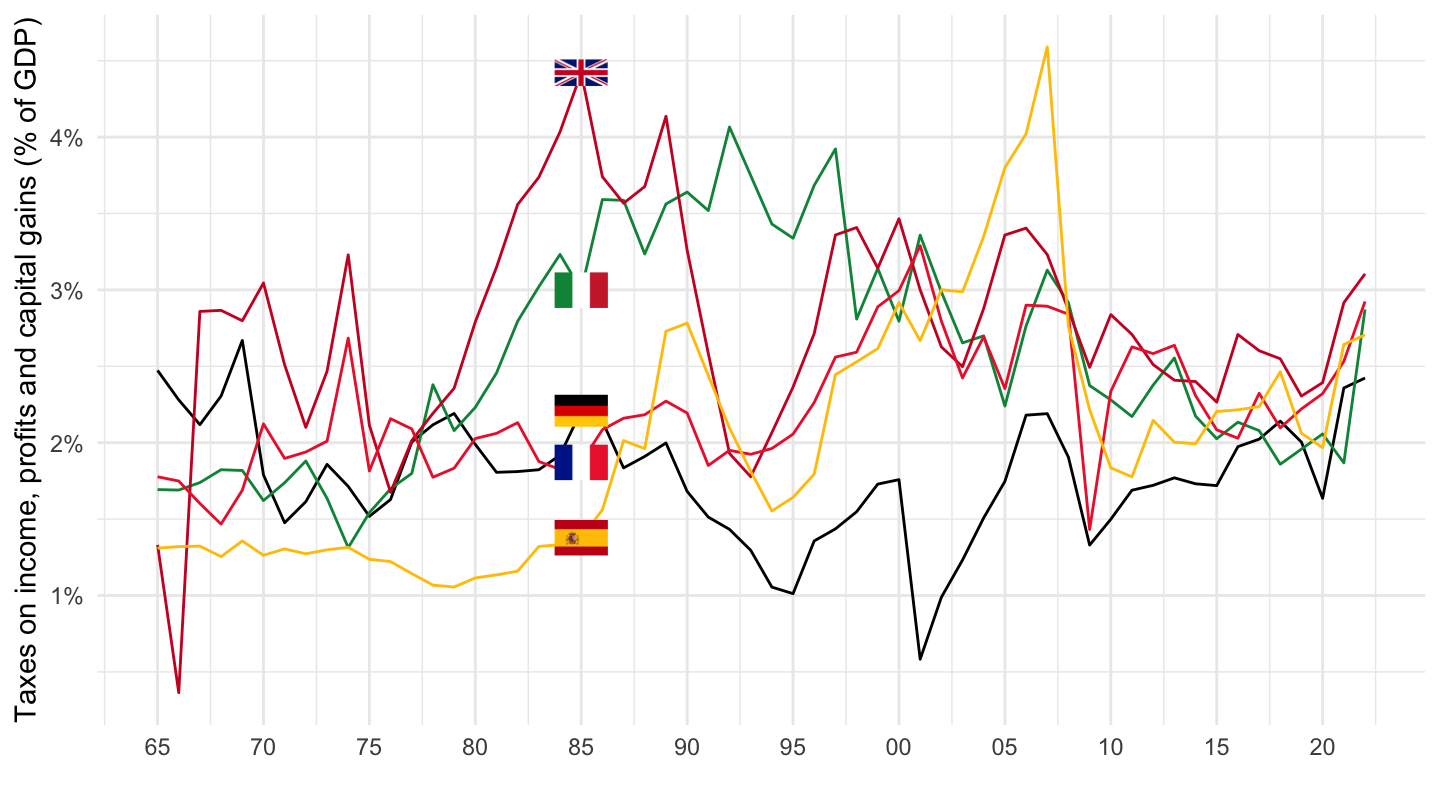
REV %>%
  filter(COU %in% c("DEU", "FRA", "ITA", "ESP", "GBR"),
         TAX == "4000",
         VAR == "TAXGDP",
         GOV == "NES") %>%
  left_join(REV_var$COU, by = "COU") %>%
  year_to_date %>%
  mutate(obsValue = obsValue / 100) %>%
  left_join(colors, by = c("Cou" = "country")) %>%
  ggplot + geom_line(aes(x = date, y = obsValue, color = color)) +
  geom_image(data = . %>%
               filter(date == as.Date("1985-01-01")) %>%
               mutate(image = paste0("../../icon/flag/", str_to_lower(gsub(" ", "-", Cou)), ".png")),
             aes(x = date, y = obsValue, image = image), asp = 1.5) +
  ylab("Taxes on property (% of GDP)") + xlab("") + theme_minimal() + scale_color_identity() +
  scale_x_date(breaks = seq(1920, 2025, 5) %>% paste0("-01-01") %>% as.Date,
               labels = date_format("%y")) +
  scale_y_continuous(breaks = 0.01*seq(0, 60, 1),
                     labels = scales::percent_format(accuracy = 1))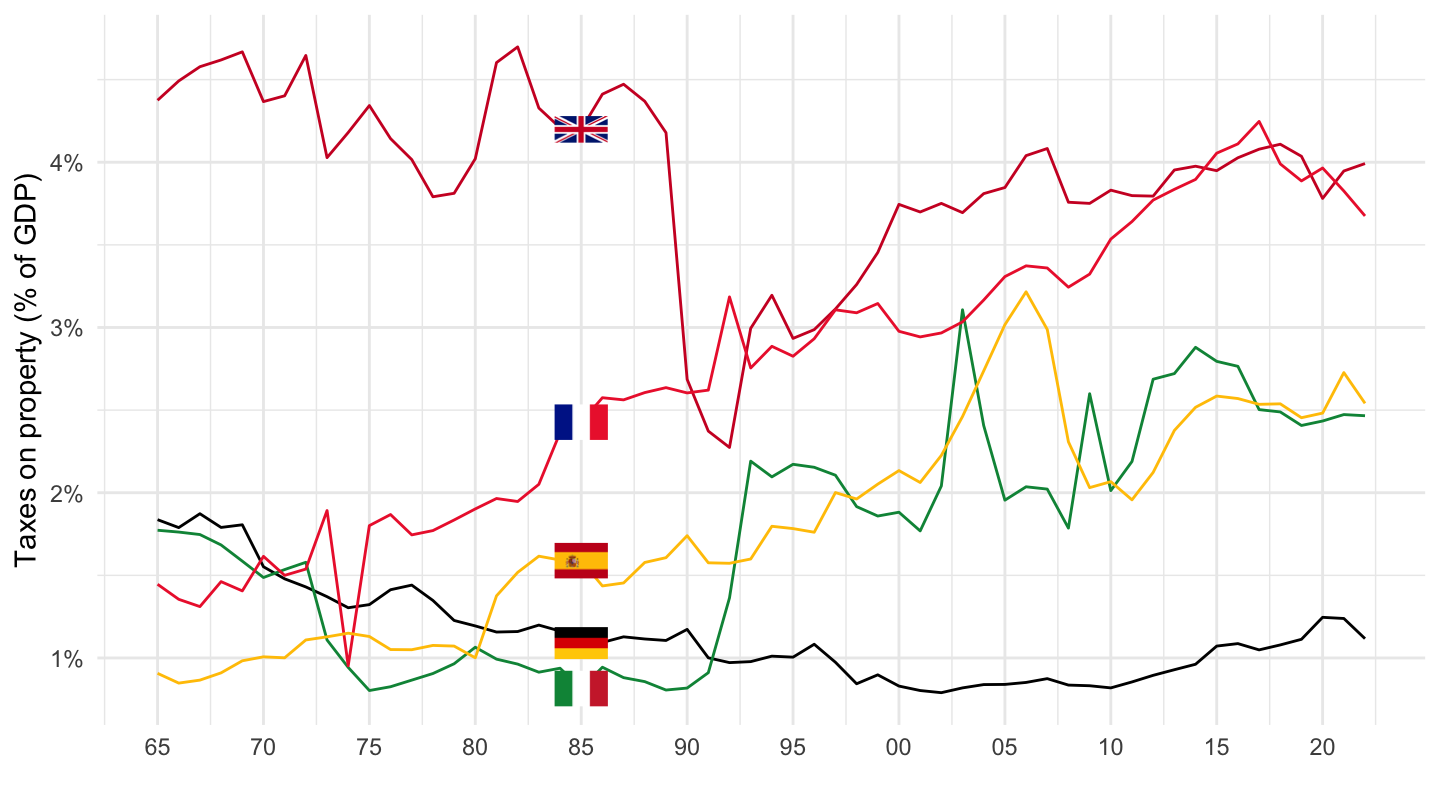
REV %>%
  filter(COU %in% c("DEU", "FRA", "ITA", "ESP", "GBR", "GRC"),
         TAX == "5000",
         VAR == "TAXGDP",
         GOV == "NES") %>%
  left_join(REV_var$COU, by = "COU") %>%
  year_to_date %>%
  mutate(obsValue = obsValue / 100) %>%
  left_join(colors, by = c("Cou" = "country")) %>%
  rename(Location = Cou) %>%
  ggplot + geom_line(aes(x = date, y = obsValue, color = color)) +
  ylab("Taxes on goods and services (% of GDP)") + xlab("") +
  theme_minimal() + scale_color_identity() + add_6flags +
  scale_x_date(breaks = seq(1920, 2025, 5) %>% paste0("-01-01") %>% as.Date,
               labels = date_format("%y")) +
  scale_y_continuous(breaks = 0.01*seq(0, 60, 1),
                     labels = scales::percent_format(accuracy = 1))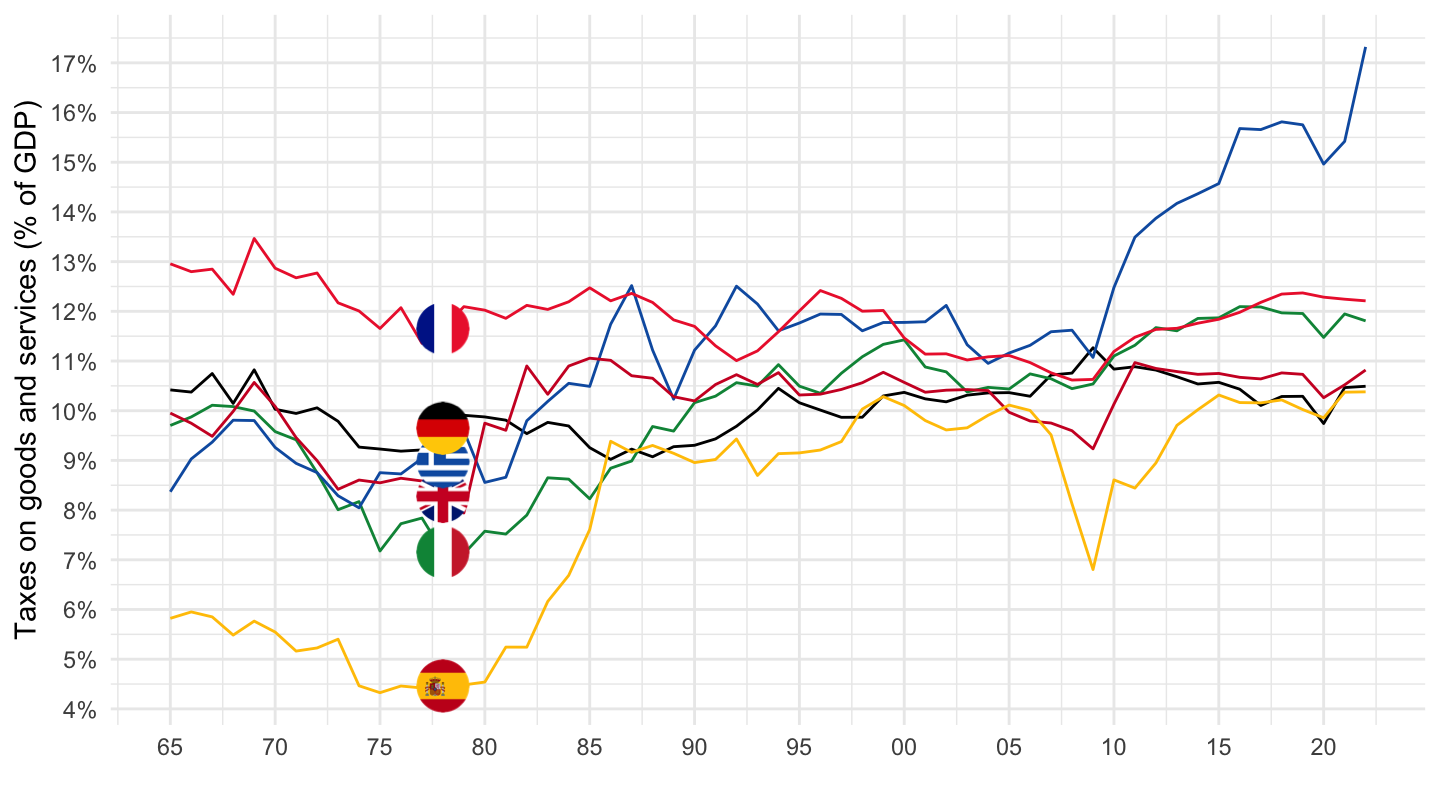
REV %>%
  filter(COU %in% c("DEU", "FRA", "ITA", "ESP", "GBR", "GRC"),
         TAX == "5110",
         VAR == "TAXGDP",
         GOV == "NES") %>%
  left_join(REV_var$COU, by = "COU") %>%
  year_to_date %>%
  mutate(obsValue = obsValue / 100) %>%
  left_join(colors, by = c("Cou" = "country")) %>%
  rename(Location = Cou) %>%
  ggplot + geom_line(aes(x = date, y = obsValue, color = color)) +
  ylab("General taxes (% of GDP)") + xlab("") +
  theme_minimal() + scale_color_identity() + add_6flags +
  scale_x_date(breaks = seq(1920, 2025, 5) %>% paste0("-01-01") %>% as.Date,
               labels = date_format("%y")) +
  scale_y_continuous(breaks = 0.01*seq(0, 60, 1),
                     labels = scales::percent_format(accuracy = 1))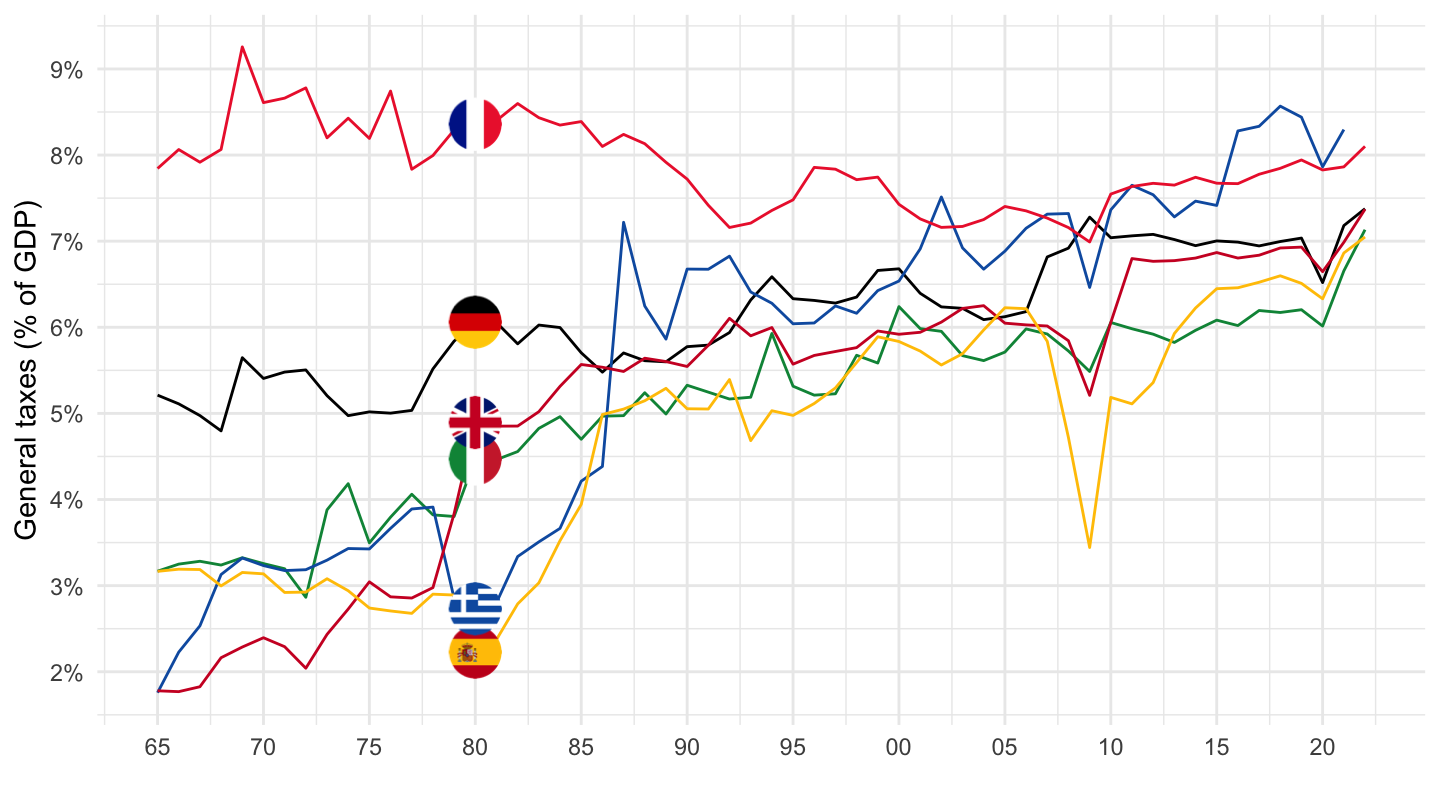
REV %>%
  filter(COU %in% c("DEU", "FRA", "ITA", "ESP", "GBR", "GRC"),
         TAX == "5111",
         VAR == "TAXGDP",
         GOV == "NES") %>%
  left_join(REV_var$COU, by = "COU") %>%
  year_to_date %>%
  mutate(obsValue = obsValue / 100) %>%
  filter(date >= as.Date("1990-01-01")) %>%
  left_join(colors, by = c("Cou" = "country")) %>%
  rename(Location = Cou) %>%
  ggplot + geom_line(aes(x = date, y = obsValue, color = color)) +
  ylab("Value added taxes (% of GDP)") + xlab("") +
  theme_minimal() + scale_color_identity() + add_6flags +
  scale_x_date(breaks = seq(1920, 2025, 5) %>% paste0("-01-01") %>% as.Date,
               labels = date_format("%y")) +
  scale_y_continuous(breaks = 0.01*seq(0, 60, 1),
                     labels = scales::percent_format(accuracy = 1))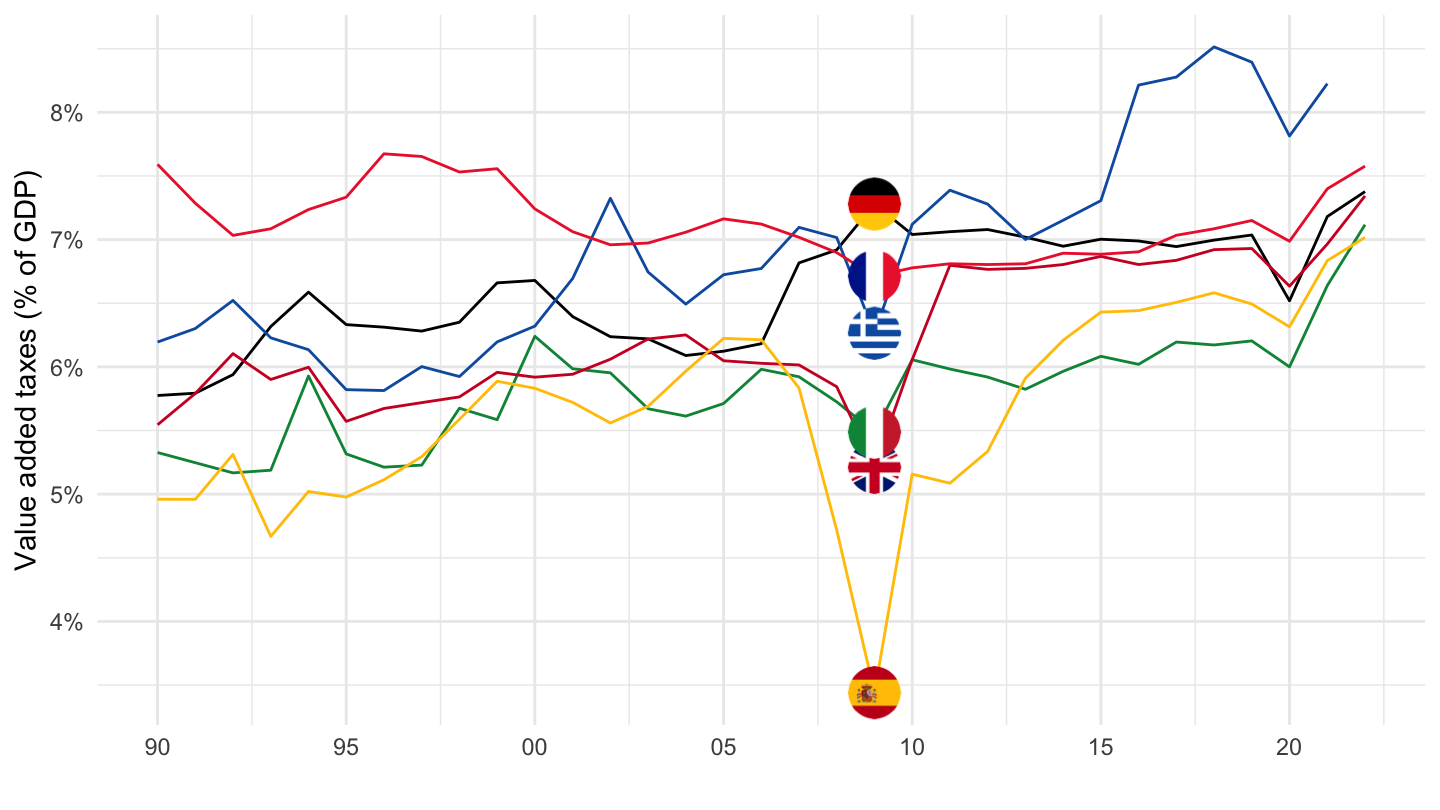
REV %>%
  filter(COU %in% c("DEU", "FRA", "ITA", "ESP", "GBR", "GRC"),
         TAX == "5120",
         VAR == "TAXGDP",
         GOV == "NES") %>%
  left_join(REV_var$COU, by = "COU") %>%
  year_to_date %>%
  mutate(obsValue = obsValue / 100) %>%
  left_join(colors, by = c("Cou" = "country")) %>%
  ggplot + geom_line(aes(x = date, y = obsValue, color = color)) +
  geom_image(data = . %>%
               filter(date == as.Date("1977-01-01")) %>%
               mutate(image = paste0("../../icon/flag/", str_to_lower(gsub(" ", "-", Cou)), ".png")),
             aes(x = date, y = obsValue, image = image), asp = 1.5) +
  ylab("Taxes on specific goods and services (% of GDP)") + xlab("") + theme_minimal() + scale_color_identity() +
  scale_x_date(breaks = seq(1920, 2025, 5) %>% paste0("-01-01") %>% as.Date,
               labels = date_format("%y")) +
  scale_y_continuous(breaks = 0.01*seq(0, 60, 1),
                     labels = scales::percent_format(accuracy = 1))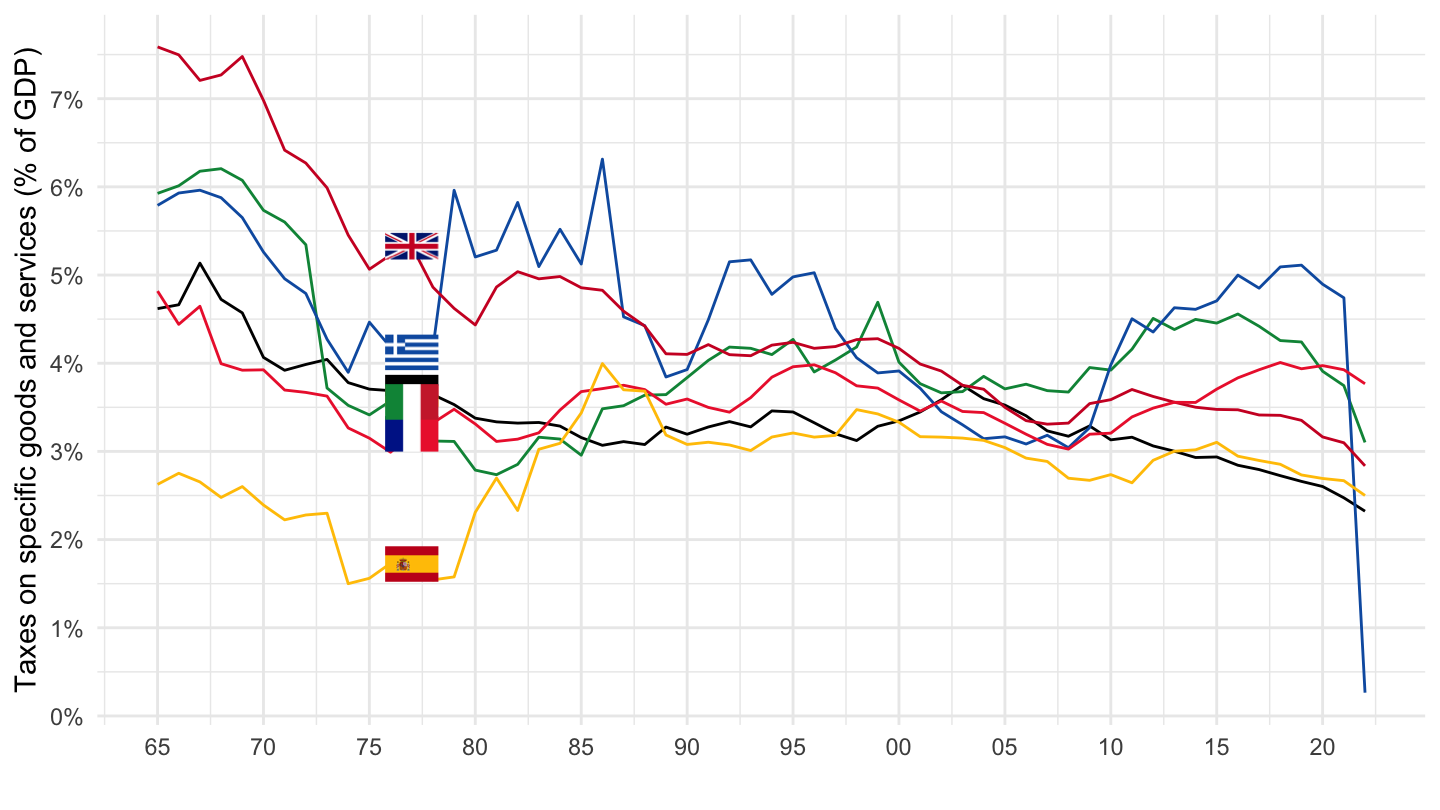
REV %>%
  filter(COU %in% c("JPN", "CAN", "USA", "IRL", "PRT"),
         obsTime == "2018",
         VAR == "TAXGDP",
         GOV == "NES") %>%
  left_join(REV_var$TAX, by = "TAX") %>%
  left_join(REV_var$COU, by = "COU") %>%
  mutate(obsValue = round(obsValue, 2)) %>%
  select(TAX, Tax, Cou, obsValue) %>%
  mutate(Cou = gsub(" ", "-", str_to_lower(gsub(" ", "-", Cou))),
         Cou = paste0('<img src="../../icon/flag/vsmall/', Cou, '.png" alt="Flag">')) %>%
  spread(Cou, obsValue) %>%
{if (is_html_output()) datatable(., filter = 'top', rownames = F, escape = F) else .}REV %>%
filter(COU %in% c("JPN", "CAN", "USA", "IRL", "PRT"),
obsTime == "2018",
TAX %in% c("TOTALTAX", "1000", "1100", "1200", "2000", "2100",
"2200", "3000", "4000", "5000", "6000"),
VAR == "TAXGDP",
GOV == "NES") %>%
left_join(REV_var$TAX, by = "TAX") %>%
left_join(REV_var$COU, by = "COU") %>%
mutate(obsValue = round(obsValue, 2)) %>%
select(TAX, Tax, Cou, obsValue) %>%
mutate(Cou = gsub(" ", "-", str_to_lower(gsub(" ", "-", Cou))),
Cou = paste0('<img src="../../icon/flag/vsmall/', Cou, '.png" alt="Flag">')) %>%
spread(Cou, obsValue) %>%
{if (is_html_output()) datatable(., filter = 'top', rownames = F, escape = F, options = list(pageLength = 20)) else .}REV %>%
filter(COU %in% c("JPN", "CAN", "USA", "IRL", "PRT"),
TAX == "TOTALTAX",
VAR == "TAXGDP",
GOV == "NES") %>%
left_join(REV_var$COU, by = "COU") %>%
year_to_date %>%
mutate(obsValue = obsValue / 100) %>%
left_join(colors, by = c("Cou" = "country")) %>%
ggplot + geom_line(aes(x = date, y = obsValue, color = color)) +
geom_image(data = . %>%
filter(date == as.Date("2018-01-01")) %>%
mutate(image = paste0("../../icon/flag/", str_to_lower(gsub(" ", "-", Cou)), ".png")),
aes(x = date, y = obsValue, image = image), asp = 1.5) +
ylab("Total tax revenue (% of GDP)") + xlab("") + theme_minimal() + scale_color_identity() +
scale_x_date(breaks = seq(1920, 2025, 5) %>% paste0("-01-01") %>% as.Date,
labels = date_format("%y")) +
scale_y_continuous(breaks = 0.01*seq(0, 60, 5),
labels = scales::percent_format(accuracy = 1))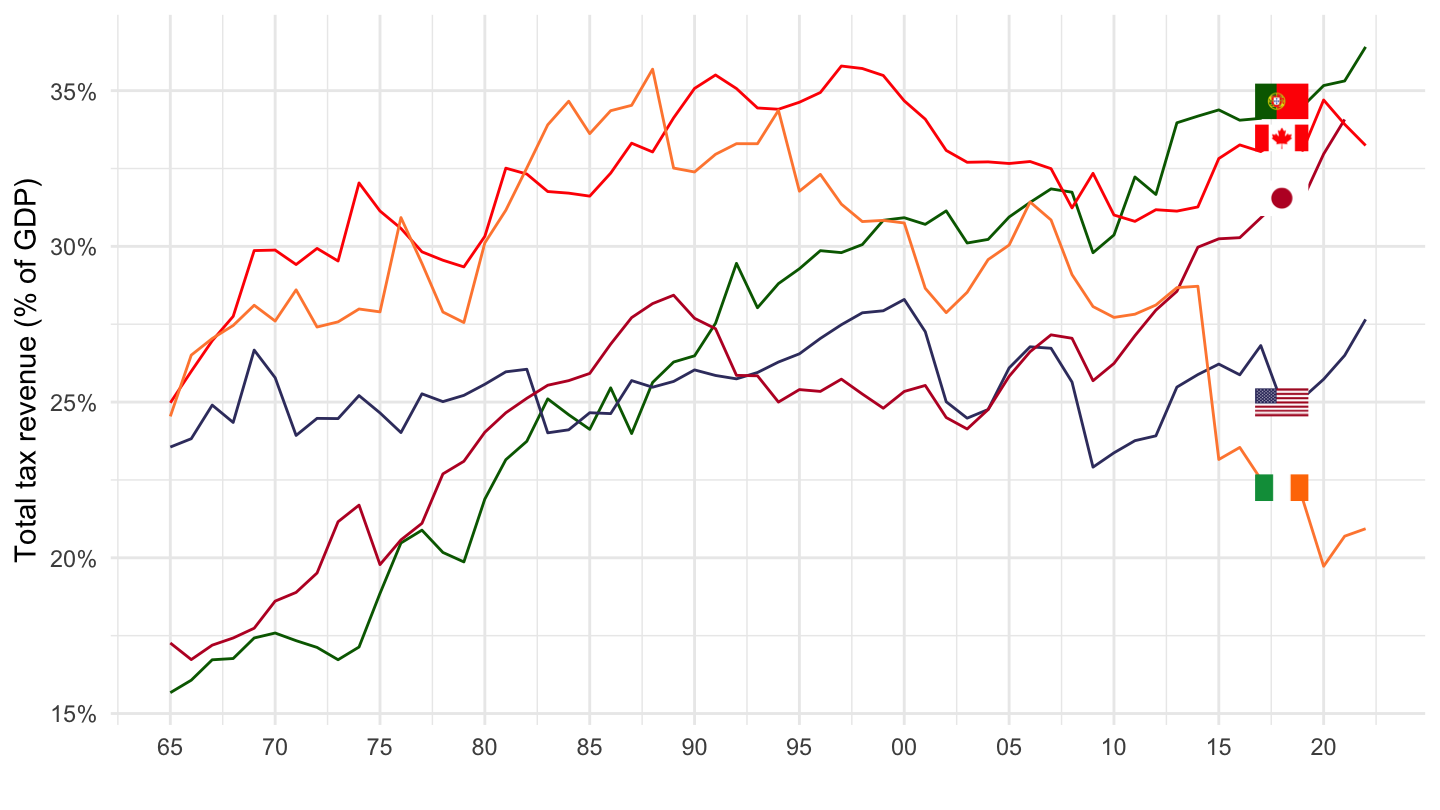
(ref:DEU-5111-95-04) Value Added Taxes in Germany (1995-2004)
REV %>%
  filter(COU == "DEU",
         GOV == "NES",
         TAX == "5111",
         VAR == "TAXNAT") %>%
  year_to_date %>%
  filter(date >= as.Date("1995-01-01"),
         date <= as.Date("2004-01-01")) %>%
  ggplot(.) +
  geom_line(aes(x = date, y = obsValue)) + theme_minimal() +
  theme(legend.title = element_blank(),
        legend.position = c(0.1, 0.25)) +
  scale_x_date(breaks = as.Date(paste0(seq(1920, 2020, 1), "-01-01")),
               labels = date_format("%y")) +
  scale_y_continuous(breaks = seq(-0.10, 0.03, 0.01),
                     labels = scales::percent_format(accuracy = 1)) +
  xlab("") + ylab("Value Added Taxes in Germany") +
  scale_y_continuous(breaks = seq(0, 1000, 10),
                     labels = dollar_format(suffix = " Bn", prefix = "", accuracy = 1)) +
  geom_rect(data = data_frame(start = as.Date("1998-01-01"),
                              end = as.Date("1999-01-01")),
            aes(xmin = start, xmax = end, ymin = -Inf, ymax = +Inf),
            fill = viridis(3)[2], alpha = 0.2) +
  geom_vline(xintercept = as.Date("1998-01-01"), linetype = "dashed", color = viridis(3)[2]) +
  geom_vline(xintercept = as.Date("1999-01-01"), linetype = "dashed", color = viridis(3)[2])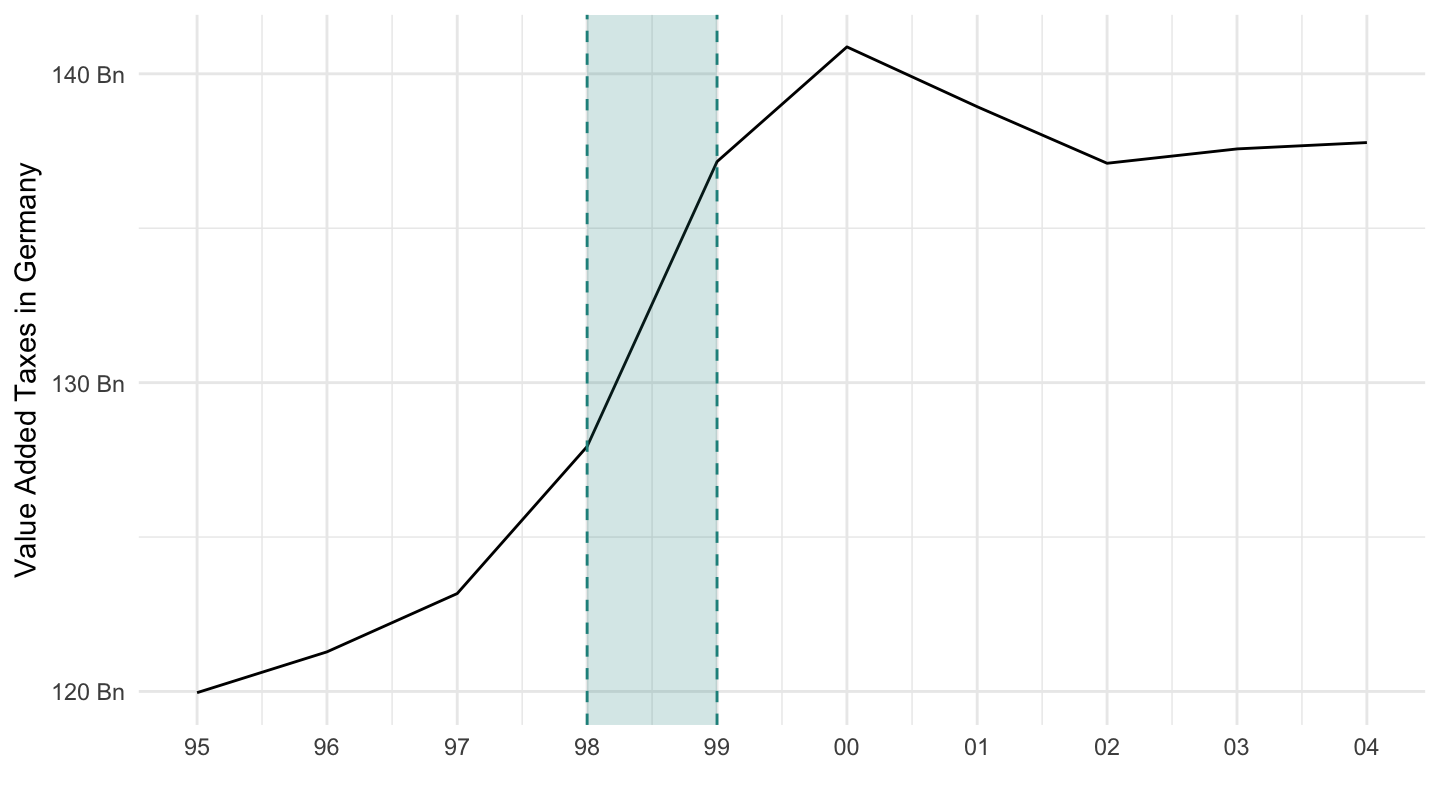
REV %>%
  filter(COU == "DEU",
         GOV == "NES",
         TAX == "5120",
         VAR == "TAXNAT") %>%
  year_to_date %>%
  filter(date >= as.Date("1995-01-01"),
         date <= as.Date("2004-01-01")) %>%
  ggplot(.) +
  geom_line(aes(x = date, y = obsValue)) + theme_minimal() +
  theme(legend.title = element_blank(),
        legend.position = c(0.1, 0.25)) +
  scale_x_date(breaks = as.Date(paste0(seq(1920, 2020, 1), "-01-01")),
               labels = date_format("%y")) +
  scale_y_continuous(breaks = seq(-0.10, 0.03, 0.01),
                     labels = scales::percent_format(accuracy = 1)) +
  xlab("") + ylab("Fuel Taxes in Germany") +
  scale_y_continuous(breaks = seq(0, 1000, 5),
                     labels = dollar_format(suffix = " Bn", prefix = "", accuracy = 1)) +
  geom_rect(data = data_frame(start = as.Date("1998-01-01"),
                              end = as.Date("2003-01-01")),
            aes(xmin = start, xmax = end, ymin = -Inf, ymax = +Inf),
            fill = viridis(3)[2], alpha = 0.2) +
  geom_vline(xintercept = as.Date("1998-01-01"), linetype = "dashed", color = viridis(3)[2]) +
  geom_vline(xintercept = as.Date("2003-01-01"), linetype = "dashed", color = viridis(3)[2]) +
  geom_vline(xintercept = as.Date("2001-01-01"), linetype = "dashed", color = viridis(3)[1])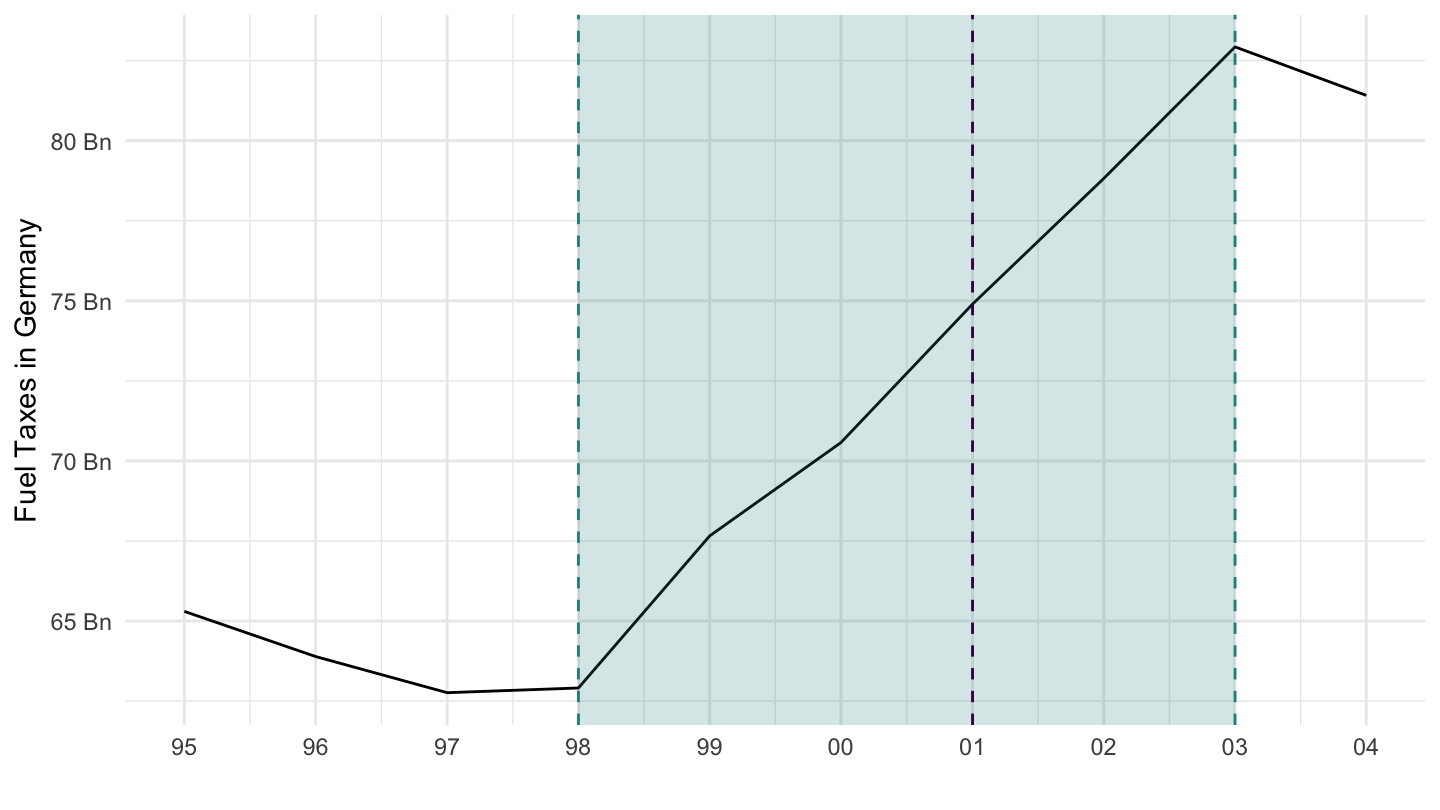
(ref:DEU-TOTALTAX-95-04) Total Taxes in Germany (1995-2004)
REV %>%
  filter(COU == "DEU",
         GOV == "NES",
         TAX == "TOTALTAX",
         VAR == "TAXNAT") %>%
  year_to_date %>%
  filter(date >= as.Date("1995-01-01"),
         date <= as.Date("2004-01-01")) %>%
  ggplot(.) +
  geom_line(aes(x = date, y = obsValue)) + theme_minimal() +
  theme(legend.title = element_blank(),
        legend.position = c(0.1, 0.25)) +
  scale_x_date(breaks = as.Date(paste0(seq(1920, 2020, 1), "-01-01")),
               labels = date_format("%y")) +
  scale_y_continuous(breaks = seq(-0.10, 0.03, 0.01),
                     labels = scales::percent_format(accuracy = 1)) +
  xlab("") + ylab("All Taxes in Germany") +
  scale_y_continuous(breaks = seq(0, 1000, 10),
                     labels = dollar_format(suffix = " Bn", prefix = "", accuracy = 1)) +
  geom_rect(data = data_frame(start = as.Date("1998-01-01"),
                              end = as.Date("2003-01-01")),
            aes(xmin = start, xmax = end, ymin = -Inf, ymax = +Inf),
            fill = viridis(3)[2], alpha = 0.2) +
  geom_vline(xintercept = as.Date("1998-01-01"), linetype = "dashed", color = viridis(3)[2]) +
  geom_vline(xintercept = as.Date("2003-01-01"), linetype = "dashed", color = viridis(3)[2]) +
  geom_vline(xintercept = as.Date("2001-01-01"), linetype = "dashed", color = viridis(3)[1])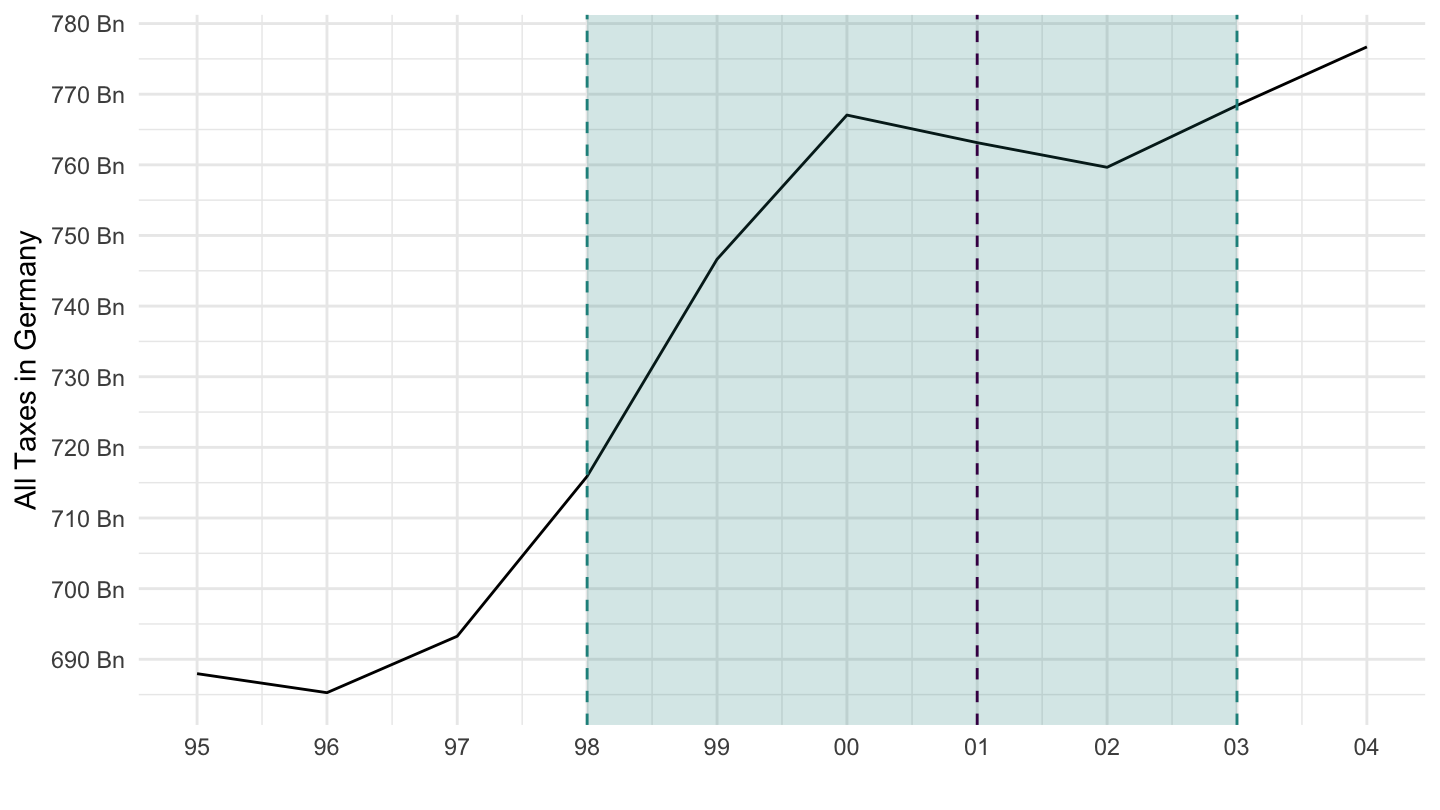
REV %>%
  filter(COU == "DEU",
         GOV == "NES",
         TAX == "5111",
         VAR == "TAXNAT") %>%
  year_to_date %>%
  filter(date >= as.Date("1995-01-01"),
         date <= as.Date("2010-01-01")) %>%
  ggplot(.) +
  geom_line(aes(x = date, y = obsValue)) + theme_minimal() +
  theme(legend.title = element_blank(),
        legend.position = c(0.1, 0.25)) +
  scale_x_date(breaks = as.Date(paste0(seq(1920, 2020, 1), "-01-01")),
               labels = date_format("%y")) +
  scale_y_continuous(breaks = seq(-0.10, 0.03, 0.01),
                     labels = scales::percent_format(accuracy = 1)) +
  xlab("") + ylab("Value Added Taxes in Germany") +
  scale_y_continuous(breaks = seq(0, 1000, 10),
                     labels = dollar_format(suffix = " Bn€", prefix = "", accuracy = 1)) +
  geom_rect(data = data_frame(start = as.Date("1998-01-01"),
                              end = as.Date("1999-01-01")),
            aes(xmin = start, xmax = end, ymin = -Inf, ymax = +Inf),
            fill = viridis(3)[2], alpha = 0.2) +
  geom_vline(xintercept = as.Date("1998-01-01"), linetype = "dashed", color = viridis(3)[2]) +
  geom_vline(xintercept = as.Date("1999-01-01"), linetype = "dashed", color = viridis(3)[2])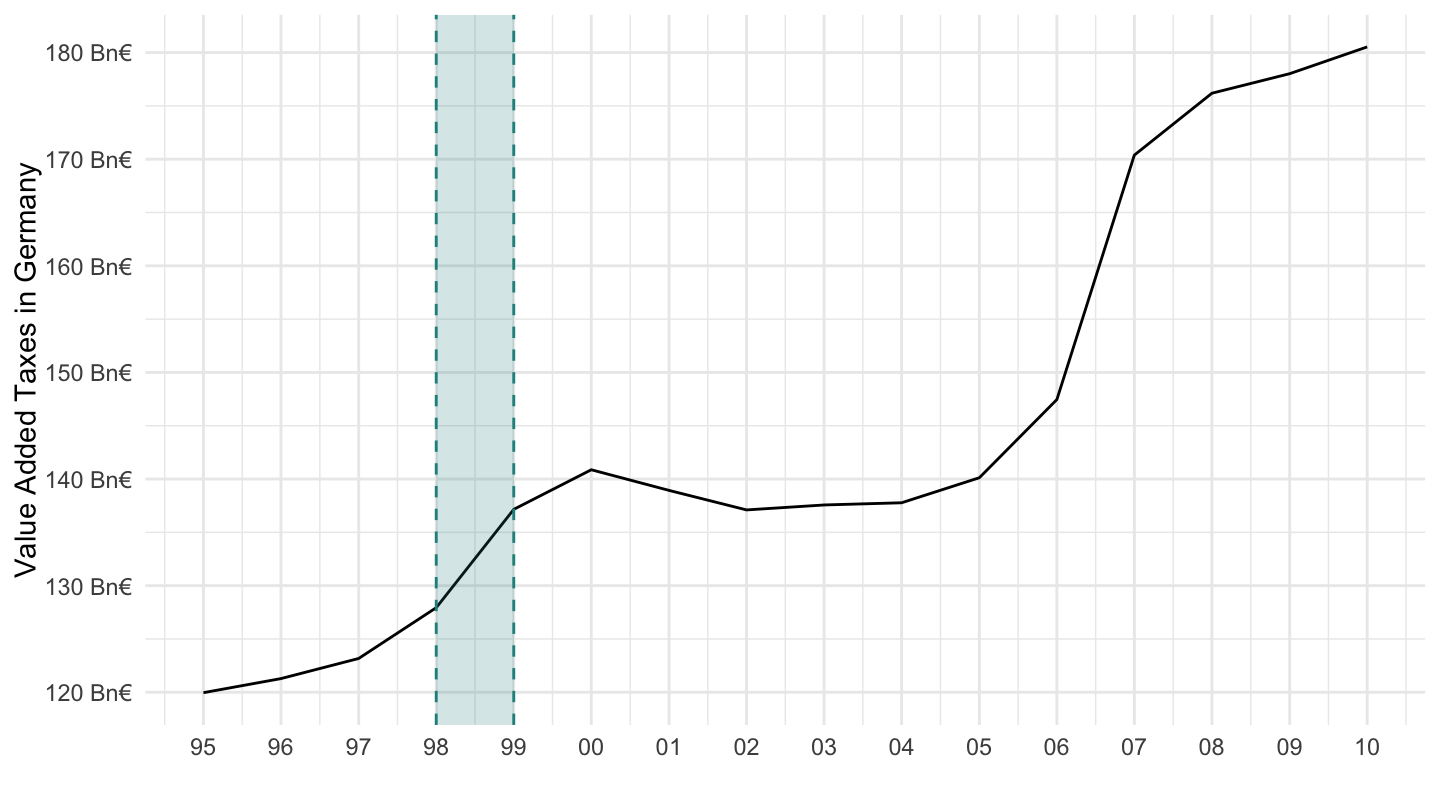
(ref:DEU-5120-95-04) Fuel Taxes in Germany (1995-2004)
REV %>%
  filter(COU == "DEU",
         GOV == "NES",
         TAX == "5120",
         VAR == "TAXNAT") %>%
  year_to_date %>%
  filter(date >= as.Date("1995-01-01")) %>%
  ggplot(.) +
  geom_line(aes(x = date, y = obsValue)) + theme_minimal() +
  theme(legend.title = element_blank(),
        legend.position = c(0.1, 0.25)) +
  scale_x_date(breaks = as.Date(paste0(seq(1920, 2020, 1), "-01-01")),
               labels = date_format("%y")) +
  scale_y_continuous(breaks = seq(-0.10, 0.03, 0.01),
                     labels = scales::percent_format(accuracy = 1)) +
  xlab("") + ylab("Fuel Taxes in Germany") +
  scale_y_continuous(breaks = seq(0, 1000, 5),
                     labels = dollar_format(suffix = " Bn€", prefix = "", accuracy = 1)) +
  geom_rect(data = data_frame(start = as.Date("1998-01-01"),
                              end = as.Date("2003-01-01")),
            aes(xmin = start, xmax = end, ymin = -Inf, ymax = +Inf),
            fill = viridis(3)[2], alpha = 0.2) +
  geom_vline(xintercept = as.Date("1998-01-01"), linetype = "dashed", color = viridis(3)[2]) +
  geom_vline(xintercept = as.Date("2003-01-01"), linetype = "dashed", color = viridis(3)[2]) +
  geom_vline(xintercept = as.Date("2001-01-01"), linetype = "dashed", color = viridis(3)[1])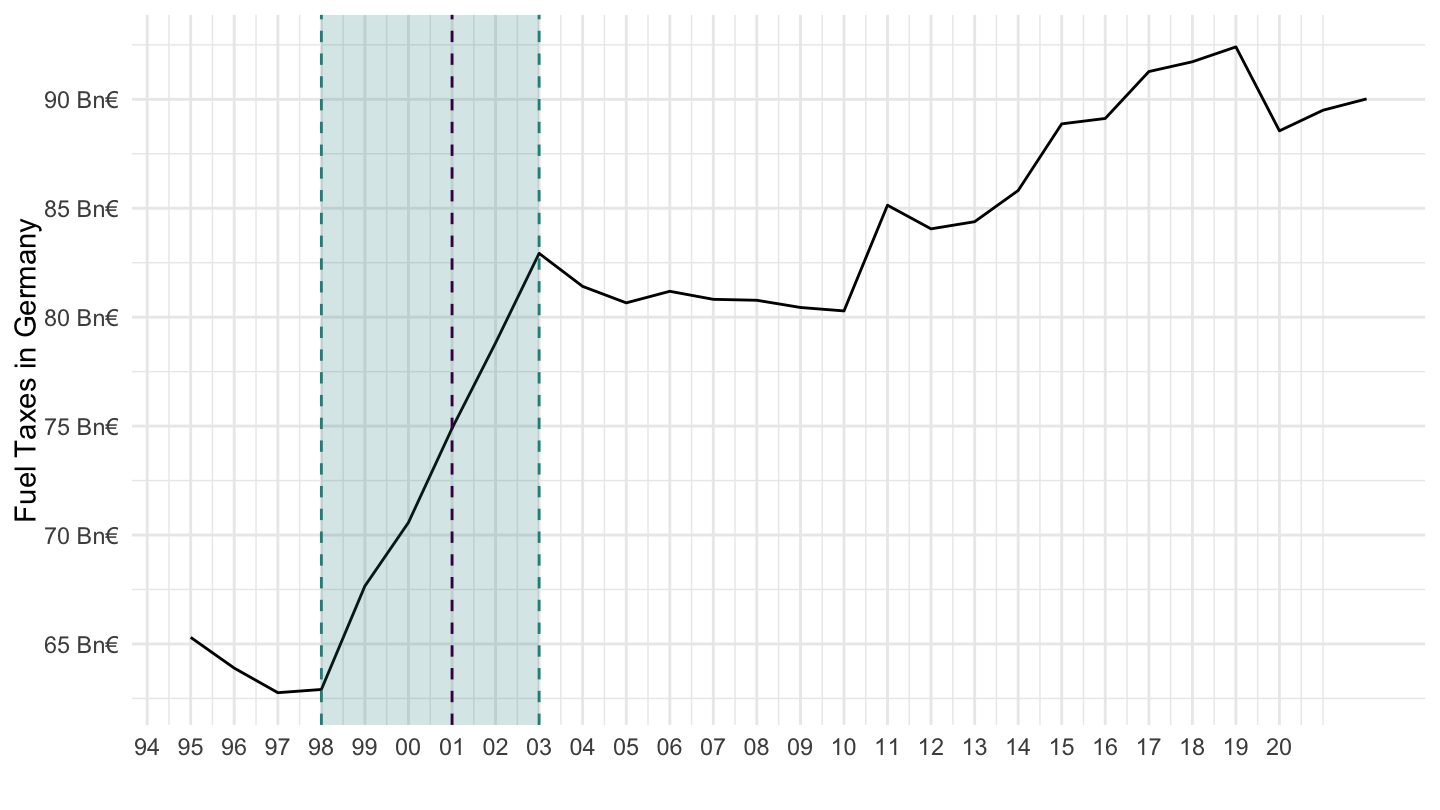
REV %>%
  filter(COU == "DEU",
         GOV == "NES",
         TAX == "TOTALTAX",
         VAR == "TAXGDP") %>%
  year_to_date %>%
  filter(date >= as.Date("1995-01-01")) %>%
  ggplot(.) + xlab("") + ylab("Total Taxes (% of GDP)") +
  geom_line(aes(x = date, y = obsValue/100)) + theme_minimal() +
  theme(legend.title = element_blank(),
        legend.position = c(0.1, 0.25)) +
  scale_x_date(breaks = as.Date(paste0(seq(1920, 2020, 1), "-01-01")),
               labels = date_format("%y")) +
  scale_y_continuous(breaks = seq(0, 0.50, 0.005),
                     labels = scales::percent_format(accuracy = 0.1))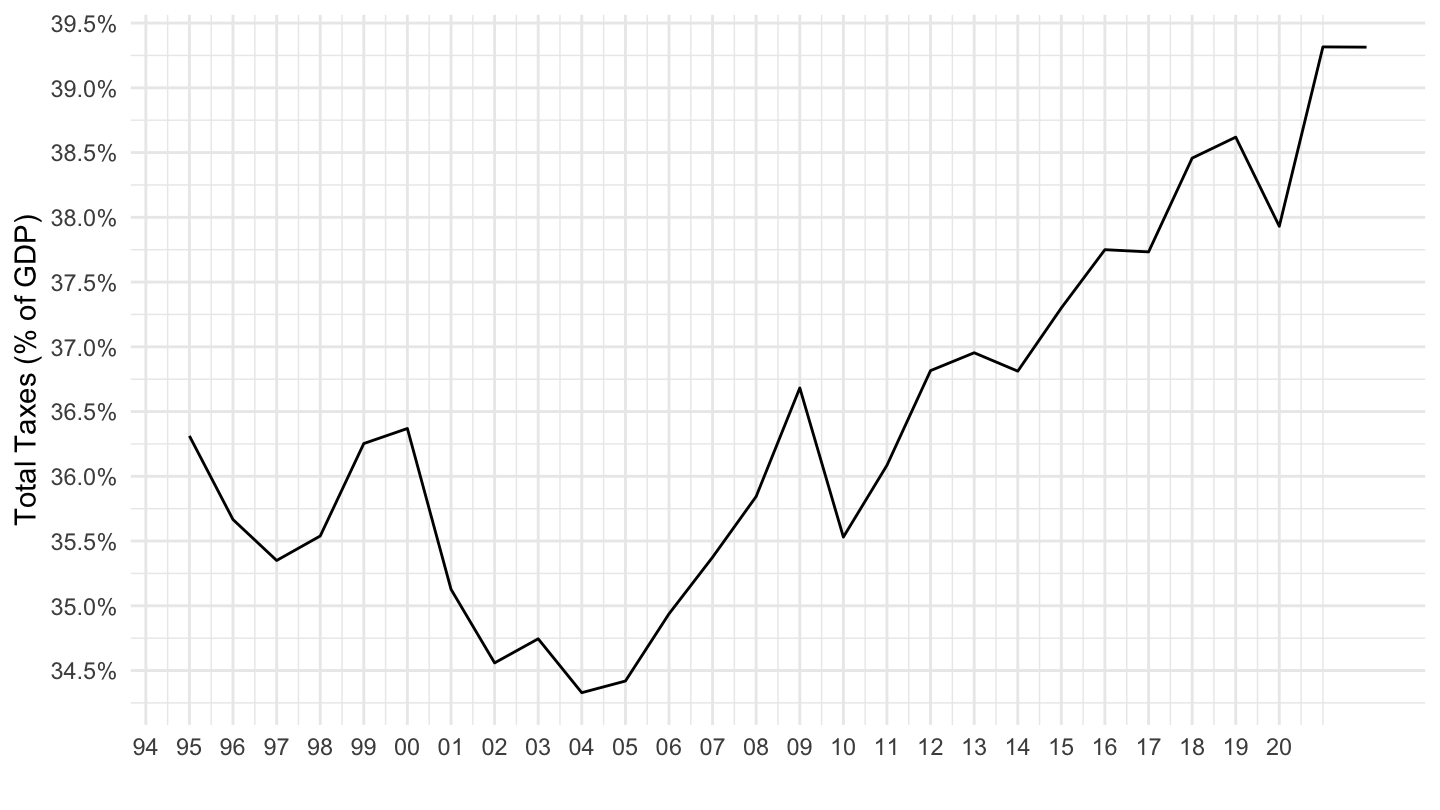
REV %>%
  filter(COU == "DEU",
         GOV == "NES",
         TAX == "TOTALTAX",
         VAR == "TAXNAT") %>%
  year_to_date %>%
  filter(date >= as.Date("1995-01-01")) %>%
  ggplot(.) +
  geom_line(aes(x = date, y = obsValue)) + theme_minimal() +
  theme(legend.title = element_blank(),
        legend.position = c(0.1, 0.25)) +
  scale_x_date(breaks = as.Date(paste0(seq(1920, 2020, 1), "-01-01")),
               labels = date_format("%y")) +
  scale_y_continuous(breaks = seq(-0.10, 0.03, 0.01),
                     labels = scales::percent_format(accuracy = 1)) +
  xlab("") + ylab("Total Taxes in Germany") +
  scale_y_continuous(breaks = seq(0, 2000, 100),
                     labels = dollar_format(suffix = " Bn€", prefix = "", accuracy = 1)) +
  geom_rect(data = data_frame(start = as.Date("1998-01-01"),
                              end = as.Date("1999-01-01")),
            aes(xmin = start, xmax = end, ymin = -Inf, ymax = +Inf),
            fill = viridis(3)[2], alpha = 0.2) +
  geom_vline(xintercept = as.Date("1998-01-01"), linetype = "dashed", color = viridis(3)[2]) +
  geom_vline(xintercept = as.Date("1999-01-01"), linetype = "dashed", color = viridis(3)[2])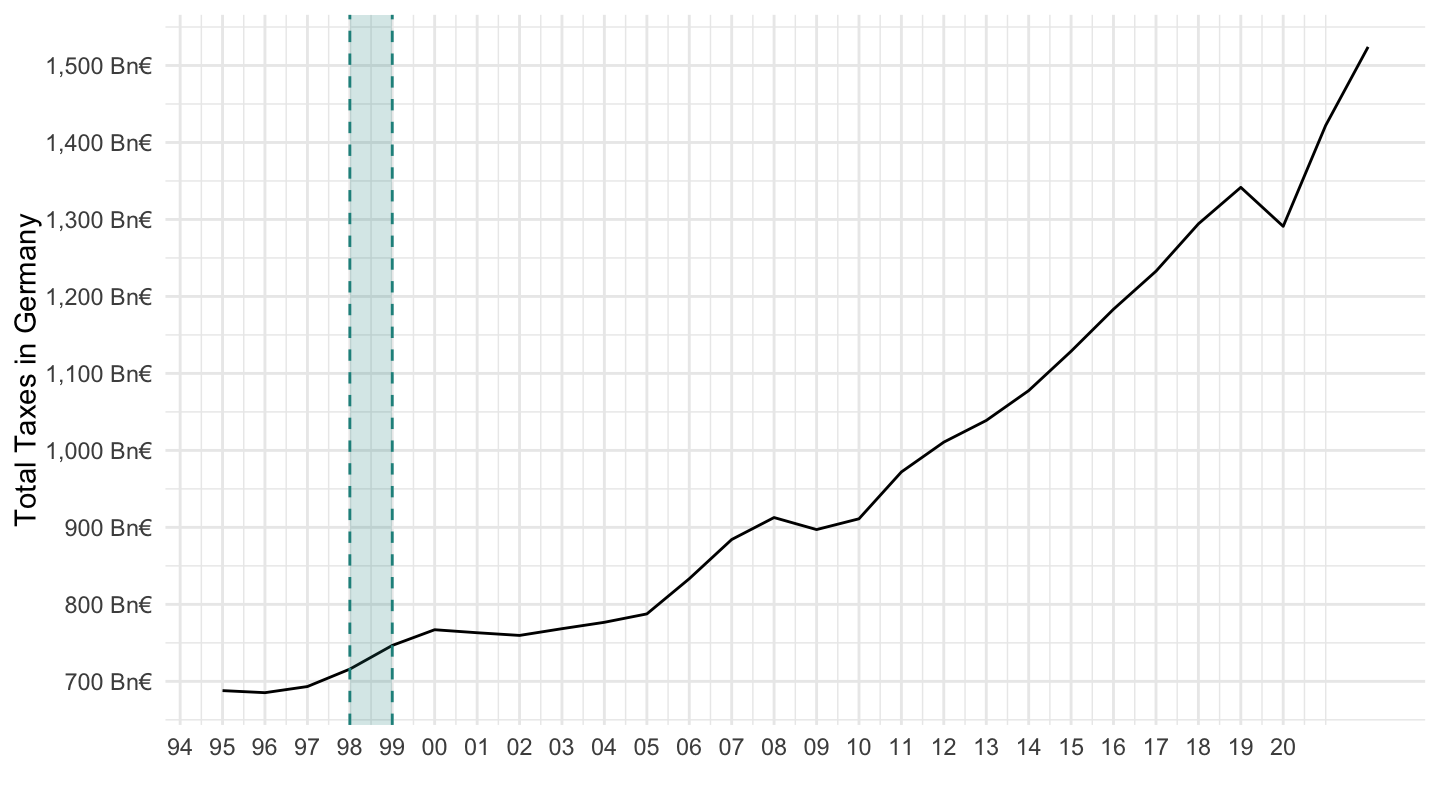
(ref:DEU-TOTALTAX-95-04) Total Taxes in Germany (1995-2004)
REV %>%
  filter(COU == "DEU",
         GOV == "NES",
         TAX == "TOTALTAX",
         VAR == "TAXNAT") %>%
  year_to_date %>%
  filter(date >= as.Date("1995-01-01"),
         date <= as.Date("2010-01-01")) %>%
  ggplot(.) +
  geom_line(aes(x = date, y = obsValue)) + theme_minimal() +
  theme(legend.title = element_blank(),
        legend.position = c(0.1, 0.25)) +
  scale_x_date(breaks = as.Date(paste0(seq(1920, 2020, 1), "-01-01")),
               labels = date_format("%y")) +
  scale_y_continuous(breaks = seq(-0.10, 0.03, 0.01),
                     labels = scales::percent_format(accuracy = 1)) +
  xlab("") + ylab("Total Taxes in Germany") +
  scale_y_continuous(breaks = seq(0, 1000, 10),
                     labels = dollar_format(suffix = " Bn€", prefix = "", accuracy = 1)) +
  geom_rect(data = data_frame(start = as.Date("1998-01-01"),
                              end = as.Date("1999-01-01")),
            aes(xmin = start, xmax = end, ymin = -Inf, ymax = +Inf),
            fill = viridis(3)[2], alpha = 0.2) +
  geom_vline(xintercept = as.Date("1998-01-01"), linetype = "dashed", color = viridis(3)[2]) +
  geom_vline(xintercept = as.Date("1999-01-01"), linetype = "dashed", color = viridis(3)[2])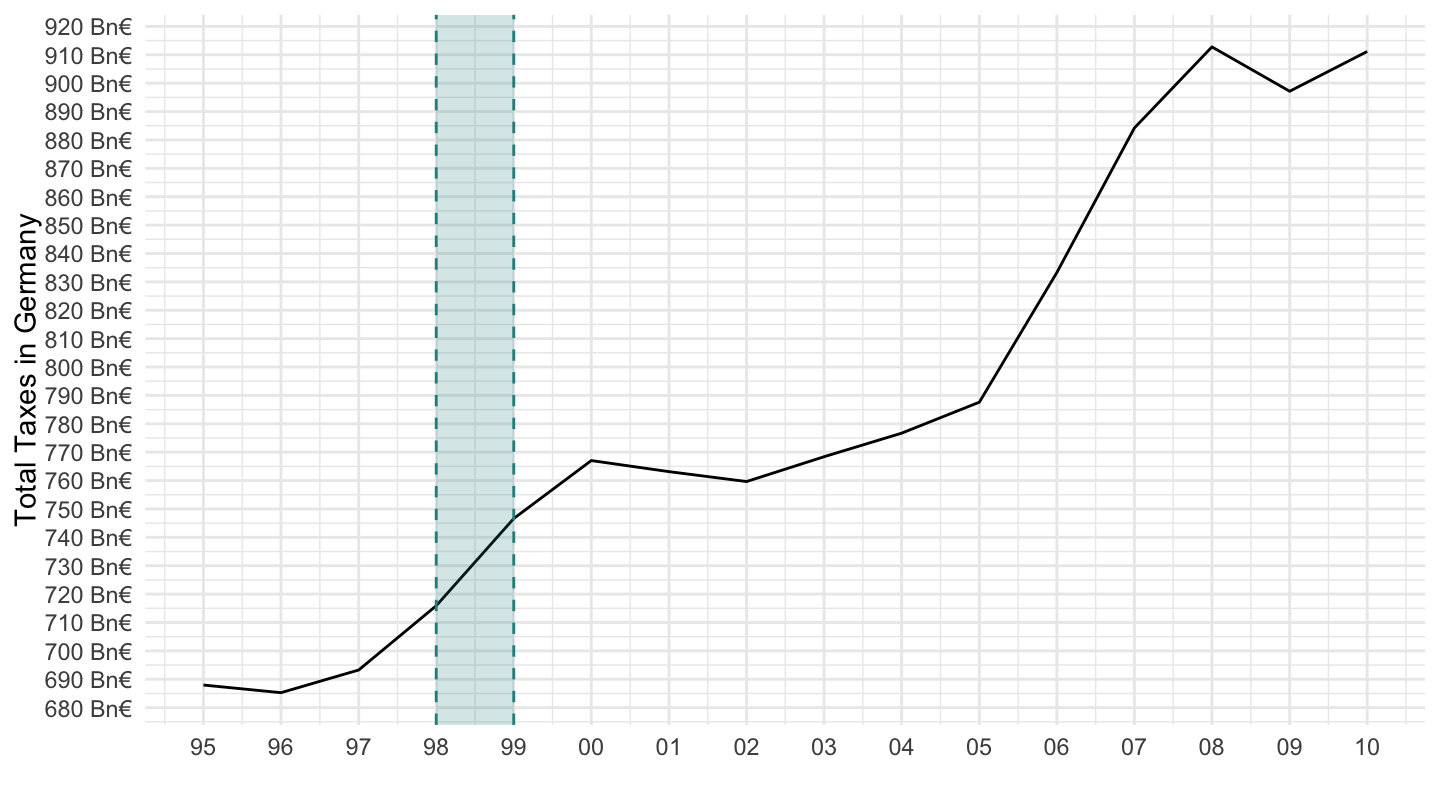
REV %>%
  filter(COU == "DEU",
         GOV == "NES",
         TAX %in% c("5100", "5110", "5120"),
         VAR == "TAXGDP") %>%
  select(TAX, obsValue, obsTime) %>%
  year_to_enddate %>%
  left_join(REV_var$TAX, by = "TAX") %>%
  ggplot(.) + theme_minimal() + xlab("") + ylab("") +
  geom_line(aes(x = date, y = obsValue/100, color = Tax, linetype = Tax)) +
  scale_color_manual(values = viridis(4)[1:3]) +
  scale_x_date(breaks = seq(1960, 2020, 5) %>% paste0("-01-01") %>% as.Date,
               labels = date_format("%y")) +
  theme(legend.position = c(0.6, 0.9),
        legend.title = element_blank(),
        legend.direction = "vertical") +
  scale_y_continuous(breaks = 0.01*seq(00, 150, 1),
                     labels = scales::percent_format(accuracy = 1),
                     limits = 0.01*c(2.5, 13))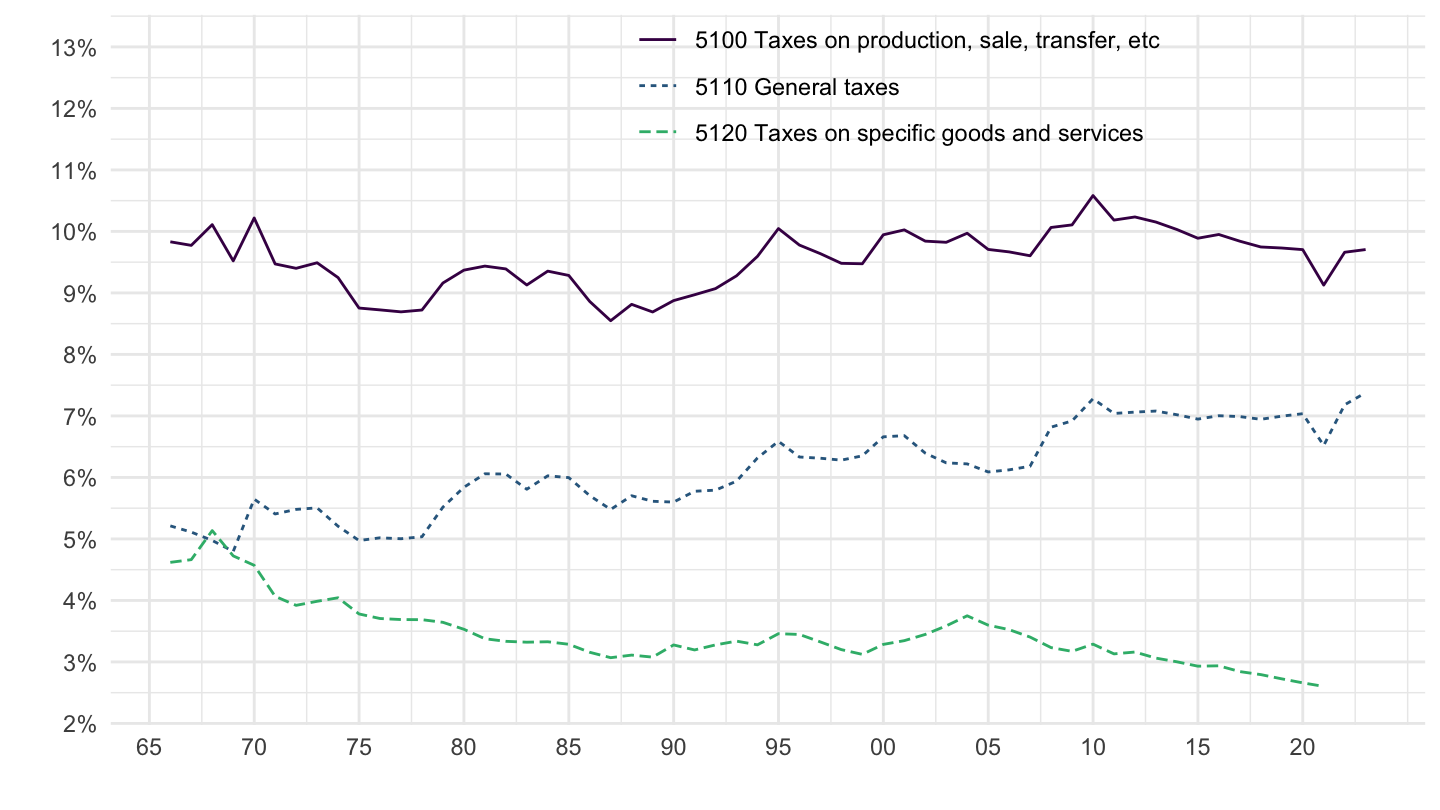
REV %>%
  filter(COU == "FRA",
         GOV == "NES",
         TAX %in% c("5100", "5110", "5120"),
         VAR == "TAXGDP") %>%
  select(TAX, obsValue, obsTime) %>%
  year_to_enddate %>%
  left_join(REV_var$TAX, by = "TAX") %>%
  ggplot(.) + theme_minimal() + xlab("") + ylab("") +
  geom_line(aes(x = date, y = obsValue/100, color = Tax, linetype = Tax)) +
  scale_color_manual(values = viridis(4)[1:3]) +
  scale_x_date(breaks = seq(1960, 2020, 5) %>% paste0("-01-01") %>% as.Date,
               labels = date_format("%y")) +
  theme(legend.position = c(0.6, 0.9),
        legend.title = element_blank(),
        legend.direction = "vertical") +
  scale_y_continuous(breaks = 0.01*seq(00, 150, 1),
                     labels = scales::percent_format(accuracy = 1),
                     limits = 0.01*c(2.5, 16))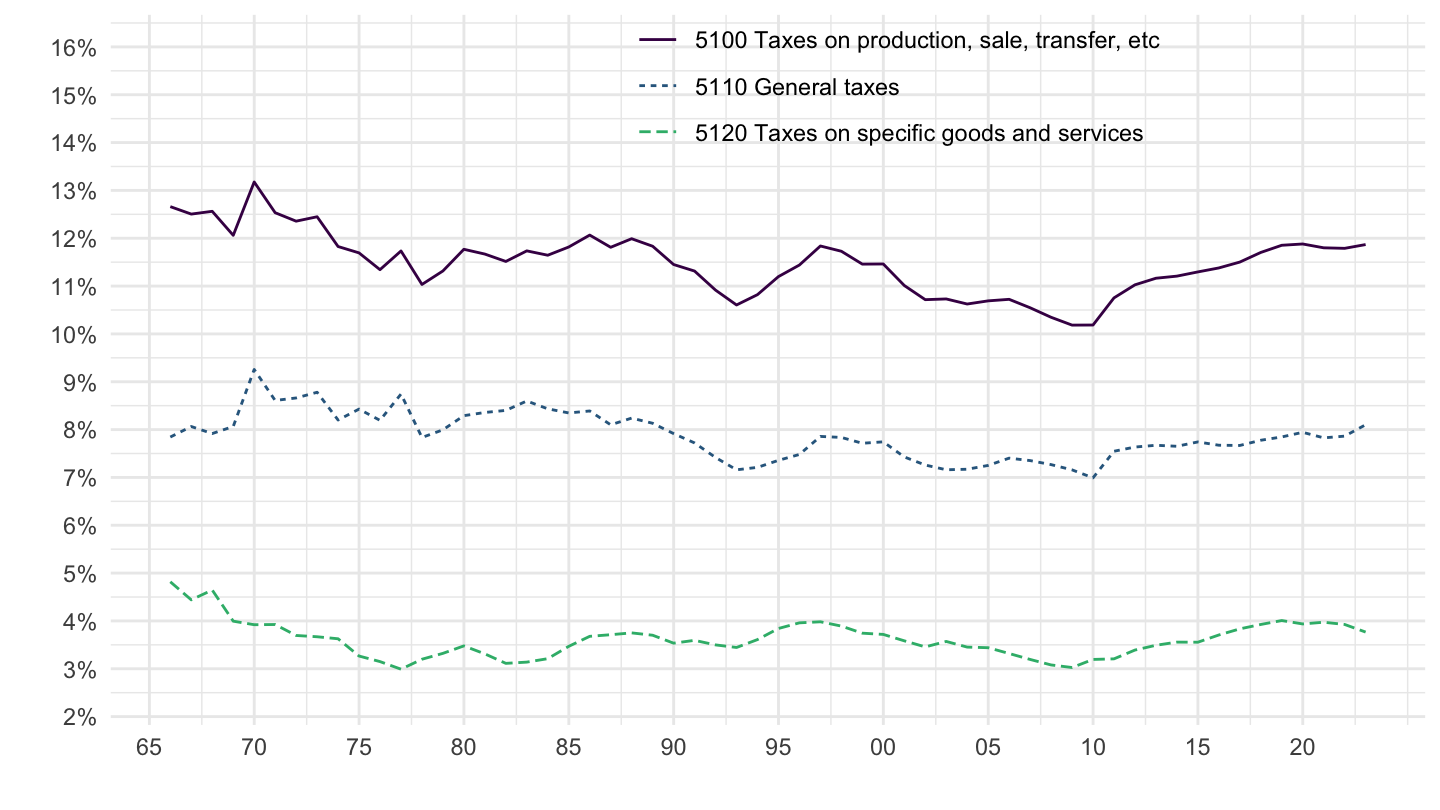
REV %>%
  filter(COU == "JPN",
         GOV == "NES",
         TAX %in% c("5100", "5110", "5120"),
         VAR == "TAXGDP") %>%
  select(TAX, obsValue, obsTime) %>%
  year_to_enddate %>%
  left_join(REV_var$TAX, by = "TAX") %>%
  ggplot(.) + theme_minimal() + xlab("") + ylab("") +
  geom_line(aes(x = date, y = obsValue/100, color = Tax, linetype = Tax)) +
  scale_color_manual(values = viridis(4)[1:3]) +
  scale_x_date(breaks = seq(1960, 2020, 5) %>% paste0("-01-01") %>% as.Date,
               labels = date_format("%y")) +
  theme(legend.position = c(0.6, 0.9),
        legend.title = element_blank(),
        legend.direction = "vertical") +
  scale_y_continuous(breaks = 0.01*seq(00, 150, 1),
                     labels = scales::percent_format(accuracy = 1),
                     limits = 0.01*c(0, 8))
Social security contributions - 2000
All
Code
Of households - 2100
Code
Corporate - 2200
Code