Last data update: 02 août 2026, 09:07
Last compile: 09 oct. 2026, 23:44
REGION_LABOUR |>
  group_by(TIME) |>
  summarise(Nobs = n()) |>
print_table_conditional()| TIME | Nobs |
|---|---|
| 1995 | 23742 |
| 1996 | 28924 |
| 1997 | 29007 |
| 1998 | 31279 |
| 1999 | 64160 |
| 2000 | 72104 |
| 2001 | 91732 |
| 2002 | 93706 |
| 2003 | 94274 |
| 2004 | 98727 |
| 2005 | 101564 |
| 2006 | 102183 |
| 2007 | 129031 |
| 2008 | 133157 |
| 2009 | 132747 |
| 2010 | 127719 |
| 2011 | 129313 |
| 2012 | 129758 |
| 2013 | 129728 |
| 2014 | 125869 |
| 2015 | 109038 |
| 2016 | 109495 |
| 2017 | 100578 |
| 2018 | 62979 |
| 2019 | 4743 |
REGION_LABOUR |>
  filter(VAR == "UNEM_RA_15_MAX",
         SEX == "T",
         UNIT == "PC",
         POS == "ALL",
         TIME %in% c("1997", "2017", "2012", "2007", "2002")) |>
  left_join(REGION_LABOUR_var$REG_ID, by = "REG_ID") |>
  select(TL, REG_ID, Reg_id, TIME, obsValue) |>
  spread(TIME, obsValue) |>
print_table_conditional()REGION_LABOUR |>
filter(REG_ID %in% c("BE1", "BE2", "BE3"),
VAR == "UNEM_RA_15_MAX",
SEX == "T",
POS == "ALL") |>
left_join(REGION_LABOUR_var$REG_ID, by = "REG_ID") |>
group_by(REG_ID) |>
arrange(TIME) |>
mutate(date = paste0(TIME, "-01-01") |> as.Date()) |>
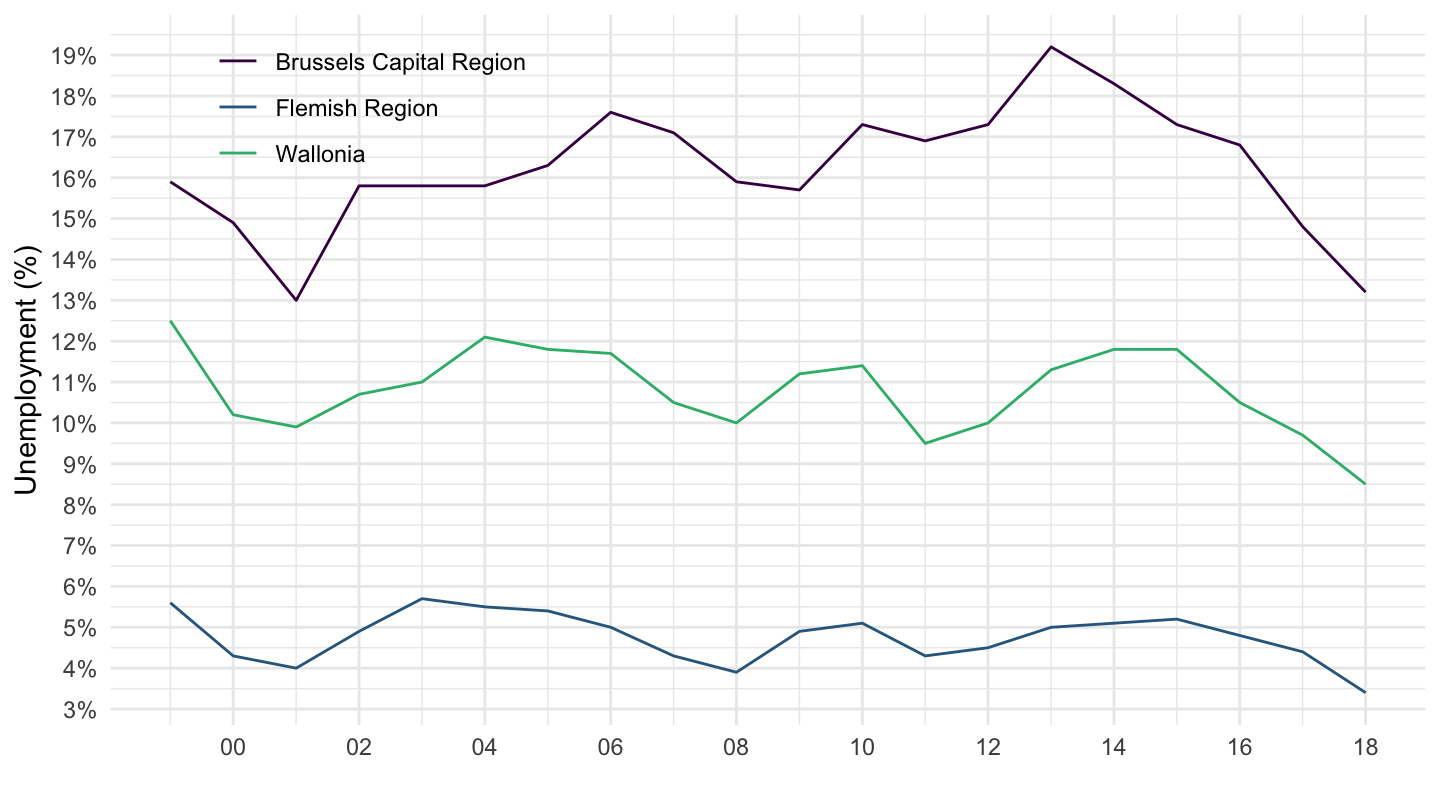
ggplot() + geom_line(aes(x = date, y = obsValue/100, color = Reg_id)) +
scale_color_manual(values = viridis(4)[1:3]) + theme_minimal() +
scale_x_date(breaks = as.Date(paste0(seq(1960, 2020, 2), "-01-01")),
labels = date_format("%Y")) +
theme(legend.position = c(0.2, 0.87),
legend.title = element_blank()) +
xlab("") + ylab("Unemployment (%)") +
scale_y_continuous(breaks = 0.01*seq(0, 200, 1),
labels = scales::percent_format(accuracy = 1))