Last observation: Q1 2026 (N = 39) · 2025 (N = 20109)
First observation: 1947 (N = 164) · Q1 1947 (N = 163)
Last data update: 02 août 2026, 09:06
Last compile: 26 oct. 2026, 00:52
QNA_EXPENDITURE_CAPITA |>
  left_join(FREQ, by = "FREQ") |>
  group_by(FREQ, Freq) |>
  summarise(Nobs = n()) |>
  arrange(-Nobs) |>
print_table_conditional()| FREQ | Freq | Nobs |
|---|---|---|
| Q | Quarterly | 11992 |
| A | Annual | 3117 |
QNA_EXPENDITURE_CAPITA |>
  left_join(PRICE_BASE, by = "PRICE_BASE") |>
  group_by(PRICE_BASE, Price_base) |>
  summarise(Nobs = n()) |>
  arrange(-Nobs) |>
print_table_conditional()| PRICE_BASE | Price_base | Nobs |
|---|---|---|
| V | Prix courants | 7555 |
| LR | Volumes chaînés (rebasés) | 7554 |
metadata_load_fr("REF_AREA", "CL_AREA")
QNA_EXPENDITURE_CAPITA |>
  filter(REF_AREA %in% c("USA", "EA20"),
         FREQ == "Q",
         PRICE_BASE == "LR") |>
  quarter_to_date() |>
  mutate(Ref_area = ifelse(REF_AREA == "EA20", "Zone euro à 20", Ref_area)) |>
  group_by(Ref_area) |>
  arrange(date) |>
  mutate(obsValue = 100 * obsValue / obsValue[1]) |>
  add_flag_color("Ref_area") |>
  #mutate(color = color) %>%
  ggplot() + theme_minimal() + xlab("") + ylab("PIB par habitant (1995T1 = 100)") +
  geom_line(aes(x = date, y = obsValue, color = Ref_area)) +
  # #003399, #3C3B6E
  scale_color_manual(values = c("#B22234", "#003399")) +
  geom_rect(data = nber_recessions |>
              filter(Peak > as.Date("1999-01-01")),
            aes(xmin = Peak, xmax = Trough, ymin = 0, ymax = +Inf),
            fill = '#B22234', alpha = 0.1)  +
  geom_rect(data = cepr_recessions |>
              filter(Peak > as.Date("1999-01-01")),
            aes(xmin = Peak, xmax = Trough, ymin = 0, ymax = +Inf),
            fill = '#003399', alpha = 0.1)  +
  scale_x_date(breaks = c(seq(1940, 2100, 5)) |> paste0("-01-01") |> as.Date(),
               labels = date_format("%Y")) +
  theme(legend.position = c(0.26, 0.8),
        legend.title = element_blank()) +
  scale_y_log10(breaks = seq(100, 1000, 20))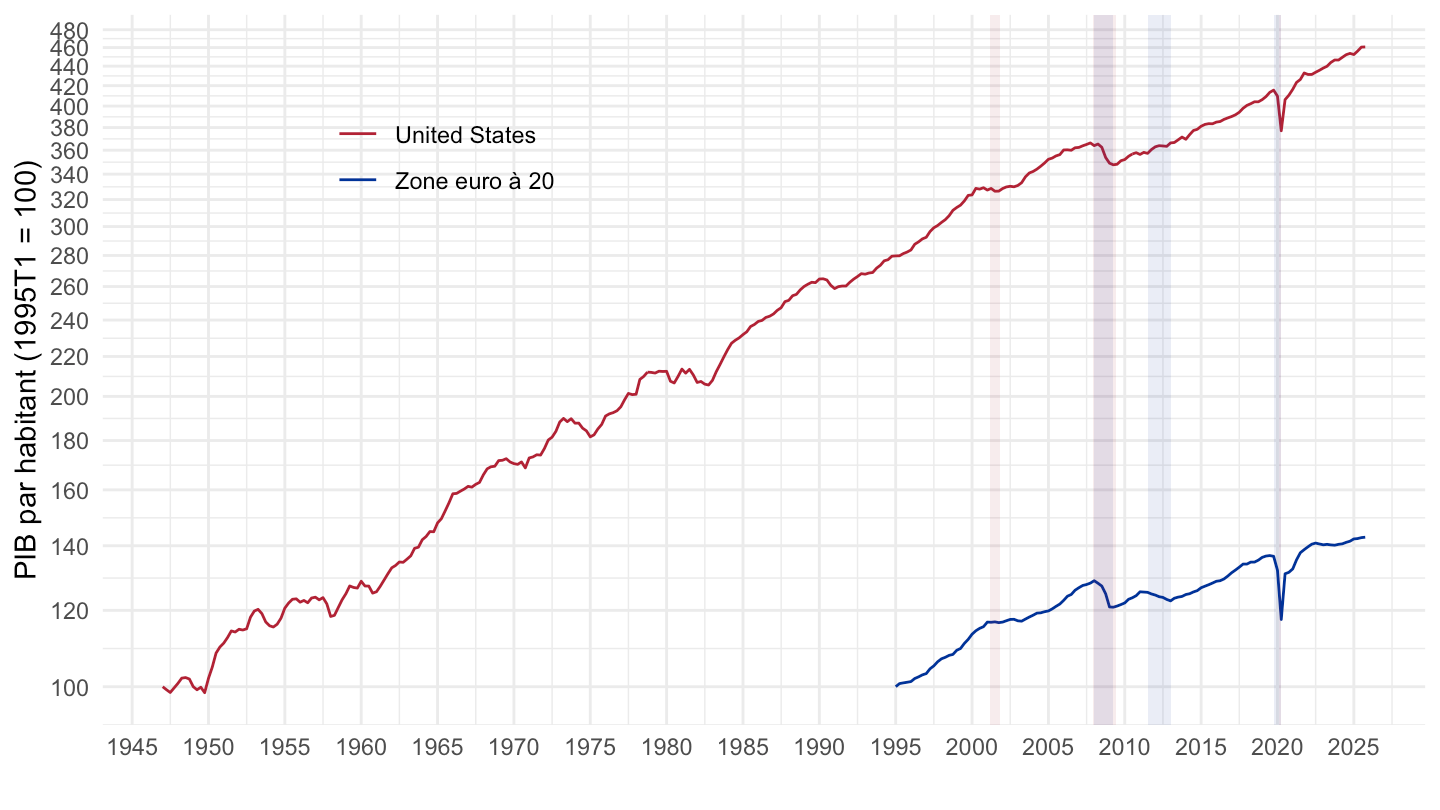
metadata_load_fr("REF_AREA", "CL_AREA")
plot <- QNA_EXPENDITURE_CAPITA |>
  filter(REF_AREA %in% c("USA", "EA20"),
         FREQ == "Q",
         PRICE_BASE == "LR") |>
  quarter_to_date() |>
  filter(date >= as.Date("1995-01-01")) |>
  mutate(Ref_area = ifelse(REF_AREA == "EA20", "Zone euro à 20", Ref_area)) |>
  group_by(Ref_area) |>
  arrange(date) |>
  mutate(obsValue = 100 * obsValue / obsValue[1]) |>
  add_flag_color("Ref_area") |>
  #mutate(color = color) %>%
  ggplot() + theme_minimal() + xlab("") + ylab("PIB par habitant (1995T1 = 100)") +
  geom_line(aes(x = date, y = obsValue, color = Ref_area)) +
  # #003399, #3C3B6E
  scale_color_manual(values = c("#B22234", "#003399")) +
  geom_rect(data = nber_recessions |>
              filter(Peak > as.Date("1999-01-01")),
            aes(xmin = Peak, xmax = Trough, ymin = 0, ymax = +Inf),
            fill = '#B22234', alpha = 0.1)  +
  geom_rect(data = cepr_recessions |>
              filter(Peak > as.Date("1999-01-01")),
            aes(xmin = Peak, xmax = Trough, ymin = 0, ymax = +Inf),
            fill = '#003399', alpha = 0.1)  +
  scale_x_date(breaks = c(seq(1994, 2100, 5), seq(1997, 2100, 5)) |> paste0("-01-01") |> as.Date(),
               labels = date_format("%Y")) +
  theme(legend.position = c(0.26, 0.8),
        legend.title = element_blank()) +
  scale_y_log10(breaks = seq(50, 200, 5))

plot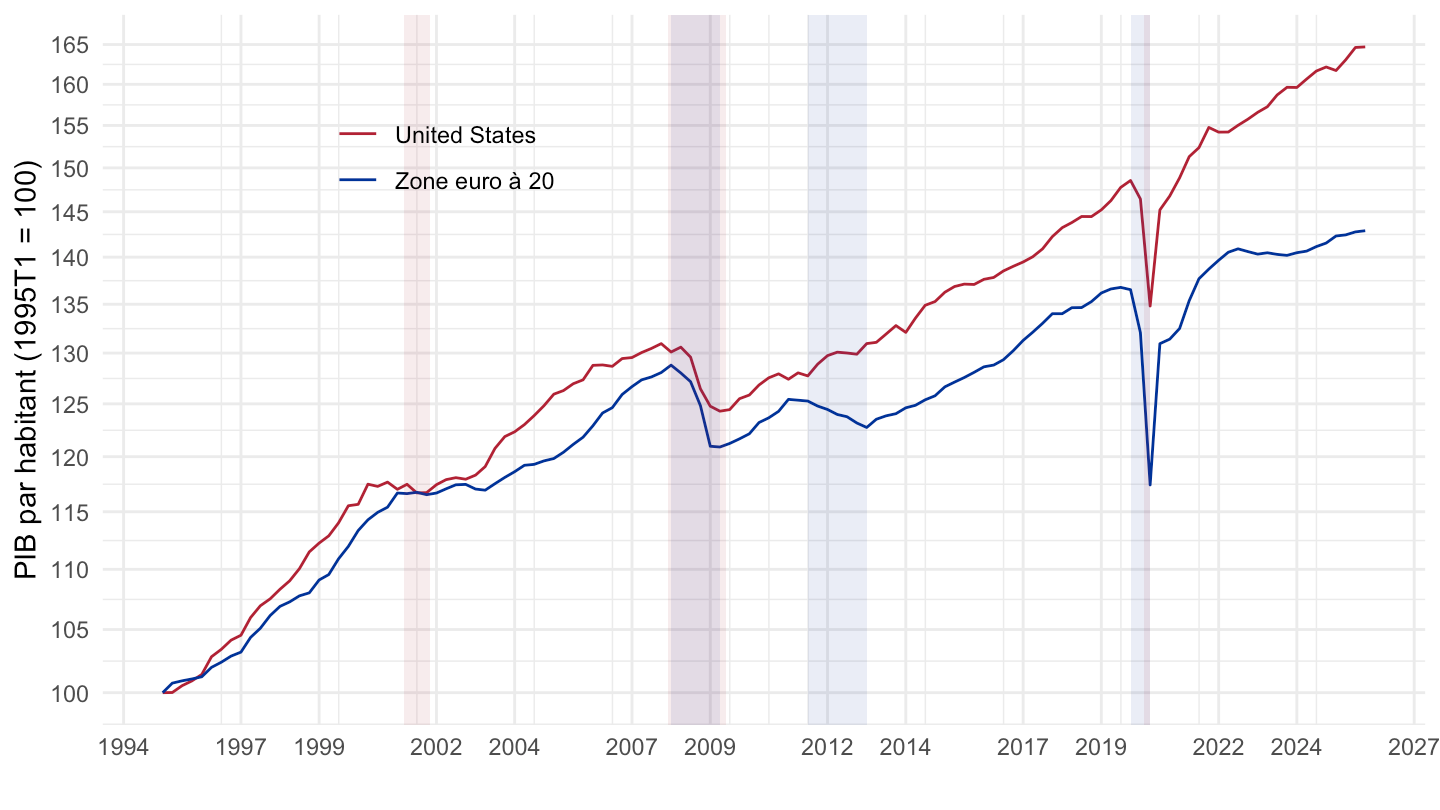
save(plot, file = "QNA_EXPENDITURE_CAPITA_files/figure-html/USA-EA20-1995-1.RData")metadata_load_fr("REF_AREA", "CL_AREA")
plot <- QNA_EXPENDITURE_CAPITA |>
filter(REF_AREA %in% c("USA", "EA20", "EU27_2020"),
FREQ == "Q",
PRICE_BASE == "LR") |>
quarter_to_date() |>
filter(date >= as.Date("1995-01-01")) |>
mutate(Ref_area = ifelse(REF_AREA == "EA20", "Zone euro à 20", Ref_area),
Ref_area = ifelse(REF_AREA == "EU27_2020", "UE à 27", Ref_area)) |>
group_by(Ref_area) |>
arrange(date) |>
mutate(obsValue = 100 * obsValue / obsValue[1]) |>
ungroup() |>
add_flag_color("Ref_area") |>
#mutate(color = color) %>%
ggplot() + theme_minimal() + xlab("") + ylab("PIB par habitant (1999T1 = 100)") +
geom_line(aes(x = date, y = obsValue, color = Ref_area, linetype = Ref_area)) +
# #003399, #3C3B6E
scale_color_manual(values = c("#B22234", "#003399", "#003399")) +
scale_linetype_manual(values = c("solid", "solid", "dashed")) +
geom_rect(data = nber_recessions |>
filter(Peak > as.Date("1999-01-01")),
aes(xmin = Peak, xmax = Trough, ymin = 0, ymax = +Inf),
fill = '#B22234', alpha = 0.1) +
geom_rect(data = cepr_recessions |>
filter(Peak > as.Date("1999-01-01")),
aes(xmin = Peak, xmax = Trough, ymin = 0, ymax = +Inf),
fill = '#003399', alpha = 0.1) +
scale_x_date(breaks = c(seq(1995, 2100, 2)) |> paste0("-01-01") |> as.Date(),
labels = date_format("%Y")) +
theme(legend.position = c(0.26, 0.8),
legend.title = element_blank()) +
scale_y_log10(breaks = seq(50, 200, 5)) +
labs(caption = "")
plot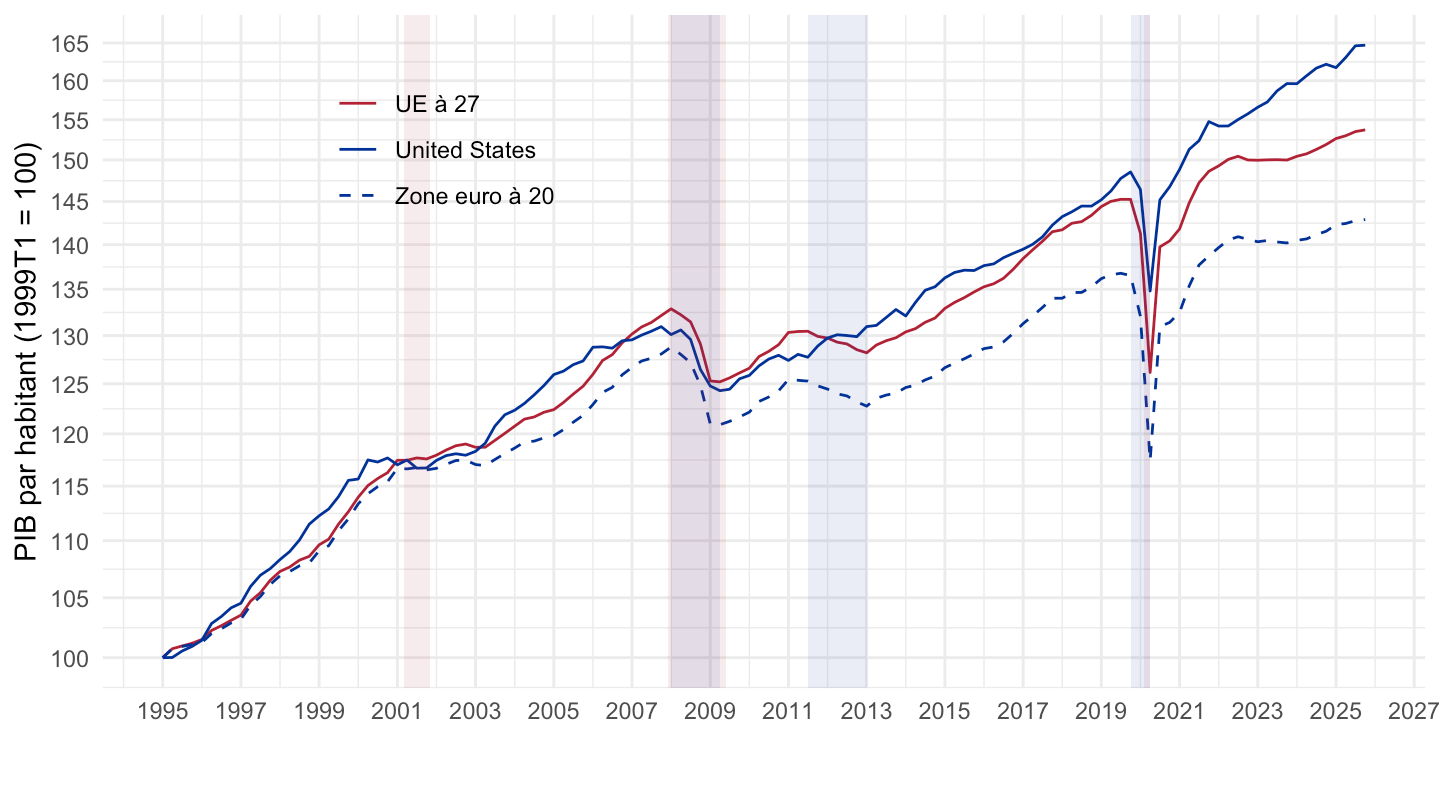
save(plot, file = "QNA_EXPENDITURE_CAPITA_files/figure-html/USA-EA20-EU27-1999-1.RData")plot <- QNA_EXPENDITURE_CAPITA |>
filter(REF_AREA %in% c("USA", "EA20"),
FREQ == "Q",
PRICE_BASE == "LR") |>
quarter_to_date() |>
filter(date >= as.Date("1999-01-01")) |>
mutate(Ref_area = ifelse(REF_AREA == "EA20", "Europe", Ref_area)) |>
group_by(Ref_area) |>
arrange(date) |>
mutate(obsValue = 100 * obsValue / obsValue[1]) |>
add_flag_color("Ref_area") |>
#mutate(color = color) %>%
ggplot() + theme_minimal() + xlab("") + ylab("GDP per capita (100 = 1999Q1)") +
geom_line(aes(x = date, y = obsValue, color = Ref_area)) +
# #003399, #3C3B6E
scale_color_manual(values = c("#003399", "#B22234")) + add_2flags +
geom_rect(data = nber_recessions |>
filter(Peak > as.Date("1999-01-01")),
aes(xmin = Peak, xmax = Trough, ymin = 0, ymax = +Inf),
fill = '#B22234', alpha = 0.1) +
geom_rect(data = cepr_recessions |>
filter(Peak > as.Date("1999-01-01")),
aes(xmin = Peak, xmax = Trough, ymin = 0, ymax = +Inf),
fill = '#003399', alpha = 0.1) +
scale_x_date(breaks = c(seq(1999, 2100, 2)) |> paste0("-01-01") |> as.Date(),
labels = date_format("%Y")) +
theme(legend.position = c(0.26, 0.8),
legend.title = element_blank()) +
scale_y_log10(breaks = seq(50, 200, 5))
plot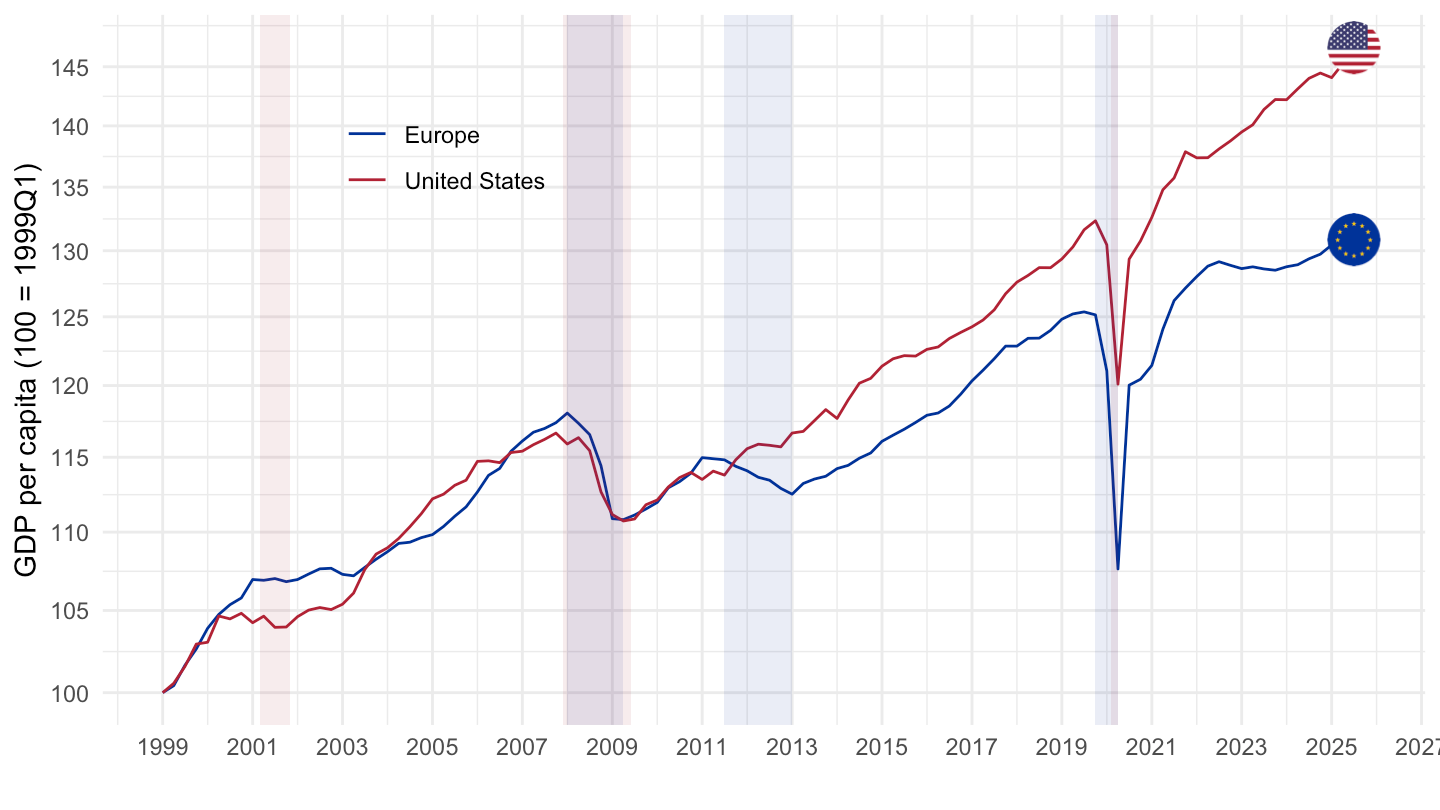
metadata_load_fr("REF_AREA", "CL_AREA")
plot <- QNA_EXPENDITURE_CAPITA |>
  filter(REF_AREA %in% c("USA", "EA20"),
         FREQ == "Q",
         PRICE_BASE == "LR") |>
  quarter_to_date() |>
  filter(date >= as.Date("1999-01-01")) |>
  mutate(Ref_area = ifelse(REF_AREA == "EA20", "Zone euro à 20", Ref_area)) |>
  group_by(Ref_area) |>
  arrange(date) |>
  mutate(obsValue = 100 * obsValue / obsValue[1]) |>
  ungroup() |>
  add_flag_color("Ref_area") |>
  #mutate(color = color) %>%
  ggplot() + theme_minimal() + xlab("") + ylab("PIB par habitant (1999T1 = 100)") +
  geom_line(aes(x = date, y = obsValue, color = Ref_area)) +
  # #003399, #3C3B6E
  scale_color_manual(values = c("#B22234", "#003399")) +
  geom_rect(data = nber_recessions |>
              filter(Peak > as.Date("1999-01-01")),
            aes(xmin = Peak, xmax = Trough, ymin = 0, ymax = +Inf),
            fill = '#B22234', alpha = 0.1)  +
  geom_rect(data = cepr_recessions |>
              filter(Peak > as.Date("1999-01-01")),
            aes(xmin = Peak, xmax = Trough, ymin = 0, ymax = +Inf),
            fill = '#003399', alpha = 0.1)  +
  scale_x_date(breaks = c(seq(1999, 2100, 2)) |> paste0("-01-01") |> as.Date(),
               labels = date_format("%Y")) +
  theme(legend.position = c(0.26, 0.8),
        legend.title = element_blank()) +
  scale_y_log10(breaks = seq(50, 200, 5)) +
  labs(caption = "")

plot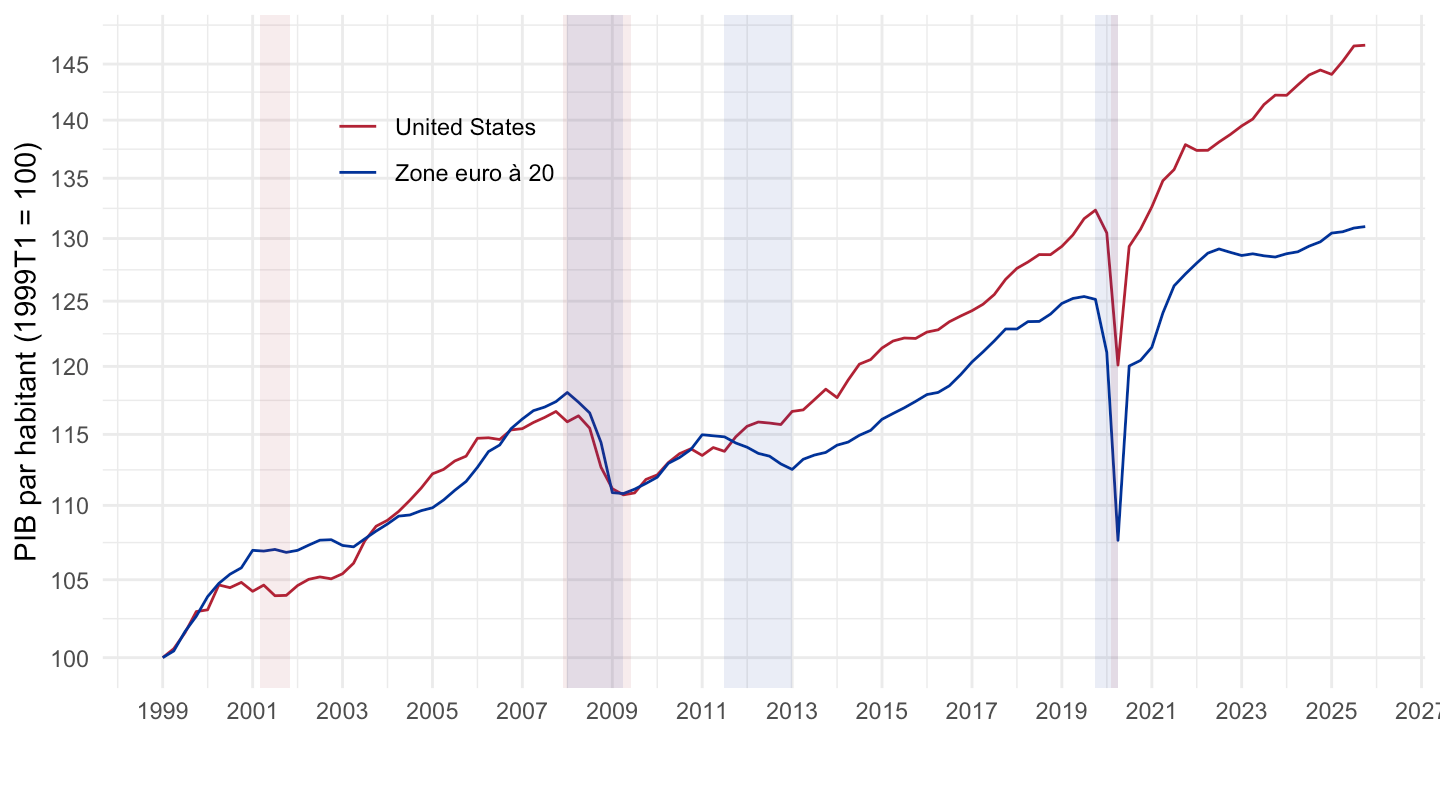
save(plot, file = "QNA_EXPENDITURE_CAPITA_files/figure-html/USA-EA20-1999-1.RData")metadata_load_fr("REF_AREA", "CL_AREA")
plot <- QNA_EXPENDITURE_CAPITA |>
filter(REF_AREA %in% c("USA", "EA20", "EU27_2020"),
FREQ == "Q",
PRICE_BASE == "LR") |>
quarter_to_date() |>
filter(date >= as.Date("1999-01-01")) |>
mutate(Ref_area = ifelse(REF_AREA == "EA20", "Zone euro à 20", Ref_area),
Ref_area = ifelse(REF_AREA == "EU27_2020", "UE à 27", Ref_area)) |>
group_by(Ref_area) |>
arrange(date) |>
mutate(obsValue = 100 * obsValue / obsValue[1]) |>
ungroup() |>
add_flag_color("Ref_area") |>
#mutate(color = color) %>%
ggplot() + theme_minimal() + xlab("") + ylab("PIB par habitant (1999T1 = 100)") +
geom_line(aes(x = date, y = obsValue, color = Ref_area, linetype = Ref_area)) +
# #003399, #3C3B6E
scale_color_manual(values = c("#B22234", "#003399", "#003399")) +
scale_linetype_manual(values = c("solid", "solid", "dashed")) +
geom_rect(data = nber_recessions |>
filter(Peak > as.Date("1999-01-01")),
aes(xmin = Peak, xmax = Trough, ymin = 0, ymax = +Inf),
fill = '#B22234', alpha = 0.1) +
geom_rect(data = cepr_recessions |>
filter(Peak > as.Date("1999-01-01")),
aes(xmin = Peak, xmax = Trough, ymin = 0, ymax = +Inf),
fill = '#003399', alpha = 0.1) +
scale_x_date(breaks = c(seq(1999, 2100, 2)) |> paste0("-01-01") |> as.Date(),
labels = date_format("%Y")) +
theme(legend.position = c(0.26, 0.8),
legend.title = element_blank()) +
scale_y_log10(breaks = seq(50, 200, 5)) +
labs(caption = "")
plot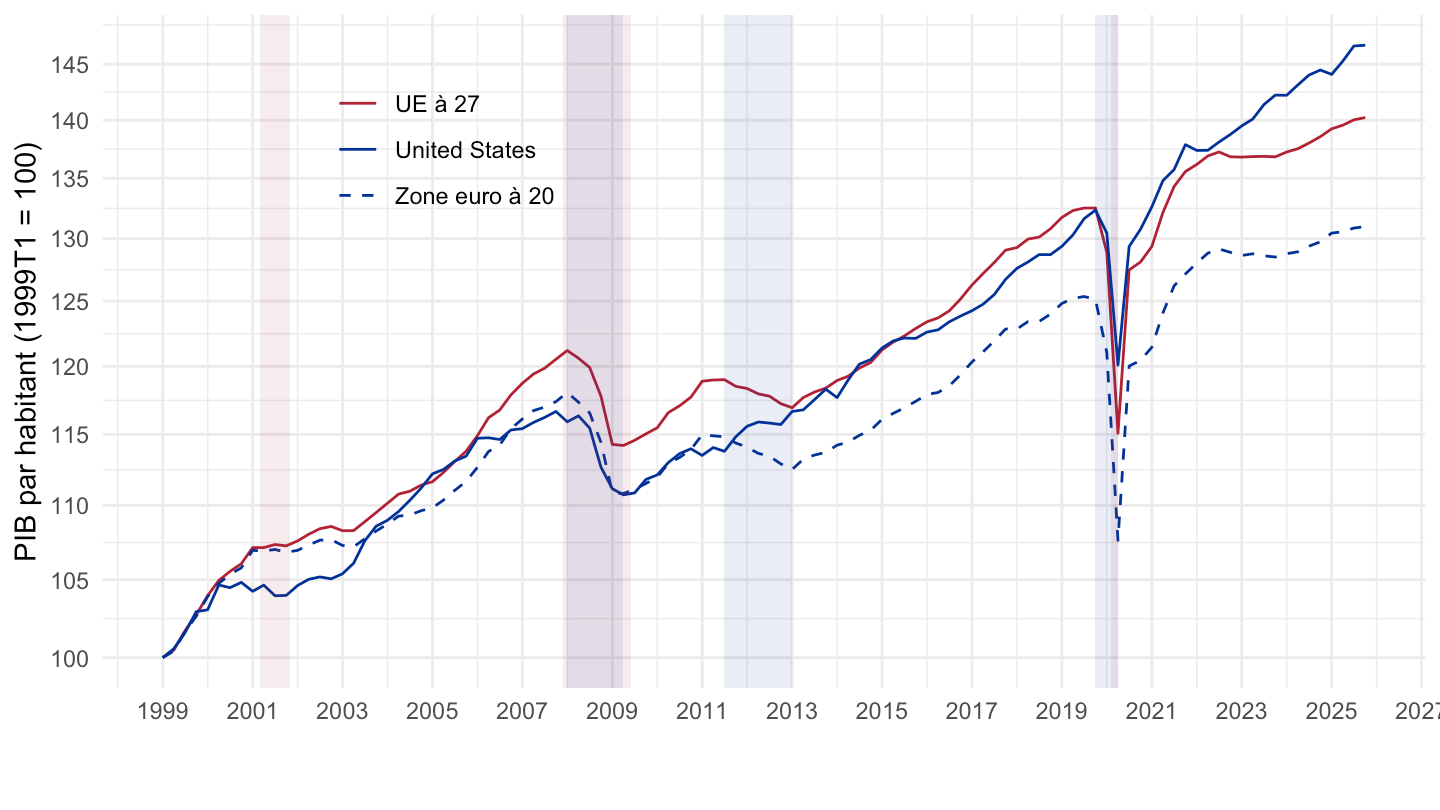
save(plot, file = "QNA_EXPENDITURE_CAPITA_files/figure-html/USA-EA20-EU27-1999-1.RData")metadata_load_fr("REF_AREA", "CL_AREA")
plot <- QNA_EXPENDITURE_CAPITA |>
filter(REF_AREA %in% c("USA", "EA20"),
FREQ == "Q",
PRICE_BASE == "LR") |>
quarter_to_date() |>
filter(date >= as.Date("2000-01-01")) |>
mutate(Ref_area = ifelse(REF_AREA == "EA20", "Zone euro à 20", Ref_area)) |>
group_by(Ref_area) |>
arrange(date) |>
mutate(obsValue = 100 * obsValue / obsValue[1]) |>
ggplot() + theme_minimal() + xlab("") + ylab("PIB par habitant (2000T1 = 100)") +
geom_line(aes(x = date, y = obsValue, color = Ref_area)) +
# #003399, #3C3B6E
scale_color_manual(values = c("#B22234", "#003399")) +
geom_rect(data = nber_recessions |>
filter(Peak > as.Date("1999-01-01")),
aes(xmin = Peak, xmax = Trough, ymin = 0, ymax = +Inf),
fill = '#B22234', alpha = 0.1) +
geom_rect(data = cepr_recessions |>
filter(Peak > as.Date("1999-01-01")),
aes(xmin = Peak, xmax = Trough, ymin = 0, ymax = +Inf),
fill = '#003399', alpha = 0.1) +
scale_x_date(breaks = c(seq(2000, 2100, 2)) |> paste0("-01-01") |> as.Date(),
labels = date_format("%Y")) +
theme(legend.position = c(0.26, 0.8),
legend.title = element_blank()) +
scale_y_log10(breaks = seq(50, 200, 5))
save(plot, file = "QNA_EXPENDITURE_CAPITA_files/figure-html/USA-EA20-2000-1.RData")
plot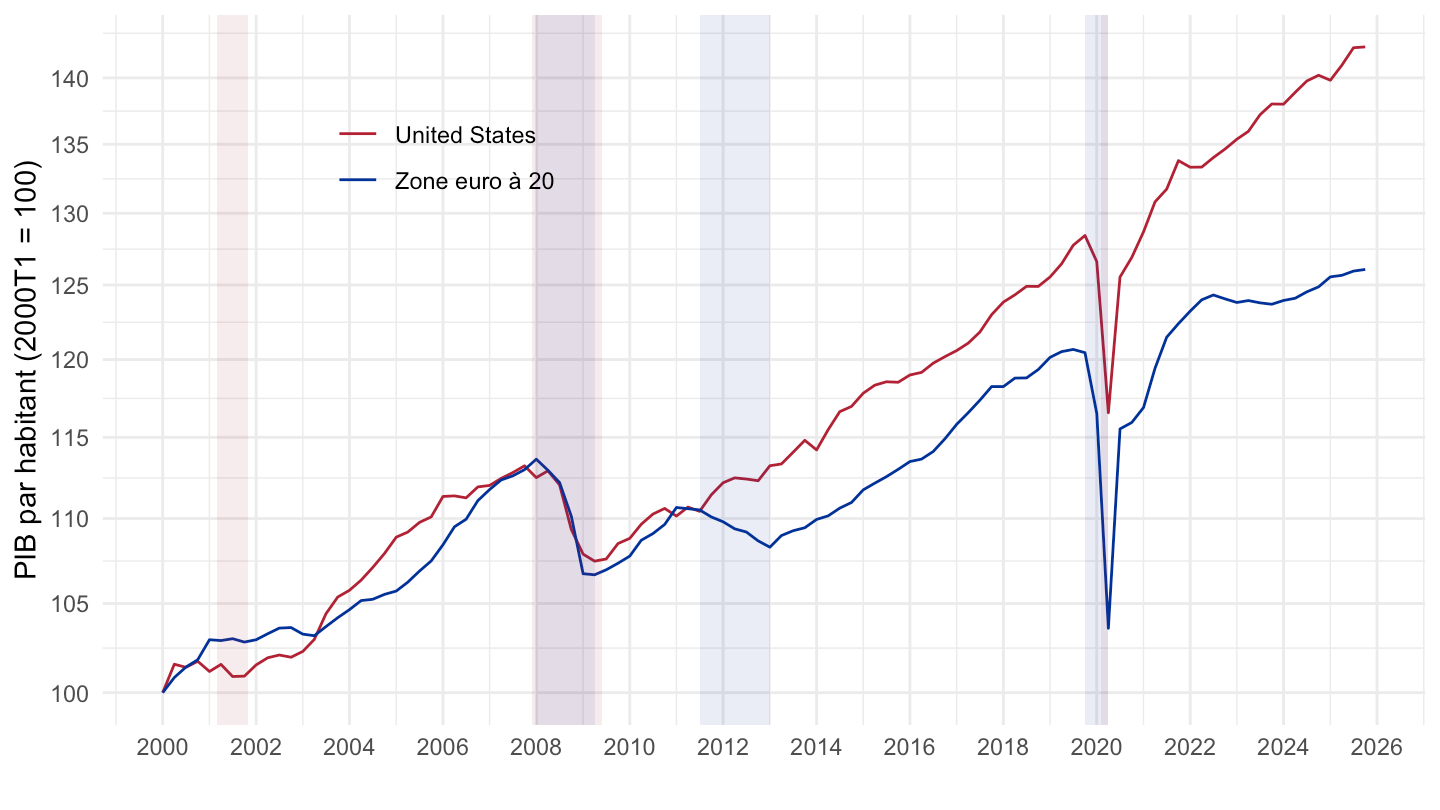
QNA_EXPENDITURE_CAPITA |>
  filter(REF_AREA %in% c("FRA", "PRT", "ESP", "GRC", "ITA"),
         FREQ == "Q",
         PRICE_BASE == "LR") |>
  quarter_to_date() |>
  filter(date >= as.Date("1995-01-01")) |>
  mutate(Ref_area = ifelse(REF_AREA == "EA20", "Europe", Ref_area)) |>
  group_by(Ref_area) |>
  arrange(date) |>
  mutate(obsValue = 100 * obsValue / obsValue[date == as.Date("2008-01-01")]) |>
  add_flag_color("Ref_area") |>
  ggplot() + theme_minimal() + xlab("") + ylab("GDP Per capita (2008 = 100)") +
  geom_line(aes(x = date, y = obsValue, color = color)) + add_5flags +
  scale_color_identity() +
  scale_x_date(breaks = seq(1960, 2100, 2) |> paste0("-01-01") |> as.Date(),
               labels = date_format("%Y")) +
  theme(legend.position = "none") +
  scale_y_log10(breaks = seq(50, 200, 5))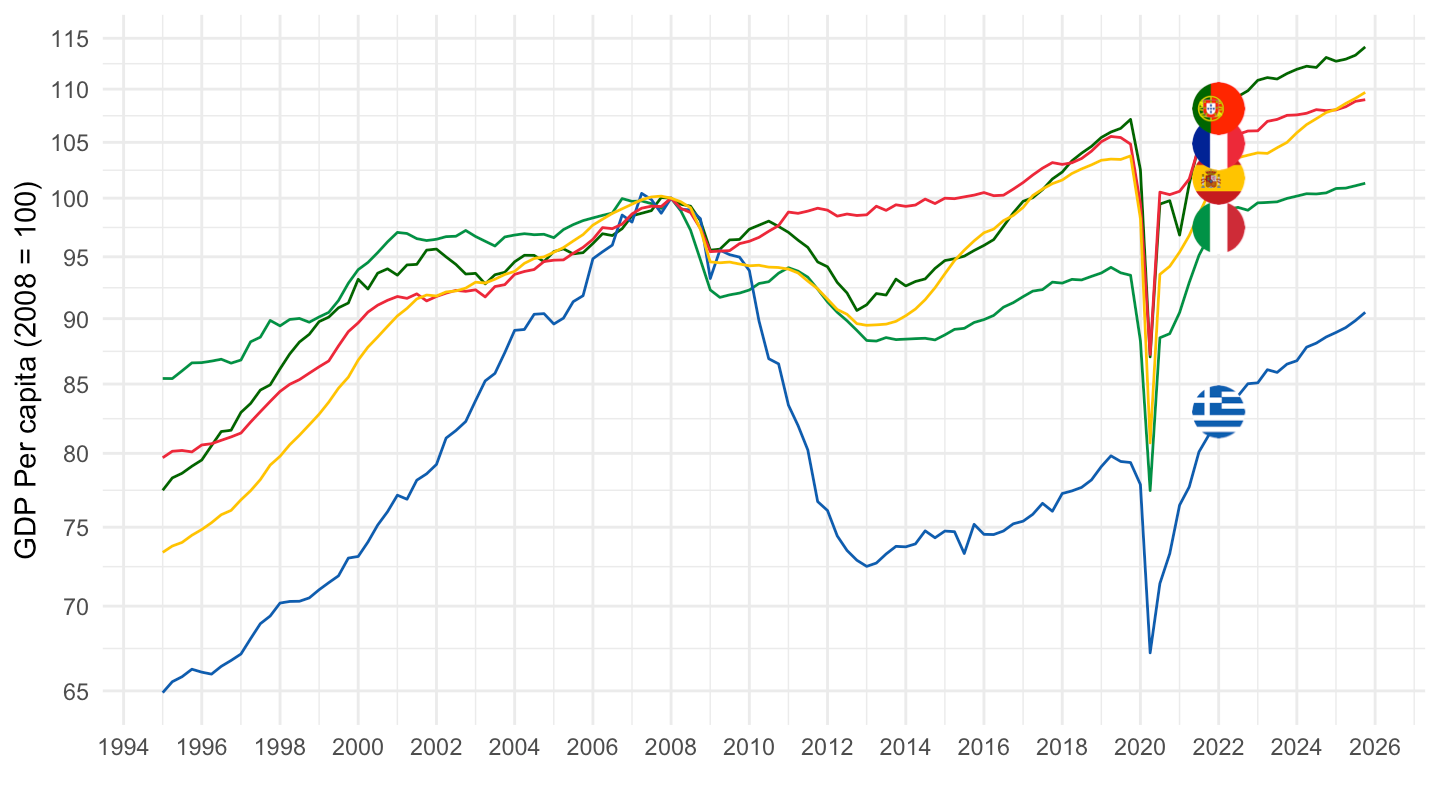
QNA_EXPENDITURE_CAPITA |>
  filter(REF_AREA %in% c("FRA", "PRT", "ESP", "GRC", "ITA"),
         FREQ == "Q",
         PRICE_BASE == "LR") |>
  quarter_to_date() |>
  filter(date >= as.Date("2008-01-01")) |>
  mutate(Ref_area = ifelse(REF_AREA == "EA20", "Europe", Ref_area)) |>
  group_by(Ref_area) |>
  arrange(date) |>
  mutate(obsValue = 100 * obsValue / obsValue[date == as.Date("2008-01-01")]) |>
  add_flag_color("Ref_area") |>
  ggplot() + theme_minimal() + xlab("") + ylab("PIB par habitant (2008 = 100)") +
  geom_line(aes(x = date, y = obsValue, color = color)) + add_5flags +
  scale_color_identity() +
  scale_x_date(breaks = seq(1960, 2100, 2) |> paste0("-01-01") |> as.Date(),
               labels = date_format("%Y")) +
  theme(legend.position = "none") +
  scale_y_log10(breaks = seq(50, 200, 5))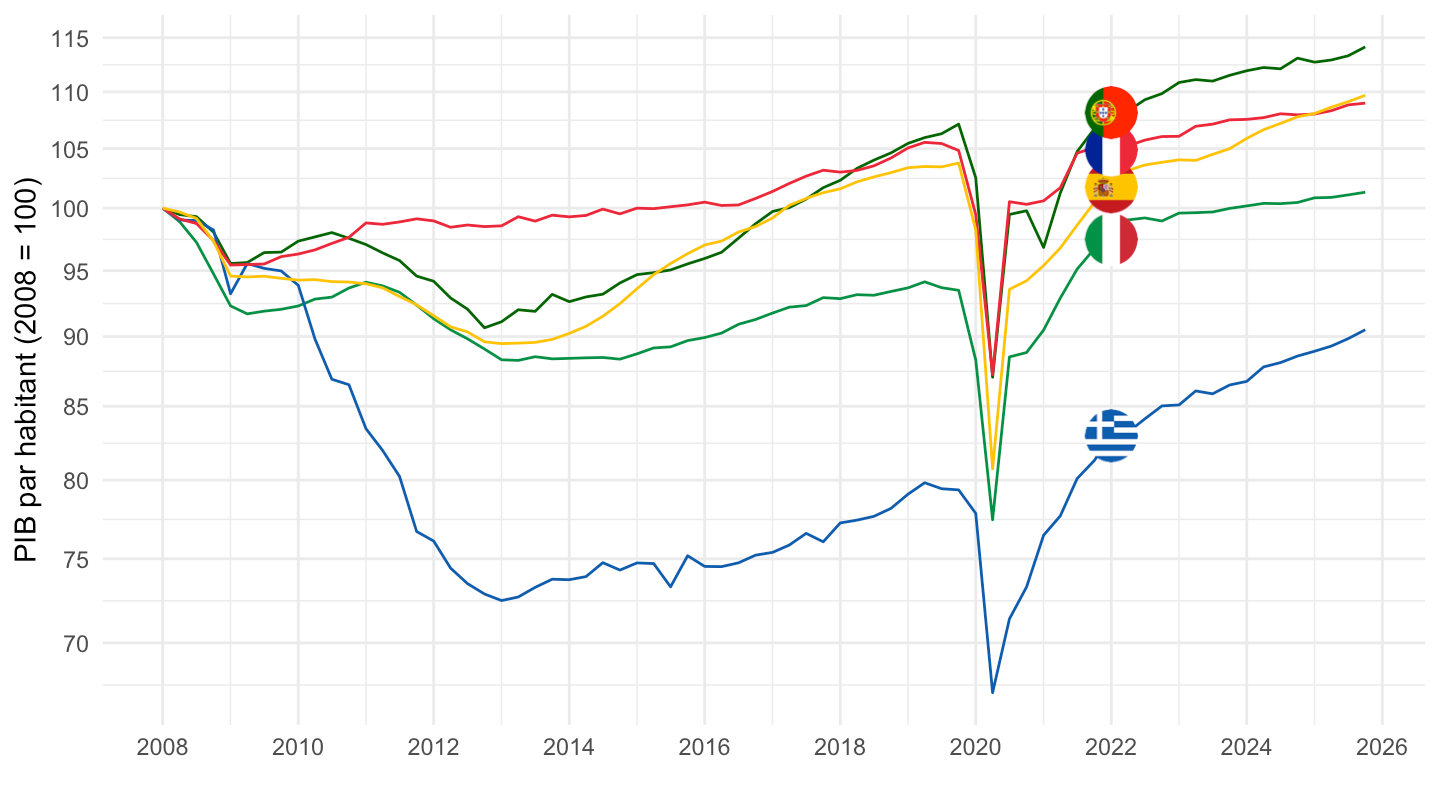
QNA_EXPENDITURE_CAPITA |>
  filter(REF_AREA %in% c("FRA", "DEU", "GRC", "EA20", "USA"),
         FREQ == "Q",
         PRICE_BASE == "LR") |>
  quarter_to_date() |>
  filter(date >= as.Date("1995-01-01")) |>
  mutate(Ref_area = ifelse(REF_AREA == "EA20", "Europe", Ref_area)) |>
  group_by(Ref_area) |>
  arrange(date) |>
  mutate(obsValue = 100 * obsValue / obsValue[date == as.Date("2008-01-01")]) |>
  add_flag_color("Ref_area") |>
  ggplot() + theme_minimal() + xlab("") + ylab("GDP Per capita (2008 = 100)") +
  geom_line(aes(x = date, y = obsValue, color = color)) + add_5flags +
  scale_color_identity() +
  scale_x_date(breaks = seq(1995, 2100, 5) |> paste0("-01-01") |> as.Date(),
               labels = date_format("%Y")) +
  theme(legend.position = "none") +
  scale_y_log10(breaks = seq(50, 200, 5))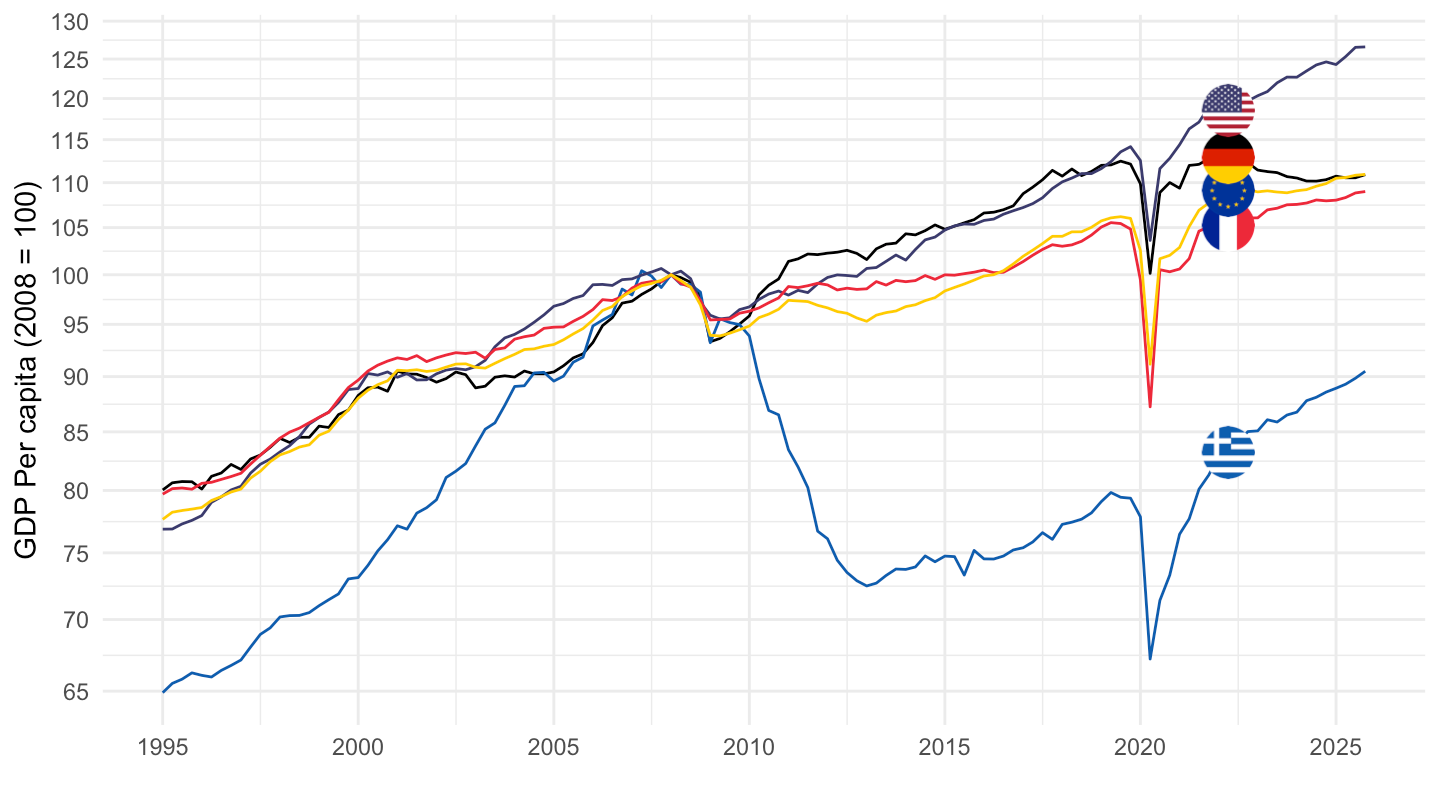
QNA_EXPENDITURE_CAPITA |>
  filter(REF_AREA %in% c("FRA", "DEU", "GRC", "EA20", "USA"),
         FREQ == "Q",
         PRICE_BASE == "LR") |>
  quarter_to_date() |>
  filter(date >= as.Date("1995-01-01")) |>
  mutate(Ref_area = ifelse(REF_AREA == "EA20", "Europe", Ref_area)) |>
  group_by(Ref_area) |>
  arrange(date) |>
  mutate(obsValue = 100 * obsValue / obsValue[date == as.Date("1995-01-01")]) |>
  add_flag_color("Ref_area") |>
  ggplot() + theme_minimal() + xlab("") + ylab("GDP Per capita (1995 = 100)") +
  geom_line(aes(x = date, y = obsValue, color = color)) + add_5flags +
  scale_color_identity() +
  scale_x_date(breaks = seq(1995, 2100, 5) |> paste0("-01-01") |> as.Date(),
               labels = date_format("%Y")) +
  theme(legend.position = "none") +
  scale_y_log10(breaks = seq(50, 200, 5))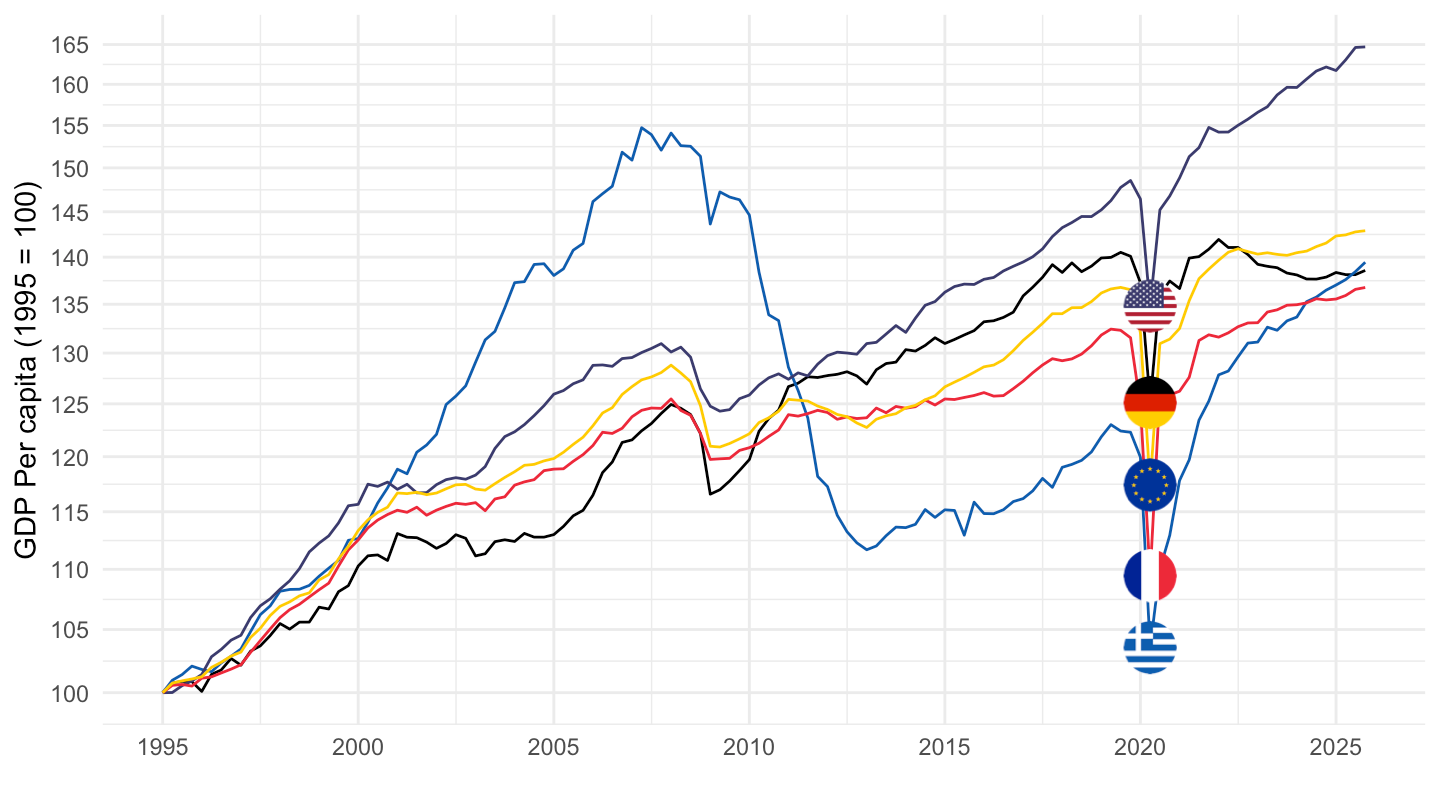
QNA_EXPENDITURE_CAPITA |>
  filter(REF_AREA %in% c("FRA", "DEU", "GRC", "EA20", "USA"),
         FREQ == "Q",
         PRICE_BASE == "LR") |>
  quarter_to_date() |>
  filter(date >= as.Date("2001-01-01")) |>
  mutate(Ref_area = ifelse(REF_AREA == "EA20", "Europe", Ref_area)) |>
  group_by(Ref_area) |>
  arrange(date) |>
  mutate(obsValue = 100 * obsValue / obsValue[date == as.Date("2008-01-01")]) |>
  add_flag_color("Ref_area") |>
  ggplot() + theme_minimal() + xlab("") + ylab("GDP Per capita (2008 = 100)") +
  geom_line(aes(x = date, y = obsValue, color = color)) + add_5flags +
  scale_color_identity() +
  scale_x_date(breaks = seq(1960, 2100, 2) |> paste0("-01-01") |> as.Date(),
               labels = date_format("%Y")) +
  theme(legend.position = "none") +
  scale_y_log10(breaks = seq(50, 200, 5))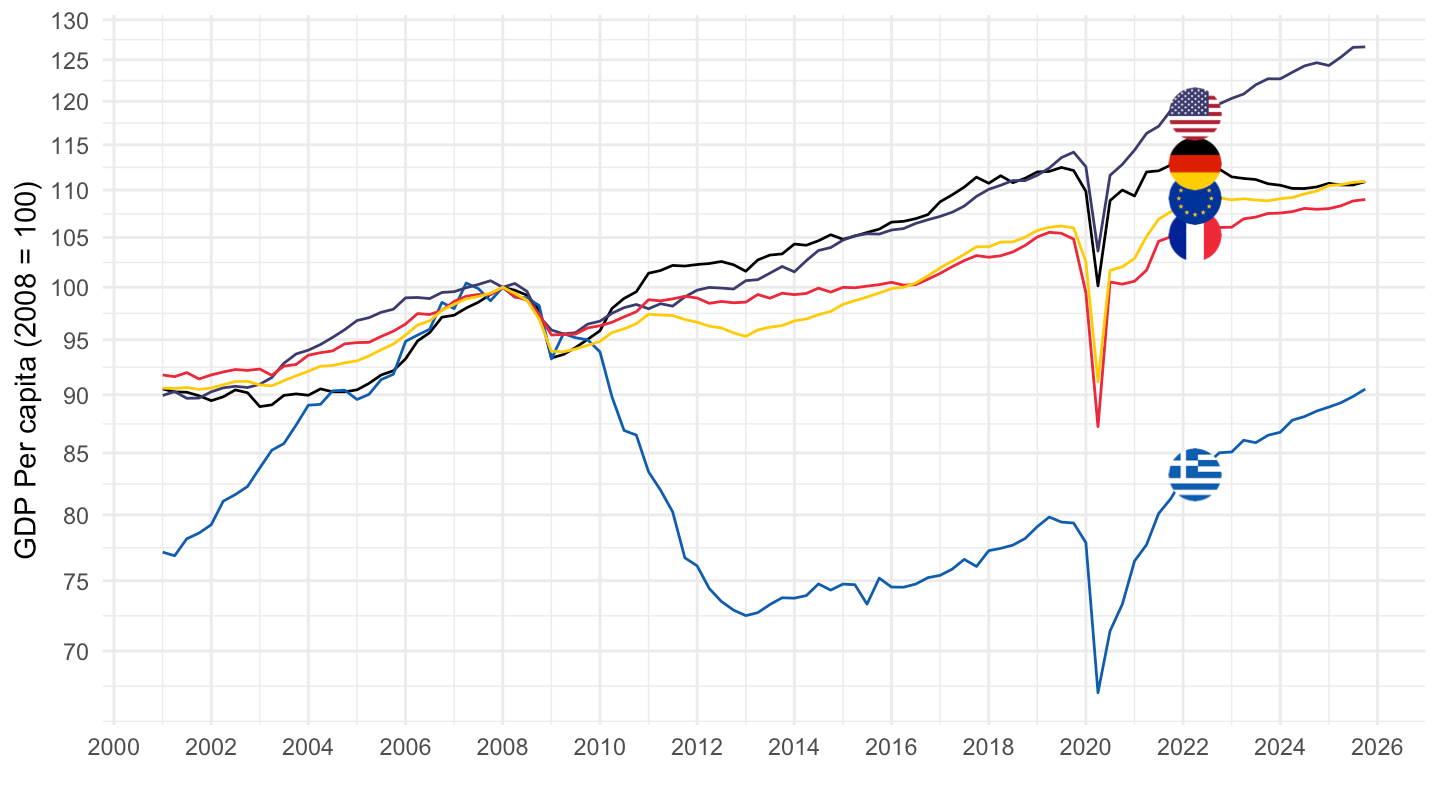
QNA_EXPENDITURE_CAPITA |>
  filter(REF_AREA %in% c("FRA", "DEU", "GRC", "EA20", "USA"),
         FREQ == "Q",
         PRICE_BASE == "LR") |>
  quarter_to_date() |>
  filter(date >= as.Date("2001-01-01")) |>
  mutate(Ref_area = ifelse(REF_AREA == "EA20", "Europe", Ref_area)) |>
  group_by(Ref_area) |>
  arrange(date) |>
  mutate(obsValue = 100 * obsValue / obsValue[date == as.Date("2001-01-01")]) |>
  add_flag_color("Ref_area") |>
  ggplot() + theme_minimal() + xlab("") + ylab("GDP Per capita (2001 = 100)") +
  geom_line(aes(x = date, y = obsValue, color = color)) + add_5flags +
  scale_color_identity() +
  scale_x_date(breaks = seq(1960, 2100, 2) |> paste0("-01-01") |> as.Date(),
               labels = date_format("%Y")) +
  theme(legend.position = "none") +
  scale_y_log10(breaks = seq(50, 200, 5))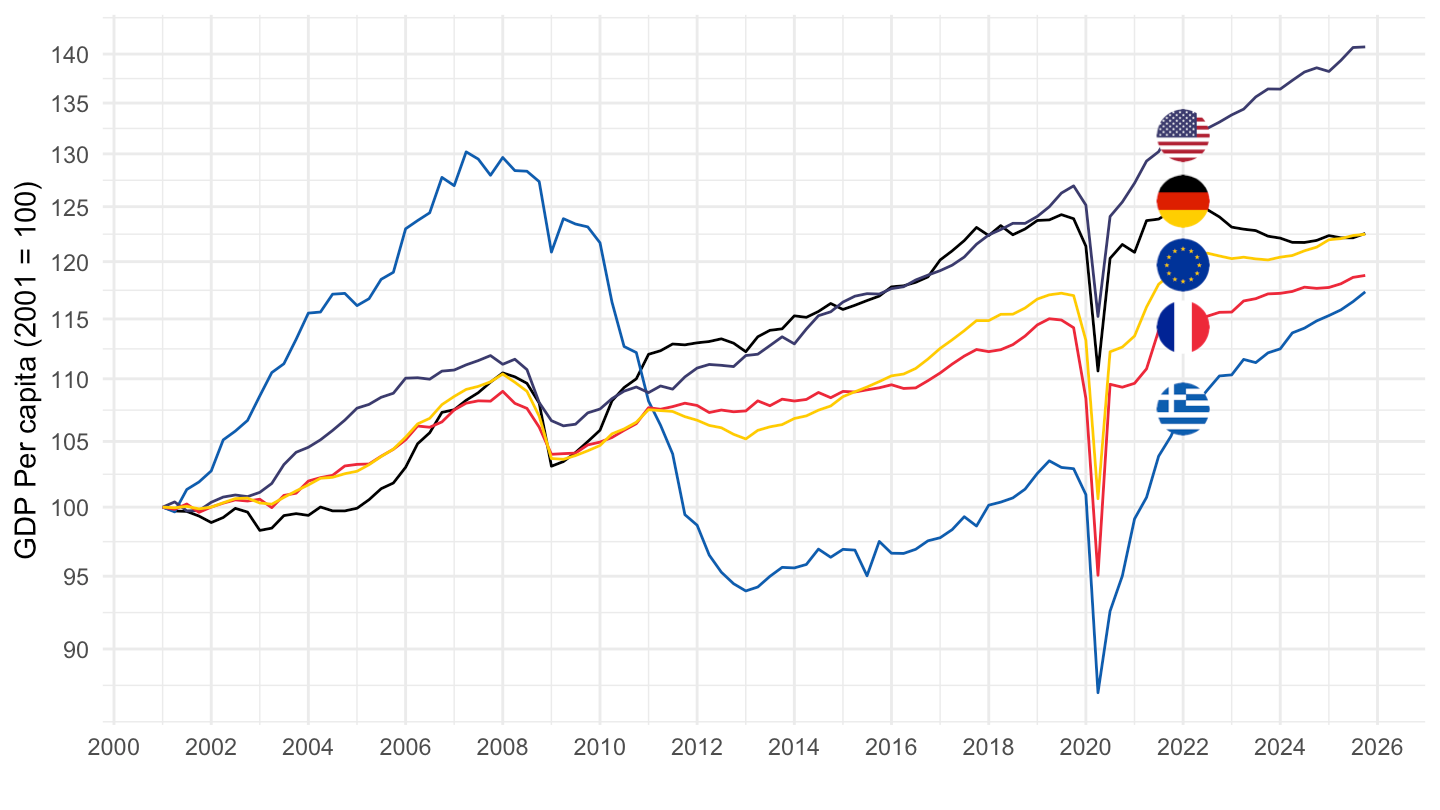
QNA_EXPENDITURE_CAPITA |>
  filter(REF_AREA %in% c("FRA", "DEU", "GRC", "EA20", "USA"),
         FREQ == "Q",
         PRICE_BASE == "LR") |>
  quarter_to_date() |>
  filter(date >= as.Date("2008-01-01")) |>
  mutate(Ref_area = ifelse(REF_AREA == "EA20", "Europe", Ref_area)) |>
  group_by(Ref_area) |>
  arrange(date) |>
  mutate(obsValue = 100 * obsValue / obsValue[date == as.Date("2008-01-01")]) |>
  add_flag_color("Ref_area") |>
  ggplot() + theme_minimal() + xlab("") + ylab("PIB par habitant (2008 = 100)") +
  geom_line(aes(x = date, y = obsValue, color = color)) + add_5flags +
  scale_color_identity() +
  scale_x_date(breaks = seq(1960, 2100, 2) |> paste0("-01-01") |> as.Date(),
               labels = date_format("%Y")) +
  theme(legend.position = "none") +
  scale_y_log10(breaks = seq(50, 200, 5))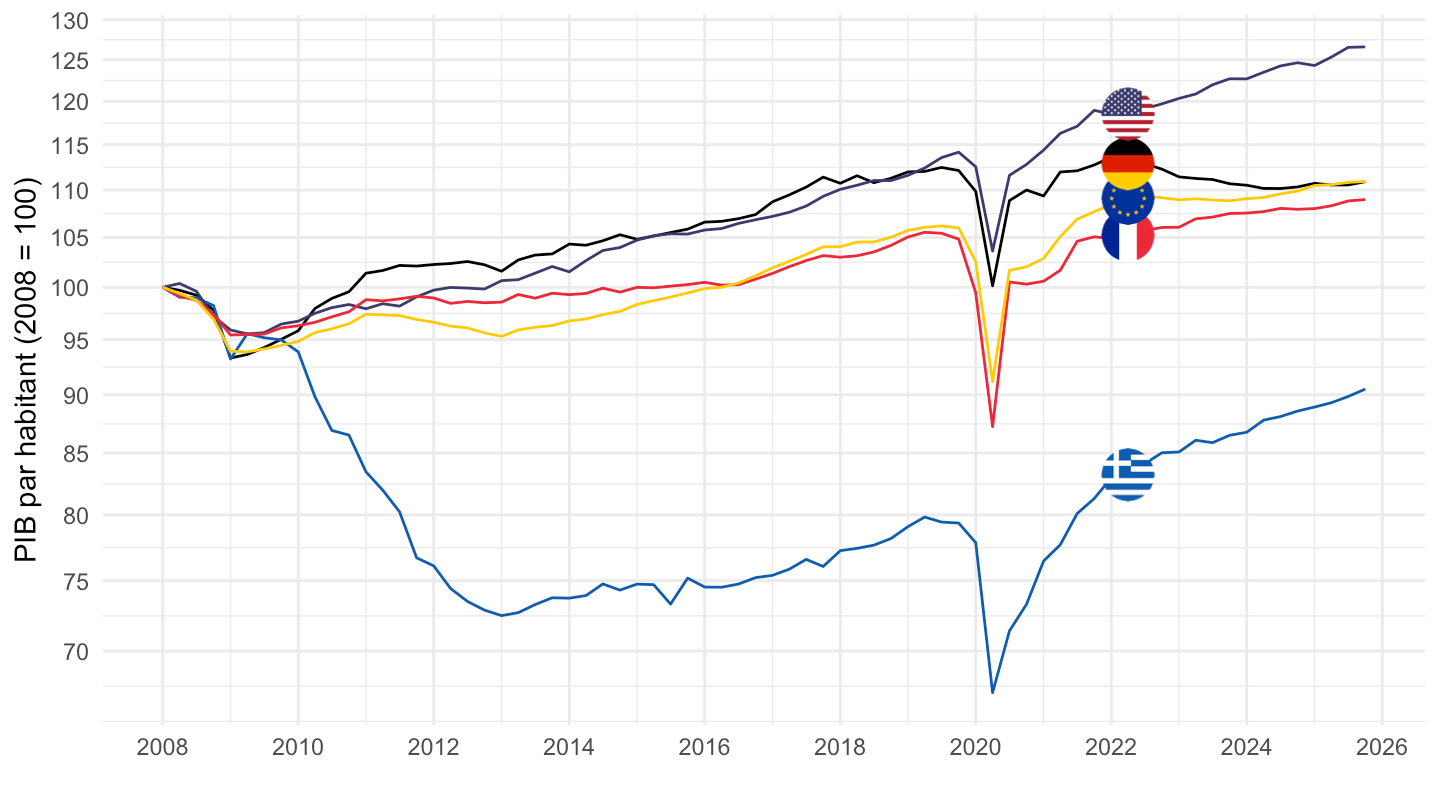
QNA_EXPENDITURE_CAPITA |>
  filter(REF_AREA %in% c("USA", "EA20", "FRA", "DEU"),
         FREQ == "Q",
         PRICE_BASE == "LR") |>
  quarter_to_date() |>
  mutate(Ref_area = ifelse(REF_AREA == "EA20", "Europe", Ref_area)) |>
  group_by(Ref_area) |>
  arrange(date) |>
  mutate(obsValue = 100 * obsValue / obsValue[1]) |>
  add_flag_color("Ref_area") |>
  ggplot() + theme_minimal() + xlab("") + ylab("PIB par habitant (1995 = 100)") +
  geom_line(aes(x = date, y = obsValue, color = color)) + add_4flags +
  scale_color_identity() +
  scale_x_date(breaks = seq(1900, 2100, 5) |> paste0("-01-01") |> as.Date(),
               labels = date_format("%Y")) +
  theme(legend.position = "none") +
  scale_y_log10(breaks = seq(100, 1000, 20))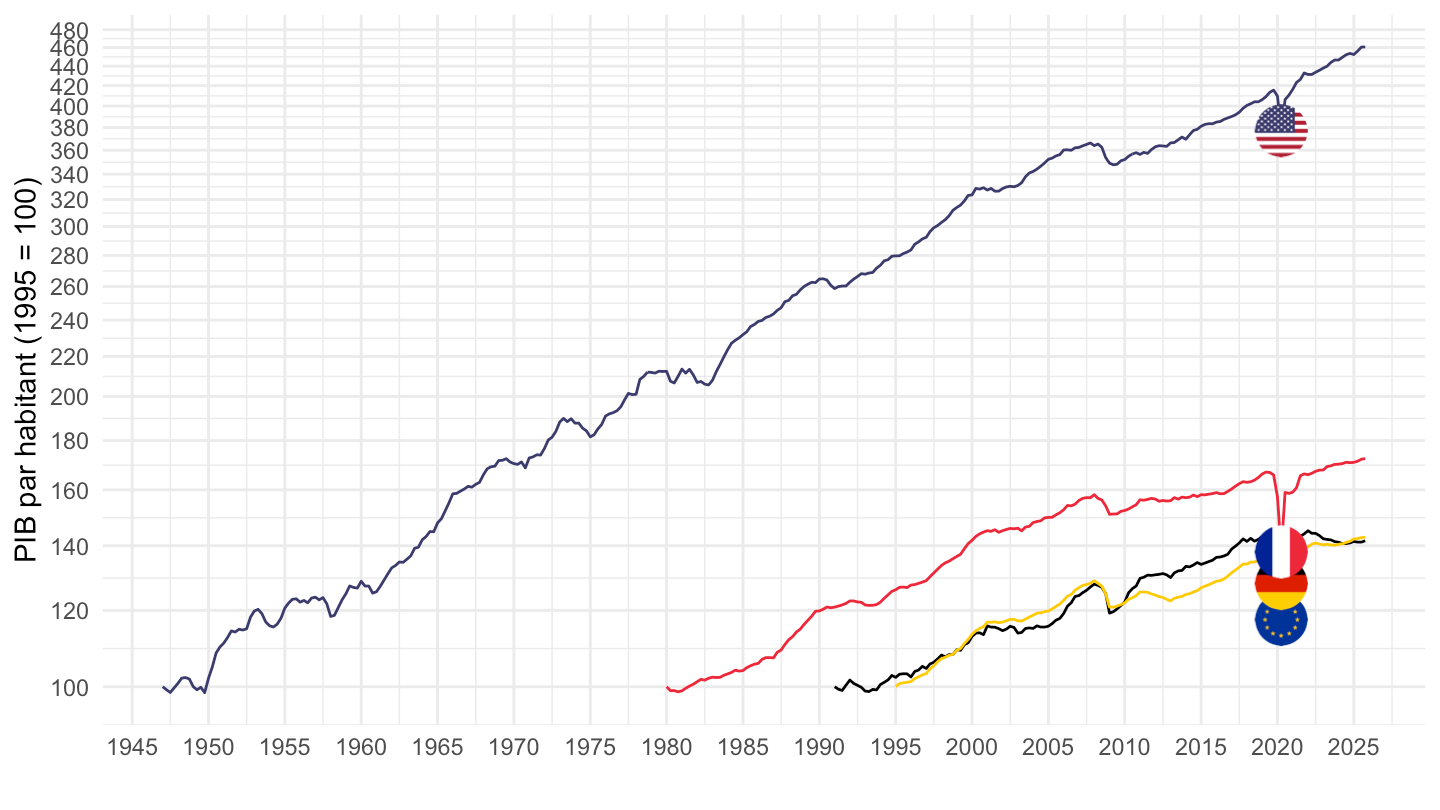
QNA_EXPENDITURE_CAPITA |>
  filter(REF_AREA %in% c("USA", "EA20", "FRA", "DEU"),
         FREQ == "Q",
         PRICE_BASE == "LR") |>
  quarter_to_date() |>
  filter(date >= as.Date("1995-01-01")) |>
  mutate(Ref_area = ifelse(REF_AREA == "EA20", "Europe", Ref_area)) |>
  group_by(Ref_area) |>
  arrange(date) |>
  mutate(obsValue = 100 * obsValue / obsValue[1]) |>
  add_flag_color("Ref_area") |>
  ggplot() + theme_minimal() + xlab("") + ylab("PIB par habitant (1995 = 100)") +
  geom_line(aes(x = date, y = obsValue, color = color)) + add_4flags +
  scale_color_identity() +
  scale_x_date(breaks = seq(1960, 2100, 2) |> paste0("-01-01") |> as.Date(),
               labels = date_format("%Y")) +
  theme(legend.position = "none") +
  scale_y_log10(breaks = seq(50, 200, 5))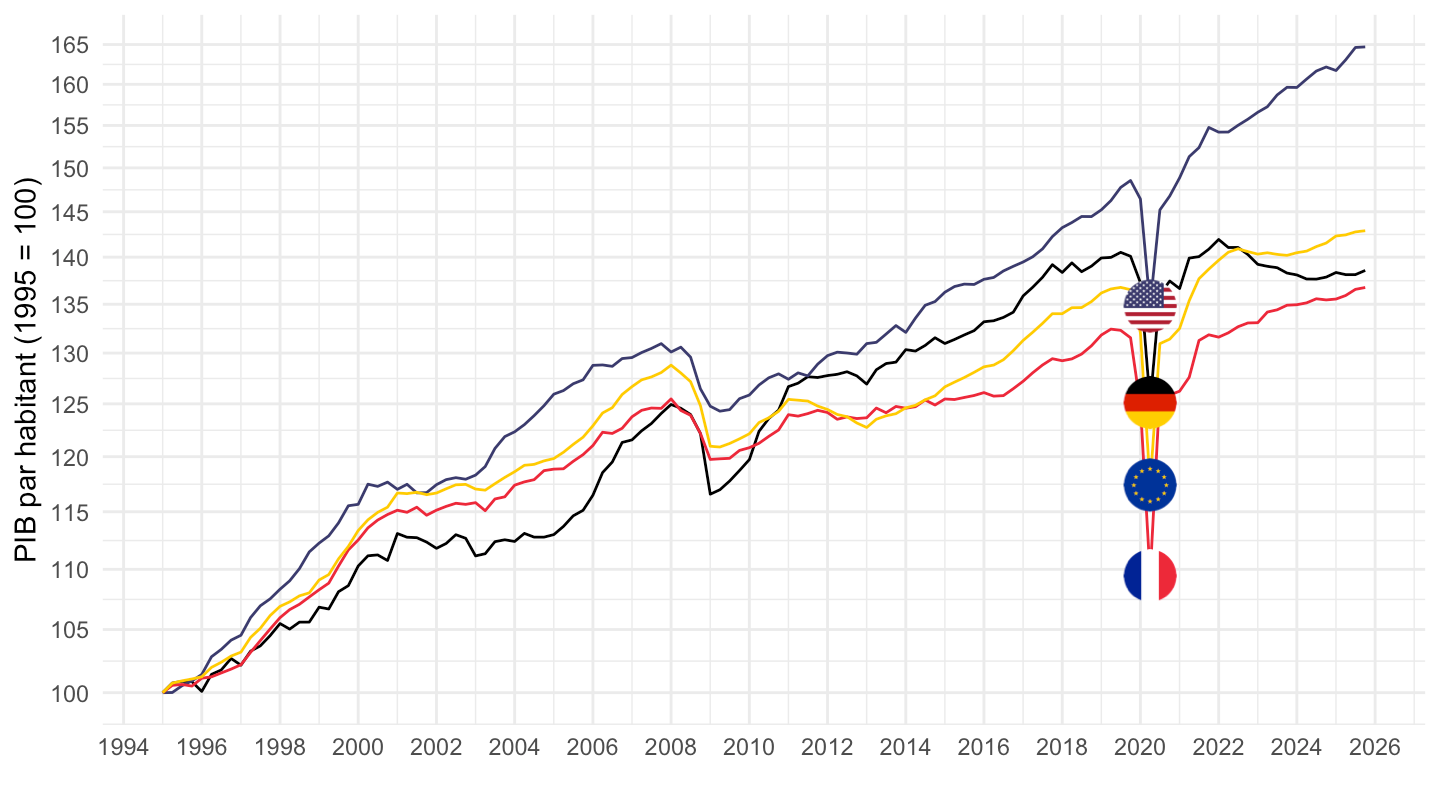
QNA_EXPENDITURE_CAPITA |>
  filter(REF_AREA %in% c("USA", "EA20", "FRA", "ITA"),
         FREQ == "Q",
         PRICE_BASE == "LR") |>
  quarter_to_date() |>
  mutate(Ref_area = ifelse(REF_AREA == "EA20", "Europe", Ref_area)) |>
  group_by(Ref_area) |>
  arrange(date) |>
  mutate(obsValue = 100 * obsValue / obsValue[1]) |>
  add_flag_color("Ref_area") |>
  ggplot() + theme_minimal() + xlab("") + ylab("PIB par habitant") +
  geom_line(aes(x = date, y = obsValue, color = color)) + add_4flags +
  scale_color_identity() +
  scale_x_date(breaks = seq(1900, 2100, 5) |> paste0("-01-01") |> as.Date(),
               labels = date_format("%Y")) +
  theme(legend.position = "none") +
  scale_y_log10(breaks = seq(100, 1000, 20))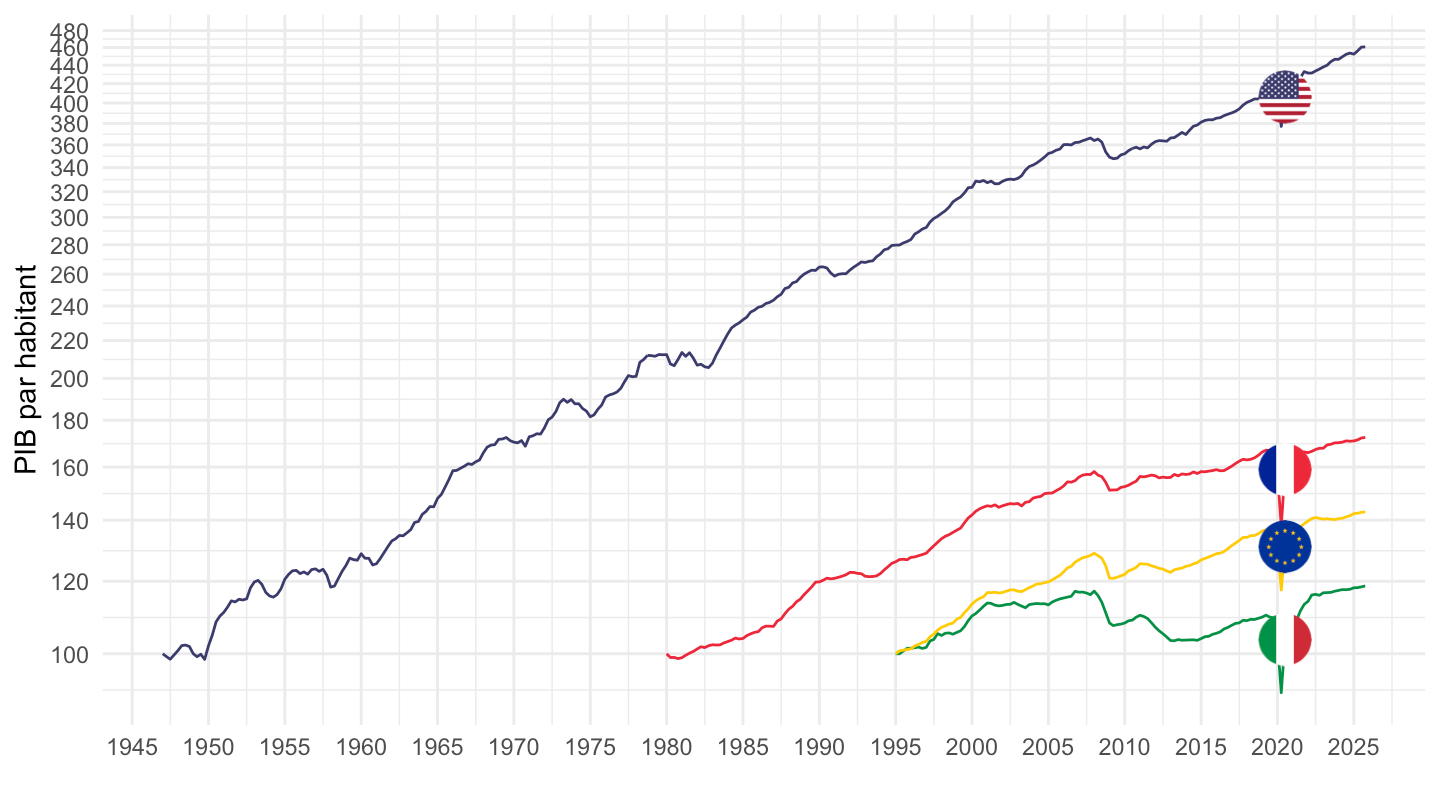
QNA_EXPENDITURE_CAPITA |>
  filter(REF_AREA %in% c("USA", "EA20", "FRA", "ITA"),
         FREQ == "Q",
         PRICE_BASE == "LR") |>
  quarter_to_date() |>
  filter(date >= as.Date("1995-01-01")) |>
  mutate(Ref_area = ifelse(REF_AREA == "EA20", "Europe", Ref_area)) |>
  group_by(Ref_area) |>
  arrange(date) |>
  mutate(obsValue = 100 * obsValue / obsValue[1]) |>
  add_flag_color("Ref_area") |>
  ggplot() + theme_minimal() + xlab("") + ylab("PIB par habitant (1995 = 100)") +
  geom_line(aes(x = date, y = obsValue, color = color)) + add_4flags +
  scale_color_identity() +
  scale_x_date(breaks = seq(1960, 2100, 2) |> paste0("-01-01") |> as.Date(),
               labels = date_format("%Y")) +
  theme(legend.position = "none") +
  scale_y_log10(breaks = seq(50, 200, 5))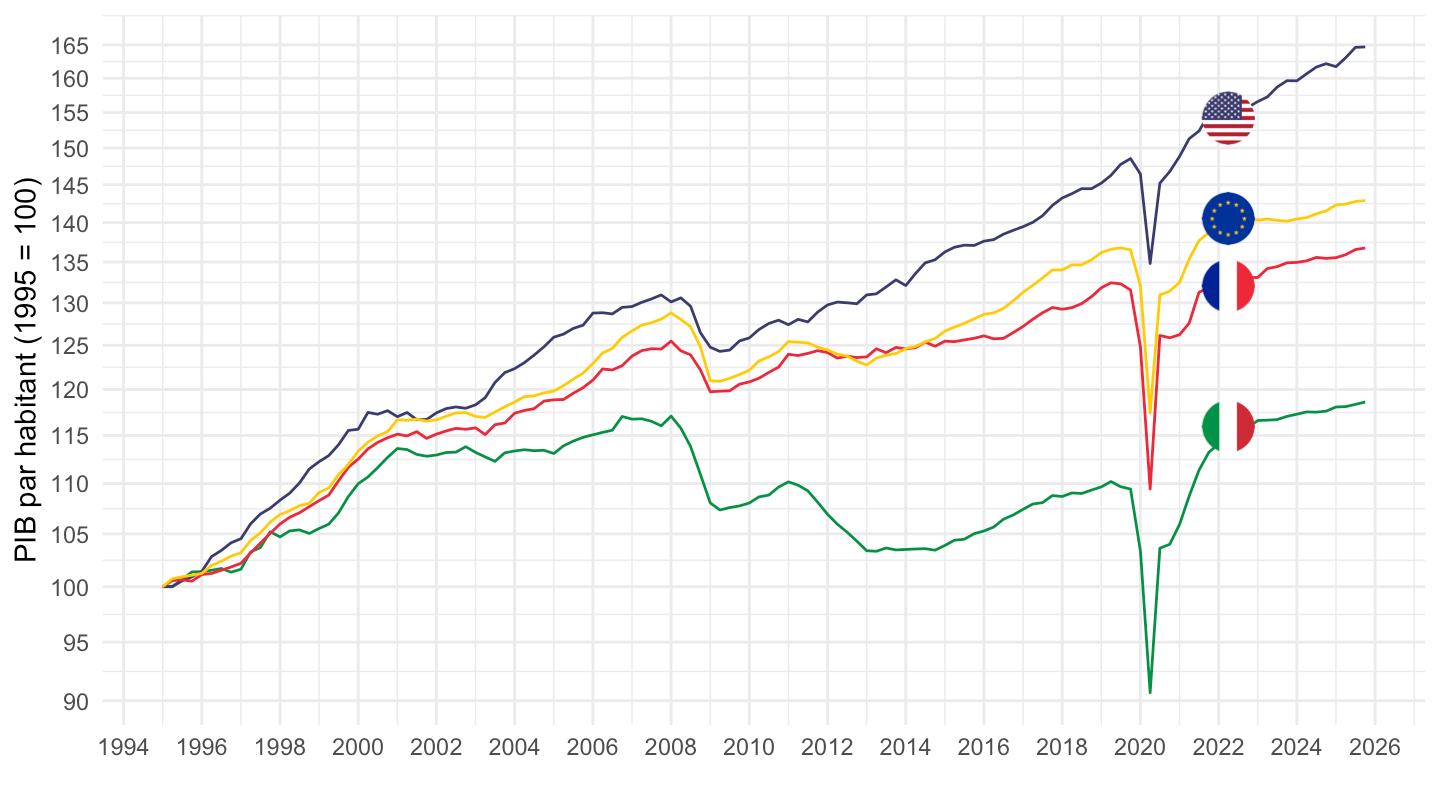
QNA_EXPENDITURE_CAPITA |>
  filter(REF_AREA %in% c("USA", "EA20", "FRA", "ITA"),
         FREQ == "Q",
         PRICE_BASE == "LR") |>
  quarter_to_date() |>
  filter(date >= as.Date("1999-01-01")) |>
  rename(Ref_area = Ref_area) |>
  mutate(Ref_area = ifelse(REF_AREA == "EA20", "Europe", Ref_area)) |>
  group_by(Ref_area) |>
  arrange(date) |>
  mutate(obsValue = 100 * obsValue / obsValue[1]) |>
  add_flag_color("Ref_area") |>
  ggplot() + theme_minimal() + xlab("") + ylab("PIB par habitant (1999 = 100)") +
  geom_line(aes(x = date, y = obsValue, color = color)) + add_4flags +
  scale_color_identity() +
  scale_x_date(breaks = c(seq(1999, 2100, 5), seq(1997, 2100, 5)) |> paste0("-01-01") |> as.Date(),
               labels = date_format("%Y")) +
  theme(legend.position = "none") +
  scale_y_log10(breaks = seq(50, 200, 5))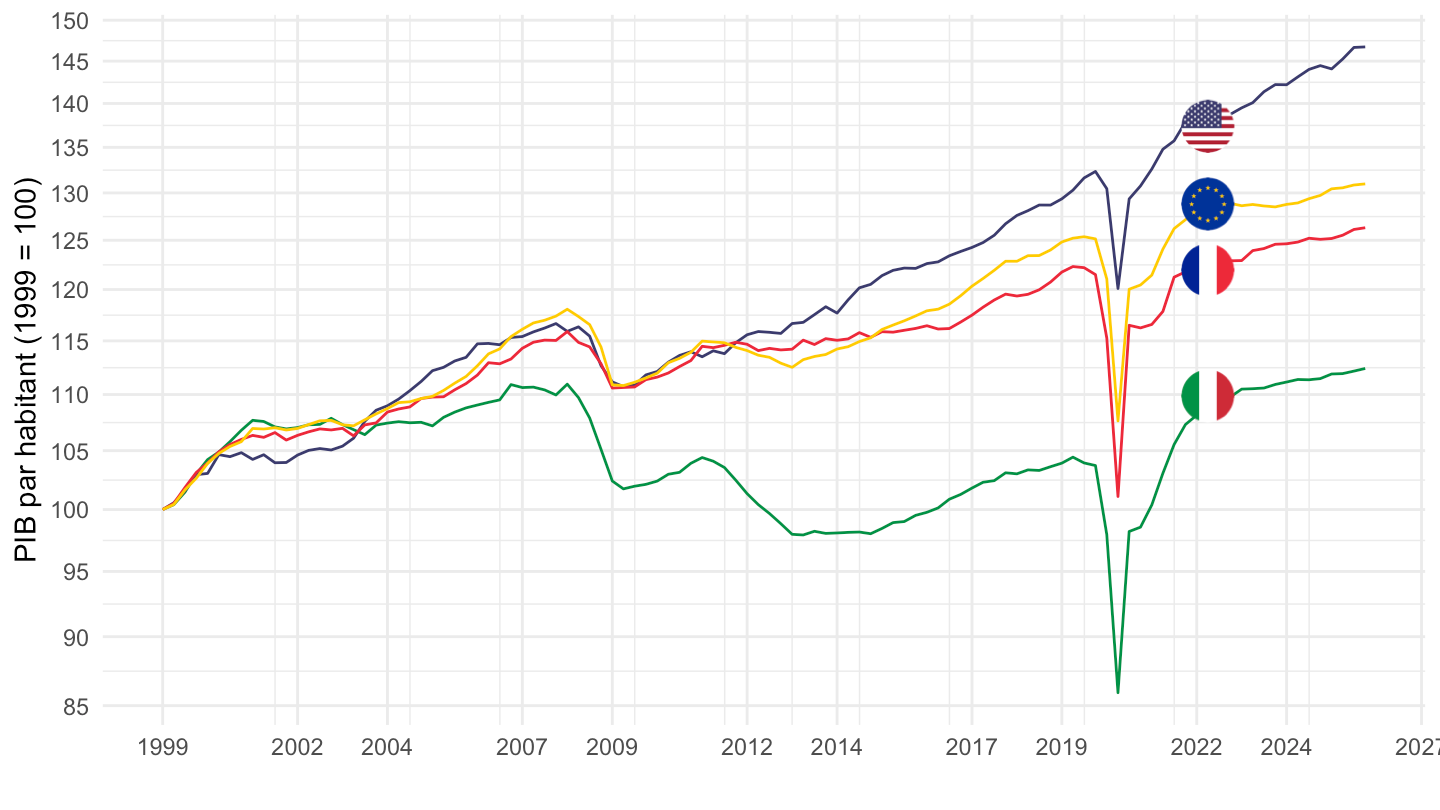
QNA_EXPENDITURE_CAPITA |>
  filter(REF_AREA %in% c("USA", "EA20", "FRA", "ITA"),
         FREQ == "Q",
         PRICE_BASE == "LR") |>
  quarter_to_date() |>
  filter(date >= as.Date("2000-01-01")) |>
  rename(Ref_area = Ref_area) |>
  mutate(Ref_area = ifelse(REF_AREA == "EA20", "Europe", Ref_area)) |>
  group_by(Ref_area) |>
  arrange(date) |>
  mutate(obsValue = 100 * obsValue / obsValue[1]) |>
  add_flag_color("Ref_area") |>
  ggplot() + theme_minimal() + xlab("") + ylab("PIB par habitant (2000 = 100)") +
  geom_line(aes(x = date, y = obsValue, color = color)) + add_4flags +
  scale_color_identity() +
  scale_x_date(breaks = seq(1960, 2100, 2) |> paste0("-01-01") |> as.Date(),
               labels = date_format("%Y")) +
  theme(legend.position = "none") +
  scale_y_log10(breaks = seq(50, 200, 5))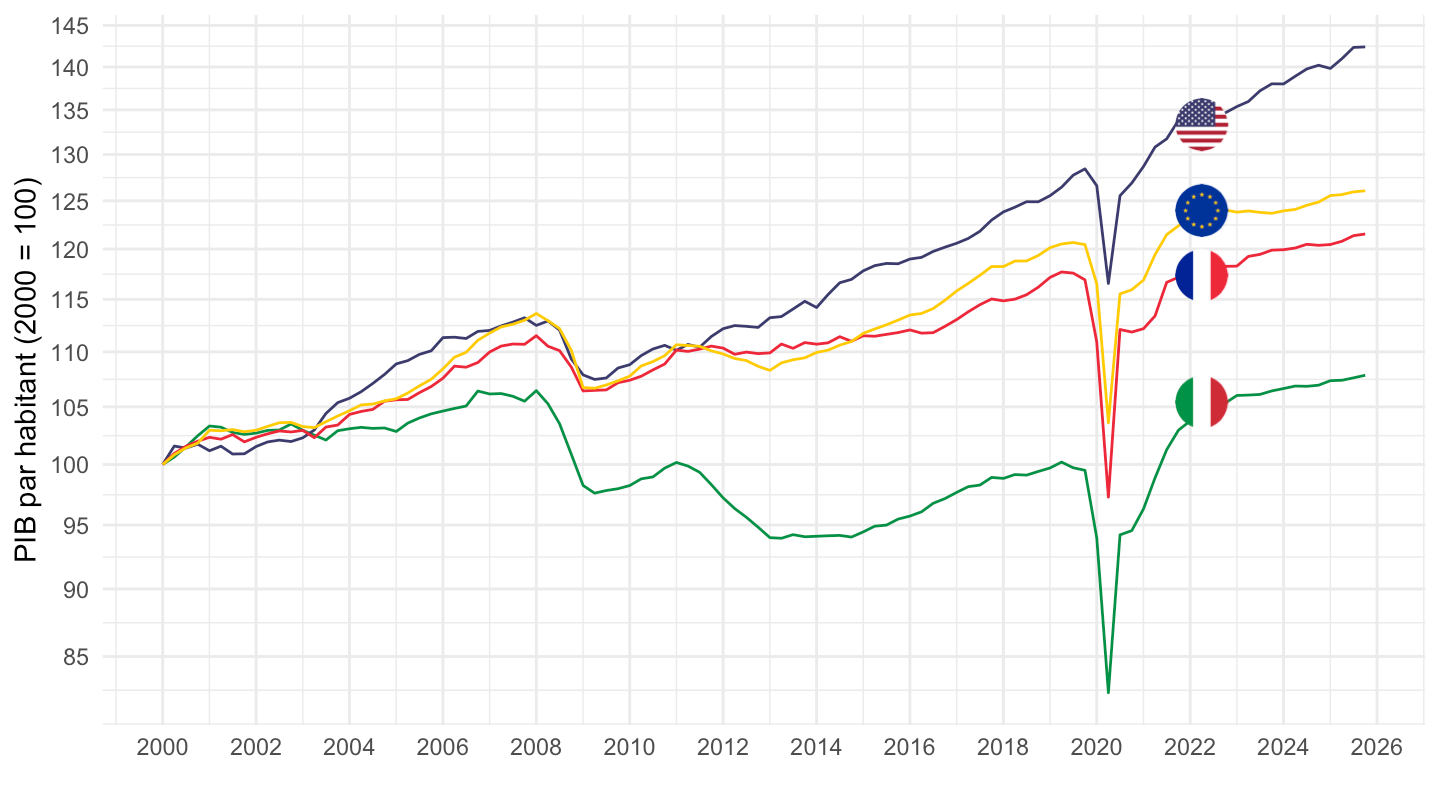
QNA_EXPENDITURE_CAPITA |>
  filter(REF_AREA %in% c("USA", "EA20", "FRA", "ITA", "DEU"),
         FREQ == "Q",
         PRICE_BASE == "LR") |>
  quarter_to_date() |>
  filter(date >= as.Date("2017-01-01")) |>
  rename(Ref_area = Ref_area) |>
  mutate(Ref_area = ifelse(REF_AREA == "EA20", "Europe", Ref_area)) |>
  group_by(Ref_area) |>
  arrange(date) |>
  mutate(obsValue = 100 * obsValue / obsValue[1]) |>
  add_flag_color("Ref_area") |>
  ggplot() + theme_minimal() + xlab("") + ylab("PIB par habitant (Janvier 2017 = 100)") +
  geom_line(aes(x = date, y = obsValue, color = color)) + add_flags +
  scale_color_identity() +
  scale_x_date(breaks = seq(1960, 2100, 1) |> paste0("-01-01") |> as.Date(),
               labels = date_format("%Y")) +
  theme(legend.position = "none") +
  scale_y_log10(breaks = seq(50, 200, 5))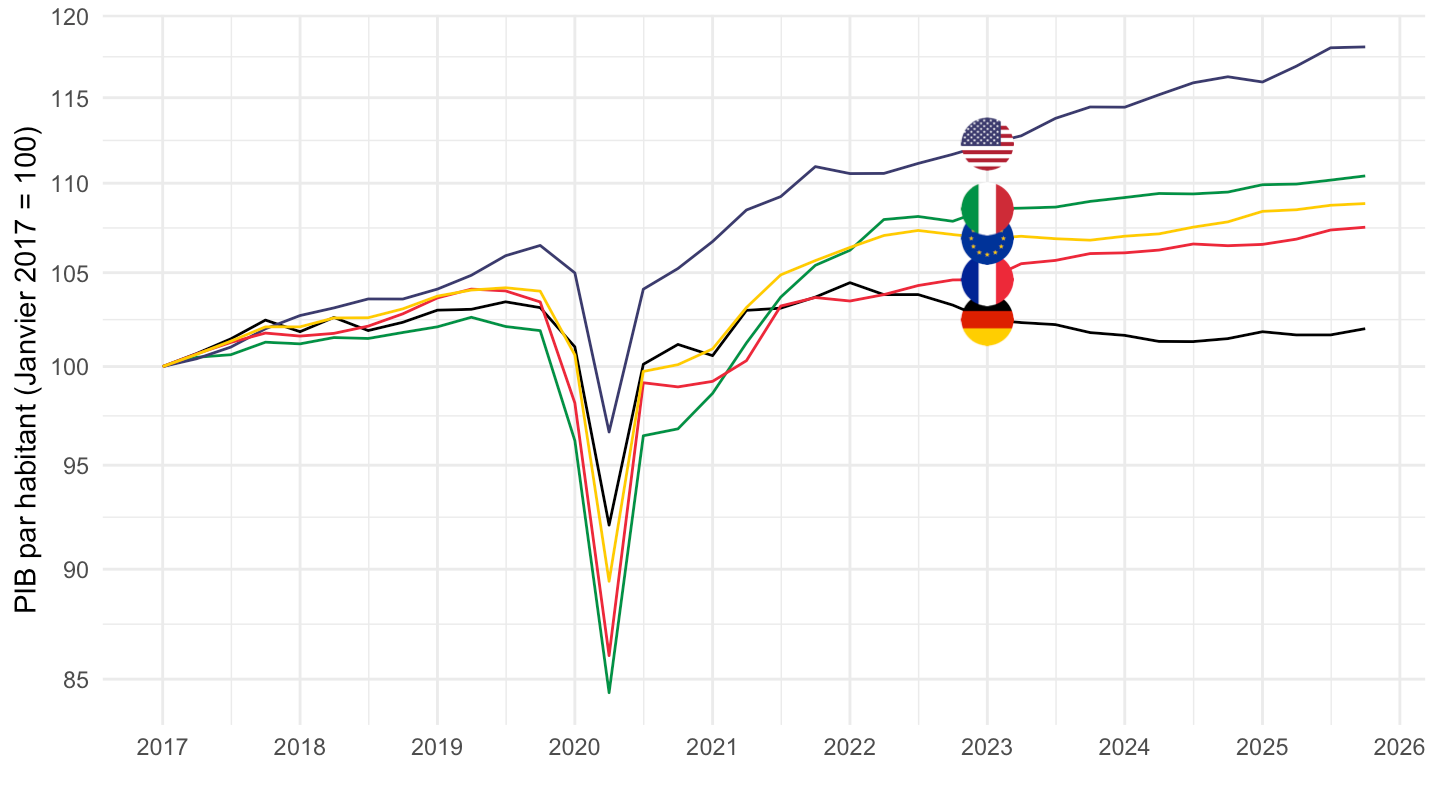
QNA_EXPENDITURE_CAPITA |>
  filter(REF_AREA %in% c("USA", "EA20", "FRA", "ITA"),
         FREQ == "Q",
         PRICE_BASE == "LR") |>
  quarter_to_date() |>
  filter(date >= as.Date("2017-04-01")) |>
  rename(Ref_area = Ref_area) |>
  mutate(Ref_area = ifelse(REF_AREA == "EA20", "Europe", Ref_area)) |>
  group_by(Ref_area) |>
  arrange(date) |>
  mutate(obsValue = 100 * obsValue / obsValue[1]) |>
  add_flag_color("Ref_area") |>
  ggplot() + theme_minimal() + xlab("") + ylab("PIB par habitant (Avril 2017 = 100)") +
  geom_line(aes(x = date, y = obsValue, color = color)) + add_4flags +
  scale_color_identity() +
  scale_x_date(breaks = seq(1960, 2100, 1) |> paste0("-01-01") |> as.Date(),
               labels = date_format("%Y")) +
  theme(legend.position = "none") +
  scale_y_log10(breaks = seq(50, 200, 5))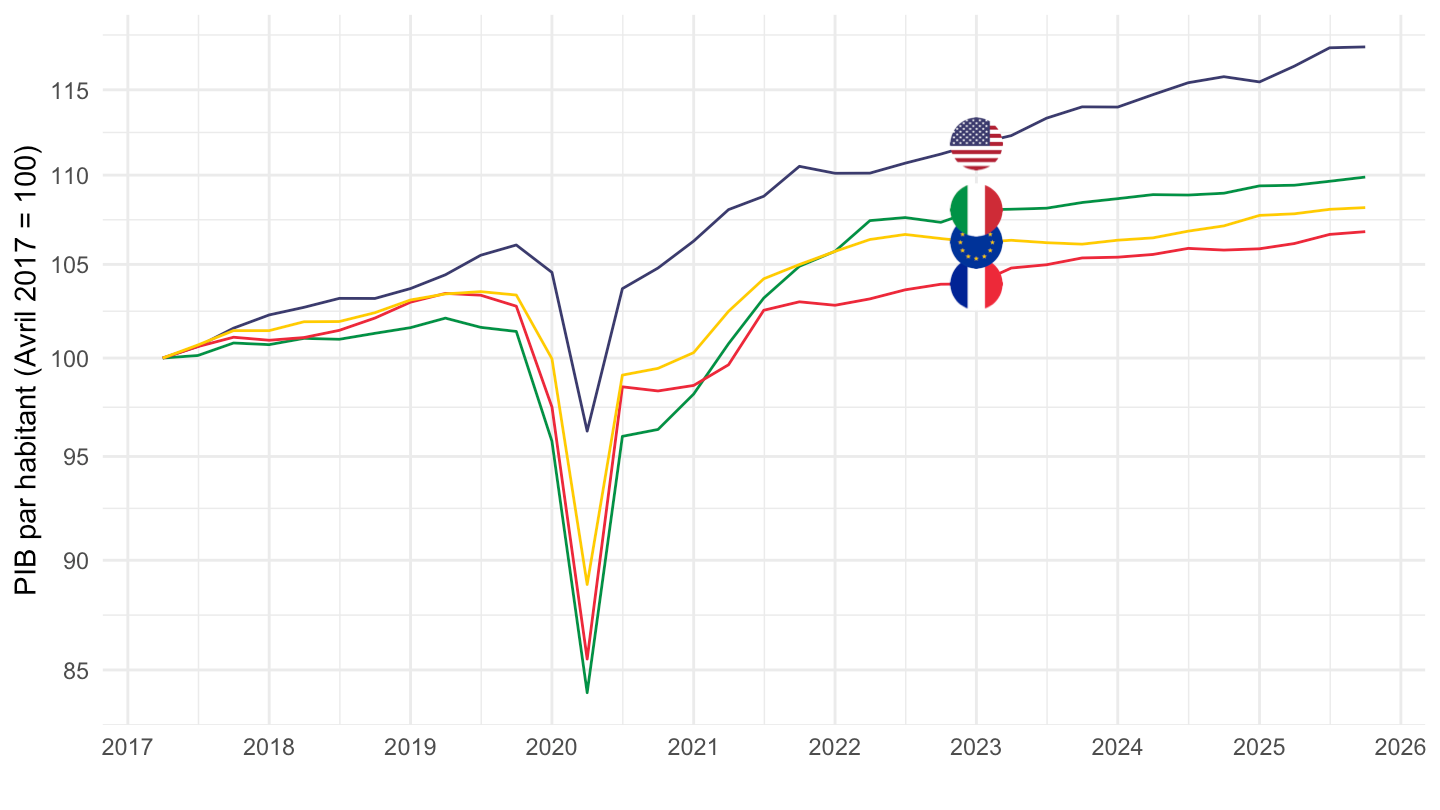
QNA_EXPENDITURE_CAPITA |>
  filter(REF_AREA %in% c("USA", "EA20", "ITA"),
         FREQ == "Q",
         PRICE_BASE == "LR") |>
  quarter_to_date() |>
  filter(date >= as.Date("1999-01-01")) |>
  rename(Ref_area = Ref_area) |>
  mutate(Ref_area = ifelse(REF_AREA == "EA20", "Europe", Ref_area)) |>
  group_by(Ref_area) |>
  arrange(date) |>
  mutate(obsValue = 100 * obsValue / obsValue[1]) |>
  add_flag_color("Ref_area") |>
  ggplot() + theme_minimal() + xlab("") + ylab("PIB par habitant (1999 = 100)") +
  geom_line(aes(x = date, y = obsValue, color = color)) + add_3flags +
  scale_color_identity() +
  scale_x_date(breaks = c(seq(1999, 2100, 5), seq(1997, 2100, 5)) |> paste0("-01-01") |> as.Date(),
               labels = date_format("%Y")) +
  theme(legend.position = "none") +
  scale_y_log10(breaks = seq(50, 200, 5))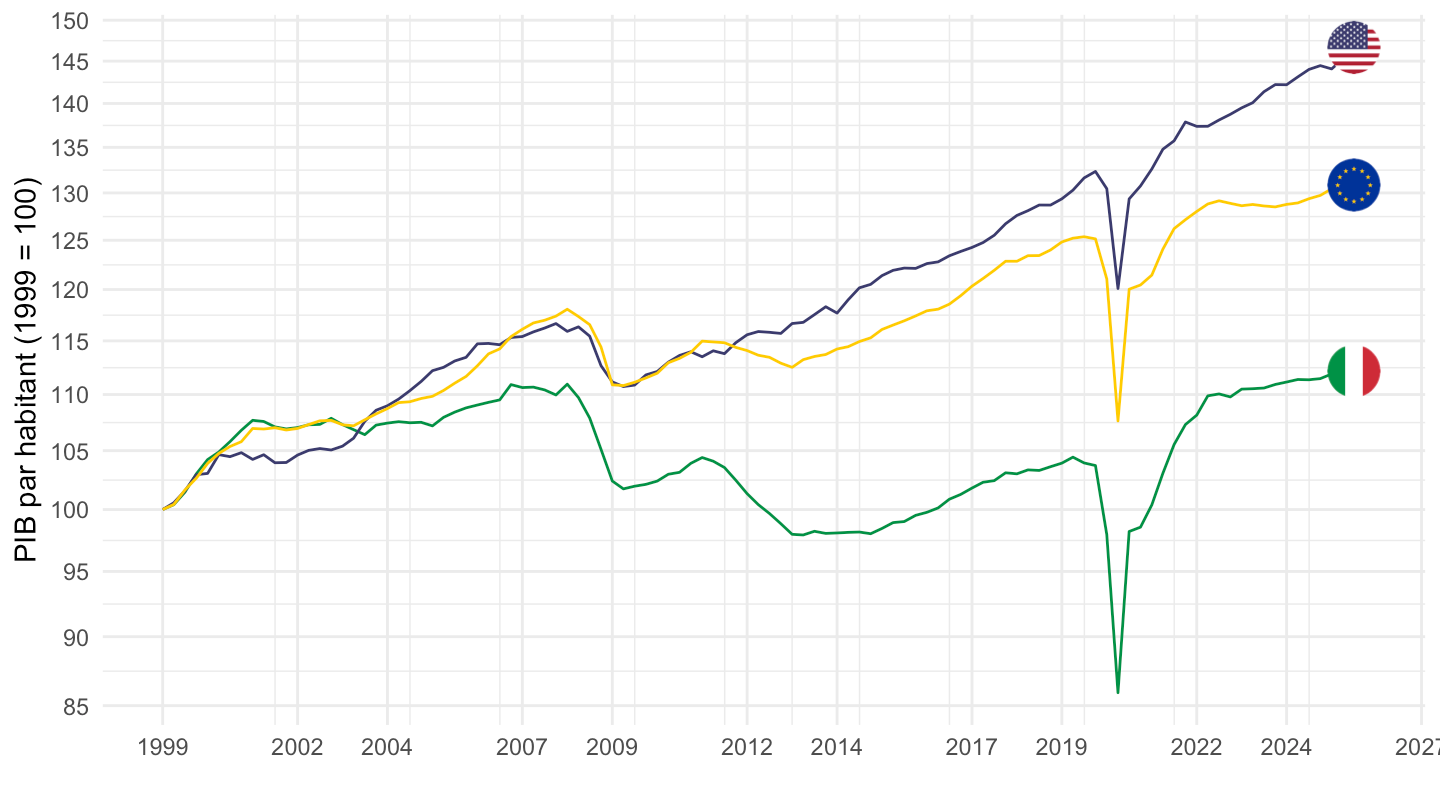
QNA_EXPENDITURE_CAPITA |>
  filter(REF_AREA %in% c("USA", "EA20"),
         FREQ == "Q",
         PRICE_BASE == "LR") |>
  quarter_to_date() |>
  filter(date >= as.Date("2000-01-01")) |>
  rename(Ref_area = Ref_area) |>
  mutate(Ref_area = ifelse(REF_AREA == "EA20", "Europe", Ref_area)) |>
  group_by(Ref_area) |>
  arrange(date) |>
  mutate(obsValue = 100 * obsValue / obsValue[1]) |>
  add_flag_color("Ref_area") |>
  ggplot() + theme_minimal() + xlab("") + ylab("PIB par habitant (2000 = 100)") +
  geom_line(aes(x = date, y = obsValue, color = color)) + add_2flags +
  scale_color_identity() +
  scale_x_date(breaks = c(seq(2000, 2100, 2)) |> paste0("-01-01") |> as.Date(),
               labels = date_format("%Y")) +
  theme(legend.position = "none") +
  scale_y_log10(breaks = seq(50, 200, 5))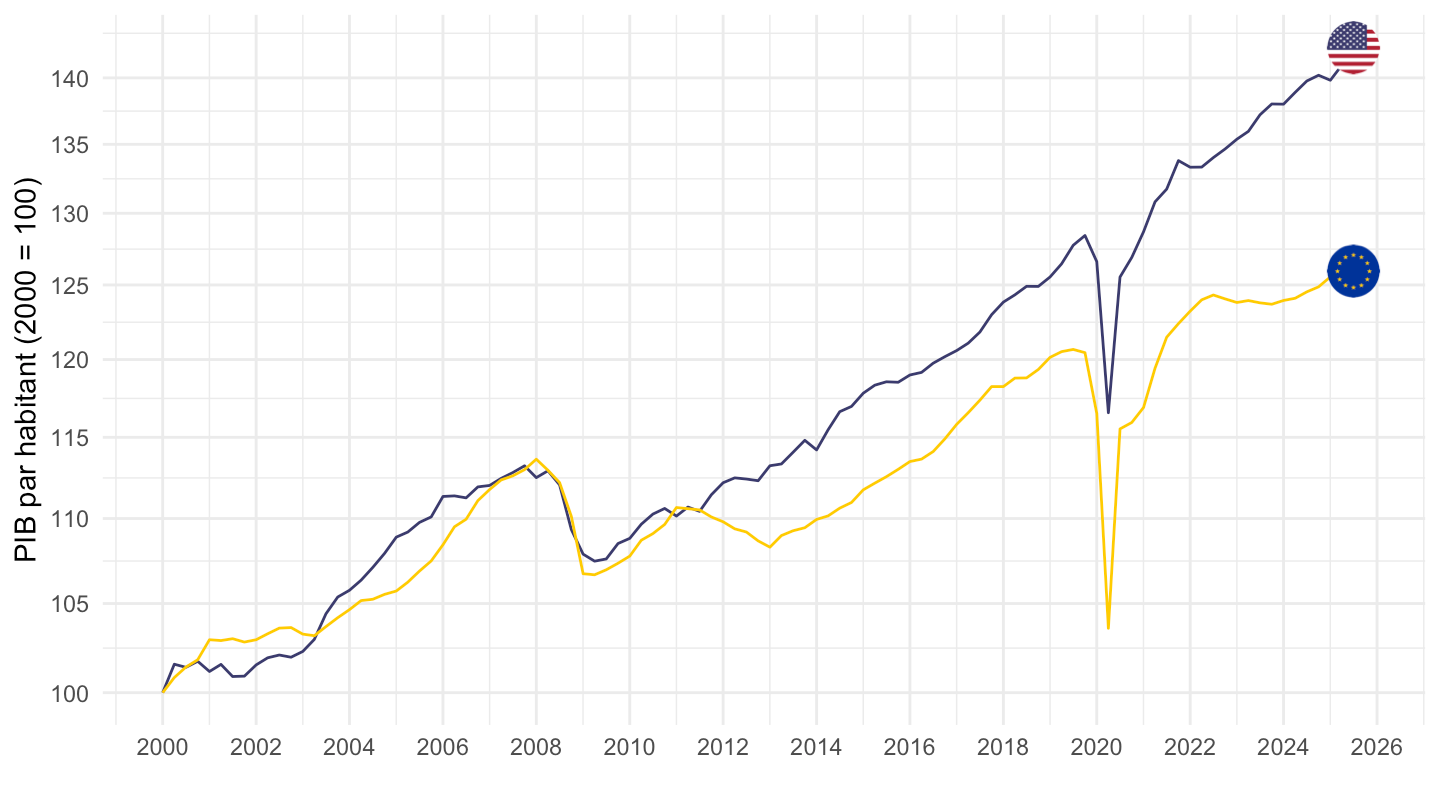
QNA_EXPENDITURE_CAPITA |>
  filter(REF_AREA %in% c("USA", "EA20"),
         FREQ == "Q",
         PRICE_BASE == "LR") |>
  quarter_to_date() |>
  filter(date >= as.Date("2000-01-01")) |>
  rename(Ref_area = Ref_area) |>
  mutate(Ref_area = ifelse(REF_AREA == "EA20", "Europe", Ref_area)) |>
  group_by(Ref_area) |>
  arrange(date) |>
  mutate(obsValue = 100 * obsValue / obsValue[1]) |>
  add_flag_color("Ref_area") |>
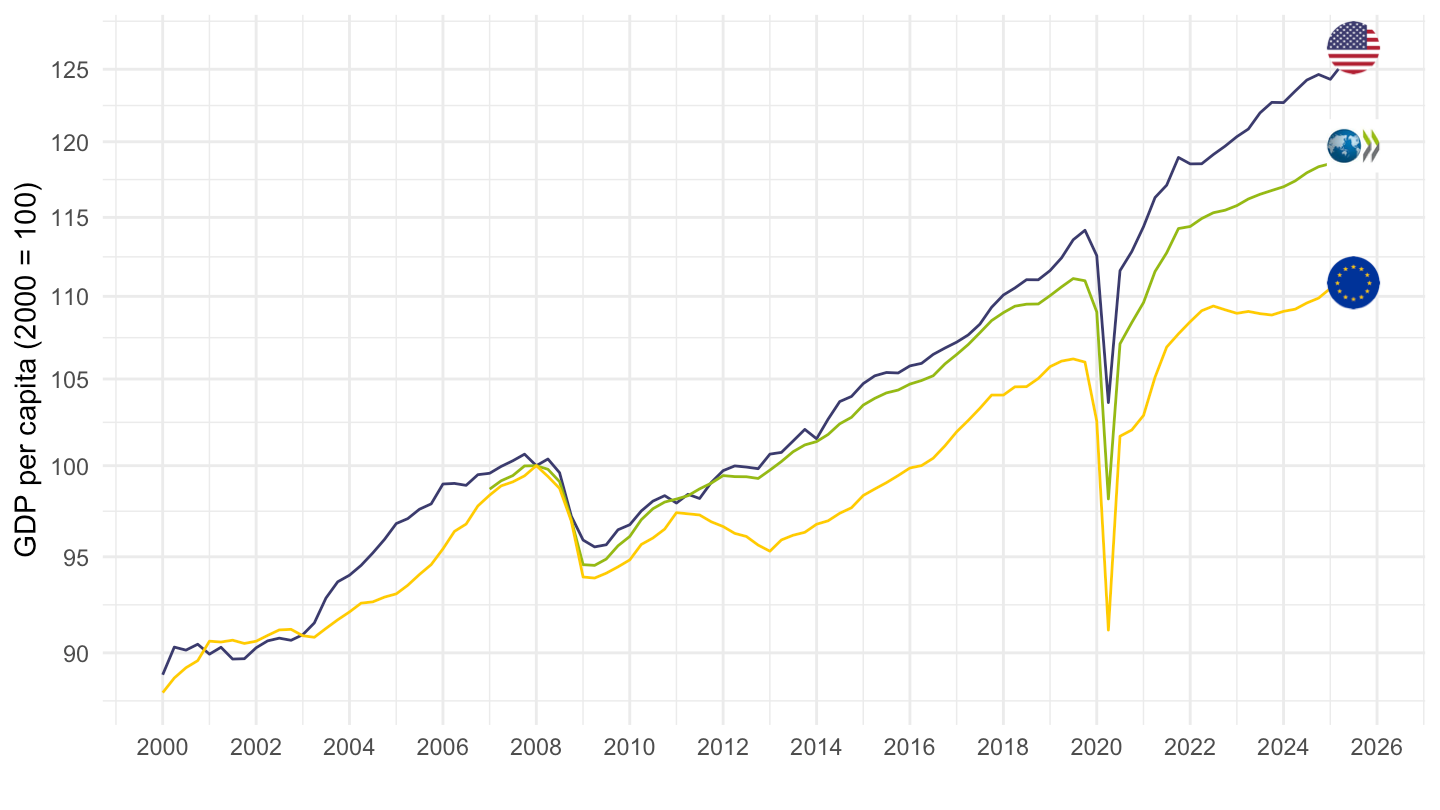
  ggplot() + theme_minimal() + xlab("") + ylab("GDP per capita (2000 = 100)") +
  geom_line(aes(x = date, y = obsValue, color = color)) + add_2flags +
  scale_color_identity() +
  scale_x_date(breaks = c(seq(2000, 2100, 2)) |> paste0("-01-01") |> as.Date(),
               labels = date_format("%Y")) +
  theme(legend.position = "none") +
  scale_y_log10(breaks = seq(50, 200, 5))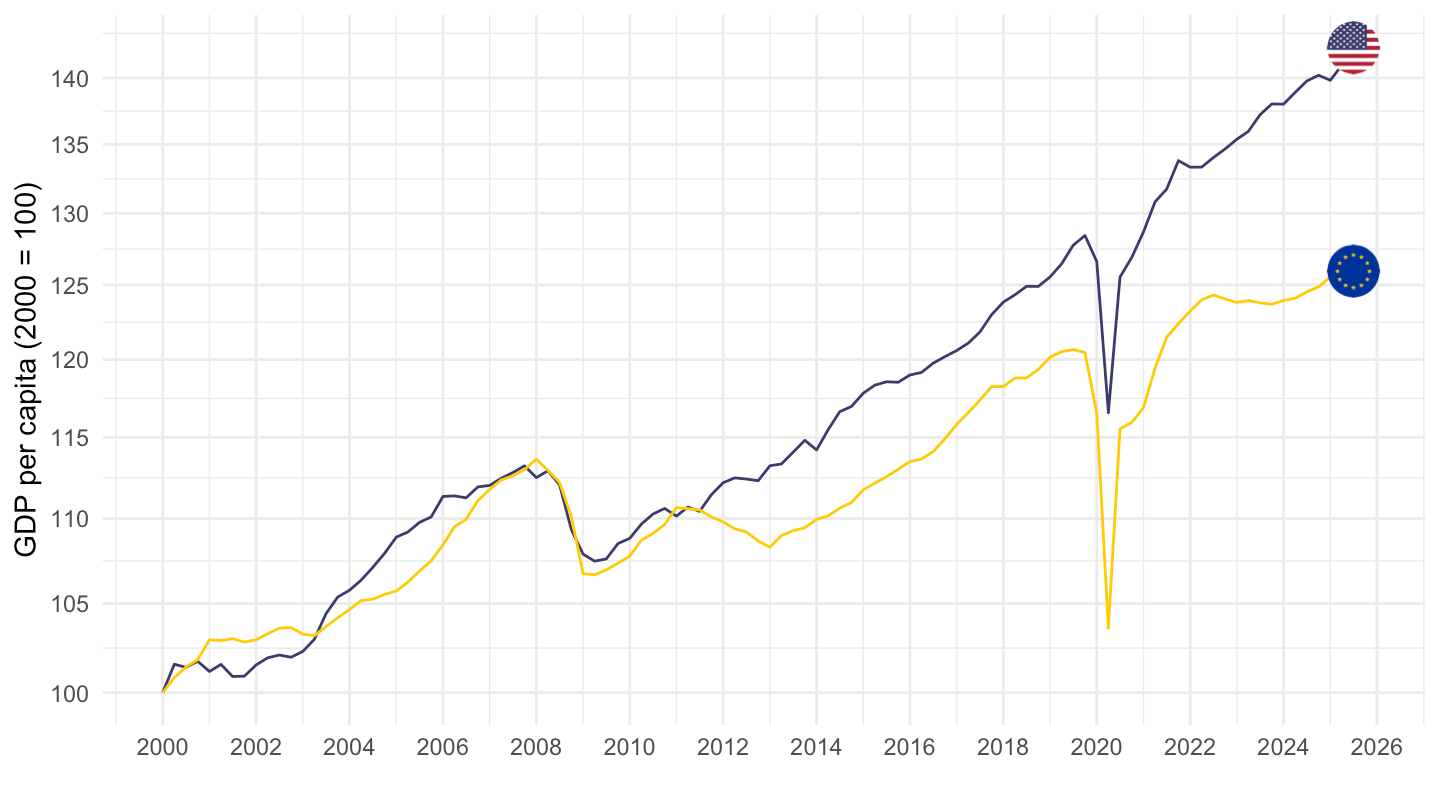
QNA_EXPENDITURE_CAPITA |>
  filter(REF_AREA %in% c("USA", "EA20", "GRC", "ESP"),
         FREQ == "Q",
         PRICE_BASE == "LR") |>
  quarter_to_date() |>
  filter(date >= as.Date("2000-01-01")) |>
  rename(Ref_area = Ref_area) |>
  mutate(Ref_area = ifelse(REF_AREA == "EA20", "Europe", Ref_area),
         Ref_area = ifelse(REF_AREA == "OECD", "OECD members", Ref_area)) |>
  group_by(Ref_area) |>
  arrange(date) |>
  mutate(obsValue = 100 * obsValue / obsValue[date == as.Date("2008-01-01")]) |>
  add_flag_color("Ref_area") |>
  ggplot() + theme_minimal() + xlab("") + ylab("GDP per capita (2000 = 100)") +
  geom_line(aes(x = date, y = obsValue, color = color)) + add_4flags +
  scale_color_identity() +
  scale_x_date(breaks = c(seq(2000, 2100, 2)) |> paste0("-01-01") |> as.Date(),
               labels = date_format("%Y")) +
  theme(legend.position = "none") +
  scale_y_log10(breaks = seq(50, 200, 5))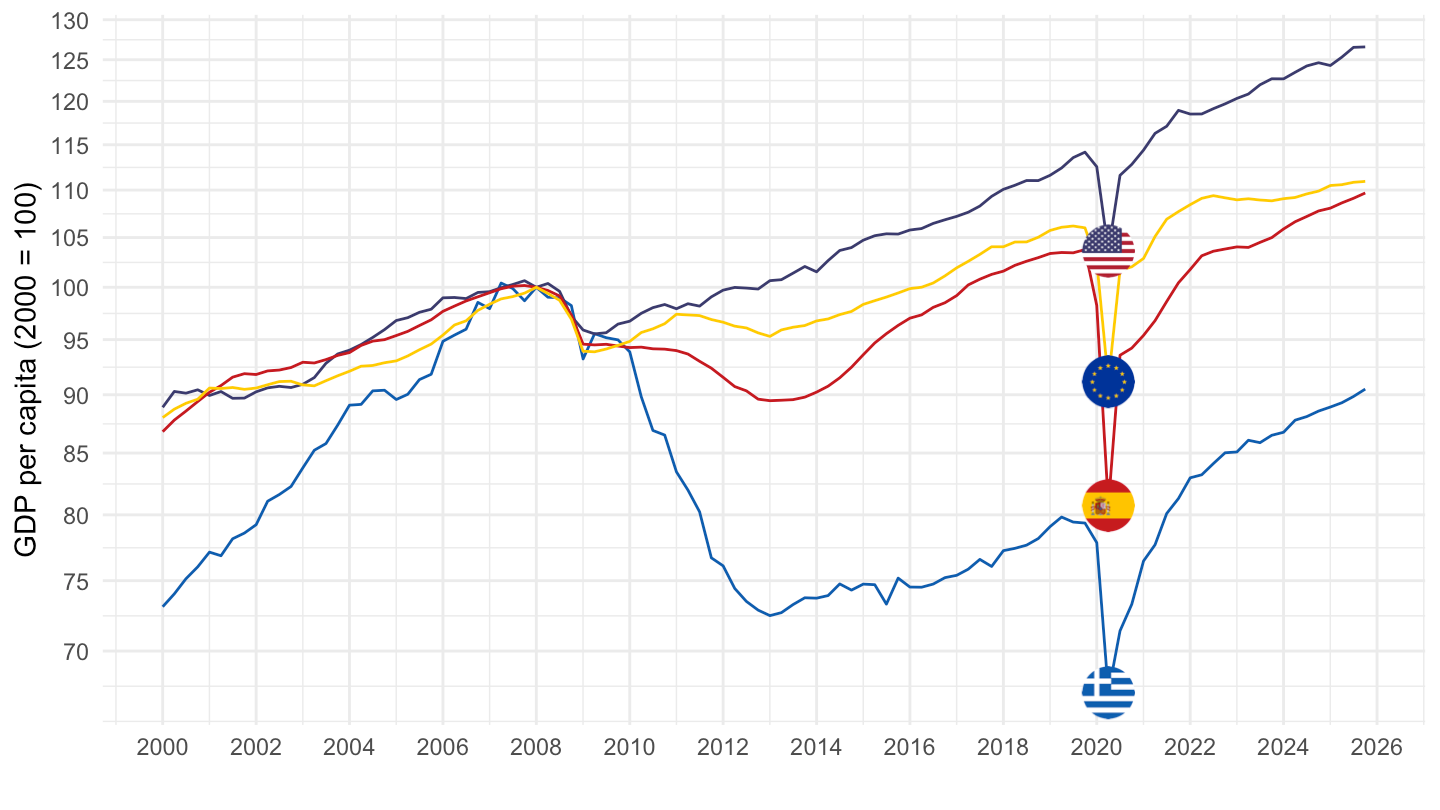
QNA_EXPENDITURE_CAPITA |>
  filter(REF_AREA %in% c("USA", "EA20", "OECD"),
         FREQ == "Q",
         PRICE_BASE == "LR") |>
  quarter_to_date() |>
  filter(date >= as.Date("2000-01-01")) |>
  rename(Ref_area = Ref_area) |>
  mutate(Ref_area = ifelse(REF_AREA == "EA20", "Europe", Ref_area),
         Ref_area = ifelse(REF_AREA == "OECD", "OECD members", Ref_area)) |>
  group_by(Ref_area) |>
  arrange(date) |>
  mutate(obsValue = 100 * obsValue / obsValue[date == as.Date("2008-01-01")]) |>
  add_flag_color("Ref_area") |>
  ggplot() + theme_minimal() + xlab("") + ylab("GDP per capita (2000 = 100)") +
  geom_line(aes(x = date, y = obsValue, color = color)) + add_3flags +
  scale_color_identity() +
  scale_x_date(breaks = c(seq(2000, 2100, 2)) |> paste0("-01-01") |> as.Date(),
               labels = date_format("%Y")) +
  theme(legend.position = "none") +
  scale_y_log10(breaks = seq(50, 200, 5))