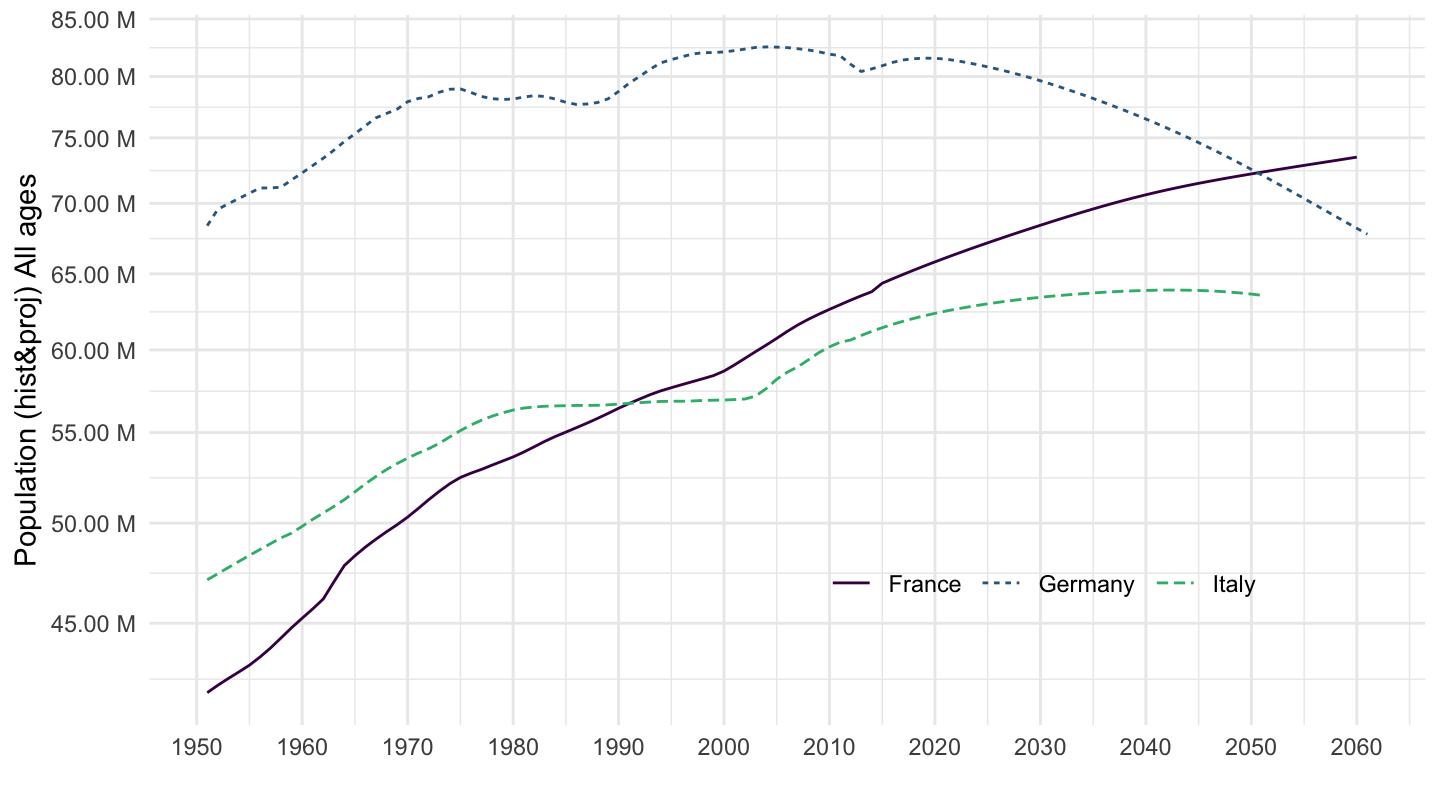
Historical population data and projections (1950-2050) - POP_PROJ

Data - OECD

Nobs - Javascript

Code
POP_PROJ %>%
  left_join(POP_PROJ_var$SEX %>%
              setNames(c("SEX", "Sex")), by = "SEX") %>%
  left_join(POP_PROJ_var$AGE %>%
              setNames(c("AGE", "Age")), by = "AGE") %>%
  group_by(SEX, Sex, AGE, Age) %>%
  summarise(Nobs = n()) %>%
  arrange(-Nobs) %>%
  {if (is_html_output()) datatable(., filter = 'top', rownames = F) else .}

SEX

Code
POP_PROJ %>%
  left_join(POP_PROJ_var$SEX %>%
              setNames(c("SEX", "Sex")), by = "SEX") %>%
  group_by(SEX, Sex) %>%
  summarise(Nobs = n()) %>%
  arrange(-Nobs) %>%
  {if (is_html_output()) print_table(.) else .}
SEX Sex Nobs
TT All persons 208753
FE Females 132884
MA Males 132703

AGE

Code
POP_PROJ %>%
  left_join(POP_PROJ_var$AGE %>%
              setNames(c("AGE", "Age")), by = "AGE") %>%
  group_by(AGE, Age) %>%
  summarise(Nobs = n()) %>%
  {if (is_html_output()) datatable(., filter = 'top', rownames = F) else .}

LOCATION

Code
POP_PROJ %>%
  left_join(POP_PROJ_var$LOCATION %>%
              setNames(c("LOCATION", "Location")), by = "LOCATION") %>%
  group_by(LOCATION, Location) %>%
  summarise(Nobs = n()) %>%
  {if (is_html_output()) datatable(., filter = 'top', rownames = F) else .}

Population

Population

Code
POP_PROJ %>%
  filter(obsTime %in% c("1950", "1980", "2020", "2050"),
         # D199G5TT - Population (hist&proj) All ages
         AGE == "D199G5TT",
         # TT - All persons
         SEX == "TT") %>%
  left_join(POP_PROJ_var$LOCATION %>%
              setNames(c("LOCATION", "Location")), by = "LOCATION") %>%
  select(LOCATION, Location, obsTime, obsValue) %>%
  mutate(obsValue = round(obsValue)) %>%
  spread(obsTime, obsValue) %>%
  mutate(`% 80-20` = round(100*(`2020`/`1980`-1), 1)) %>%
  {if (is_html_output()) datatable(., filter = 'top', rownames = F) else .}

France, Germany, Italy

Code
POP_PROJ %>%
  filter(LOCATION %in% c("DEU", "FRA", "ITA"),
         # D199G5TT - Population (hist&proj) All ages
         AGE == "D199G5TT",
         # TT - All persons
         SEX == "TT") %>%
  left_join(POP_PROJ_var$LOCATION %>%
              setNames(c("LOCATION", "Location")), by = "LOCATION") %>%
  year_to_enddate %>%
  ggplot() + ylab("Population (hist&proj) All ages") + xlab("") +
  geom_line(aes(x = date, y = obsValue/1000, color = Location, linetype = Location)) +
  scale_color_manual(values = viridis(4)[1:3]) + theme_minimal() +
  theme(legend.position = c(0.7, 0.2),
        legend.title = element_blank(),
        legend.direction = "horizontal") +
  scale_x_date(breaks = seq(1920, 3000, 10) %>% paste0("-01-01") %>% as.Date,
               labels = date_format("%Y")) +
  scale_y_log10(breaks = seq(0, 3000, 5),
                     labels = dollar_format(prefix = "", suffix = " M"))

Europe, United States

Code
POP_PROJ %>%
  filter(LOCATION %in% c("EU28", "USA"),
         # D199G5TT - Population (hist&proj) All ages
         AGE == "D199G5TT",
         # TT - All persons
         SEX == "TT") %>%
  left_join(POP_PROJ_var$LOCATION %>%
              setNames(c("LOCATION", "Location")), by = "LOCATION") %>%
  year_to_enddate %>%
  ggplot() + ylab("Population (hist&proj) All ages") + xlab("") +
  geom_line(aes(x = date, y = obsValue/1000, color = Location, linetype = Location)) +
  scale_color_manual(values = viridis(4)[1:3]) + theme_minimal() +
  theme(legend.position = c(0.7, 0.2),
        legend.title = element_blank(),
        legend.direction = "horizontal") +
  scale_x_date(breaks = seq(1920, 3000, 10) %>% paste0("-01-01") %>% as.Date,
               labels = date_format("%Y")) +
  scale_y_log10(breaks = seq(0, 3000, 50),
                     labels = dollar_format(prefix = "", suffix = " M"))