PDB_GR %>%
filter(SUBJECT %in% c("T_GDPEMP_V"),
MEASURE == "2015Y",
LOCATION %in% c("DEU", "FRA", "EA19", "USA")) %>%
year_to_date %>%
filter(date >= as.Date("1995-01-01")) %>%
left_join(PDB_GR_var$LOCATION, by = "LOCATION") %>%
mutate(Location = ifelse(LOCATION == "EA19", "Europe", Location)) %>%
left_join(colors, by = c("Location" = "country")) %>%
group_by(Location) %>%
mutate(obsValue = 100*obsValue/obsValue[1]) %>%
mutate(color = ifelse(LOCATION == "USA", color2, color)) %>%
ggplot(.) + geom_line(aes(x = date, y = obsValue, color = color)) +
scale_color_identity() + add_4flags +
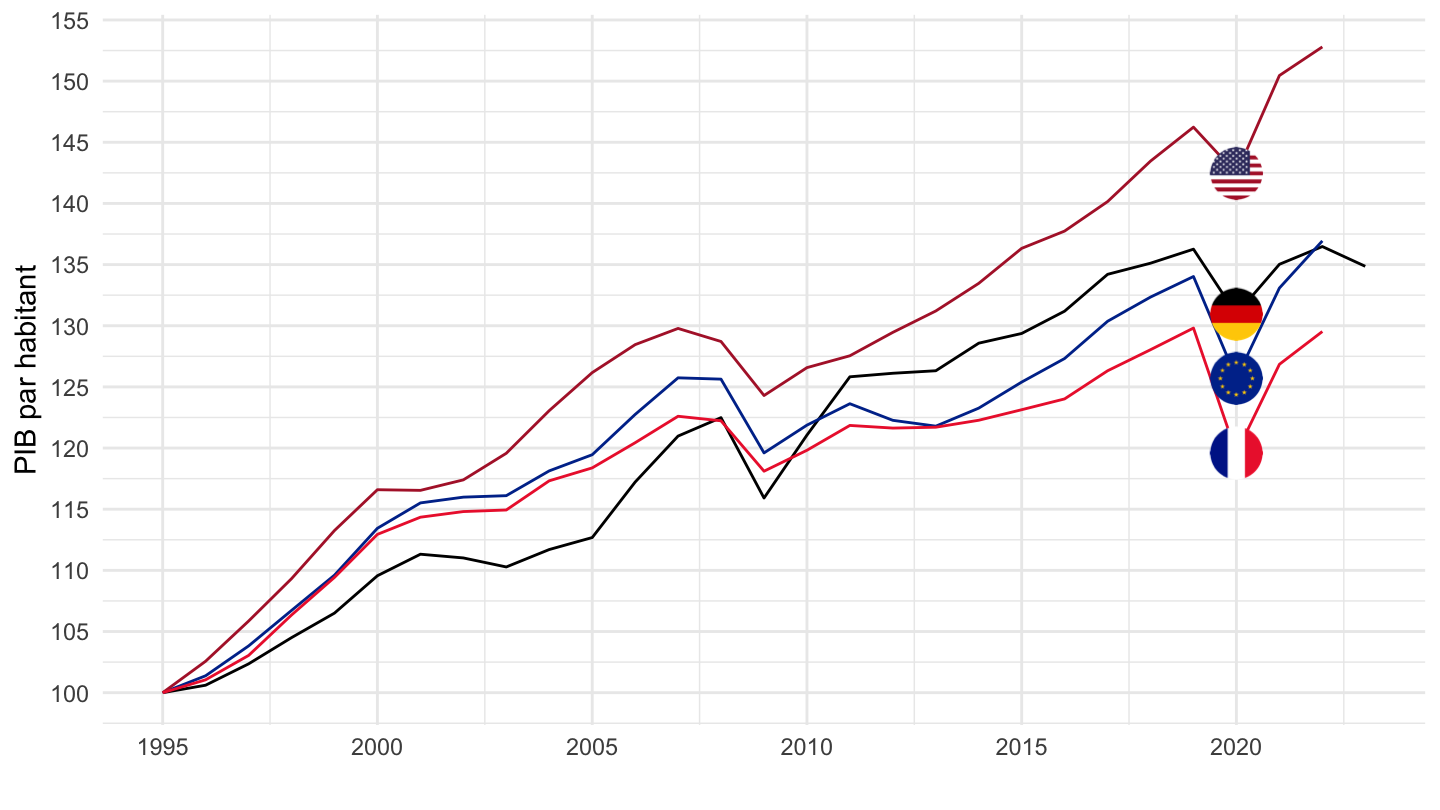
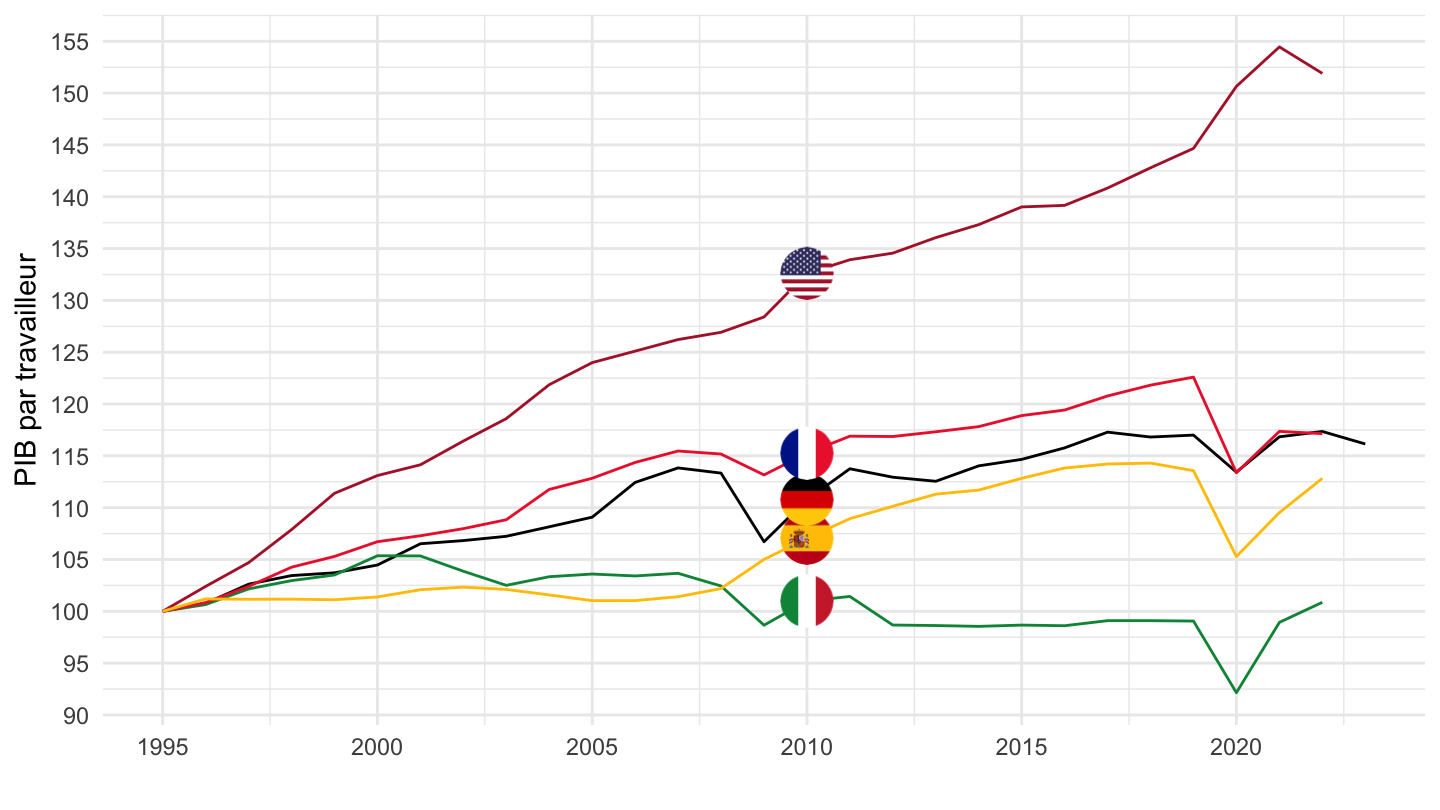
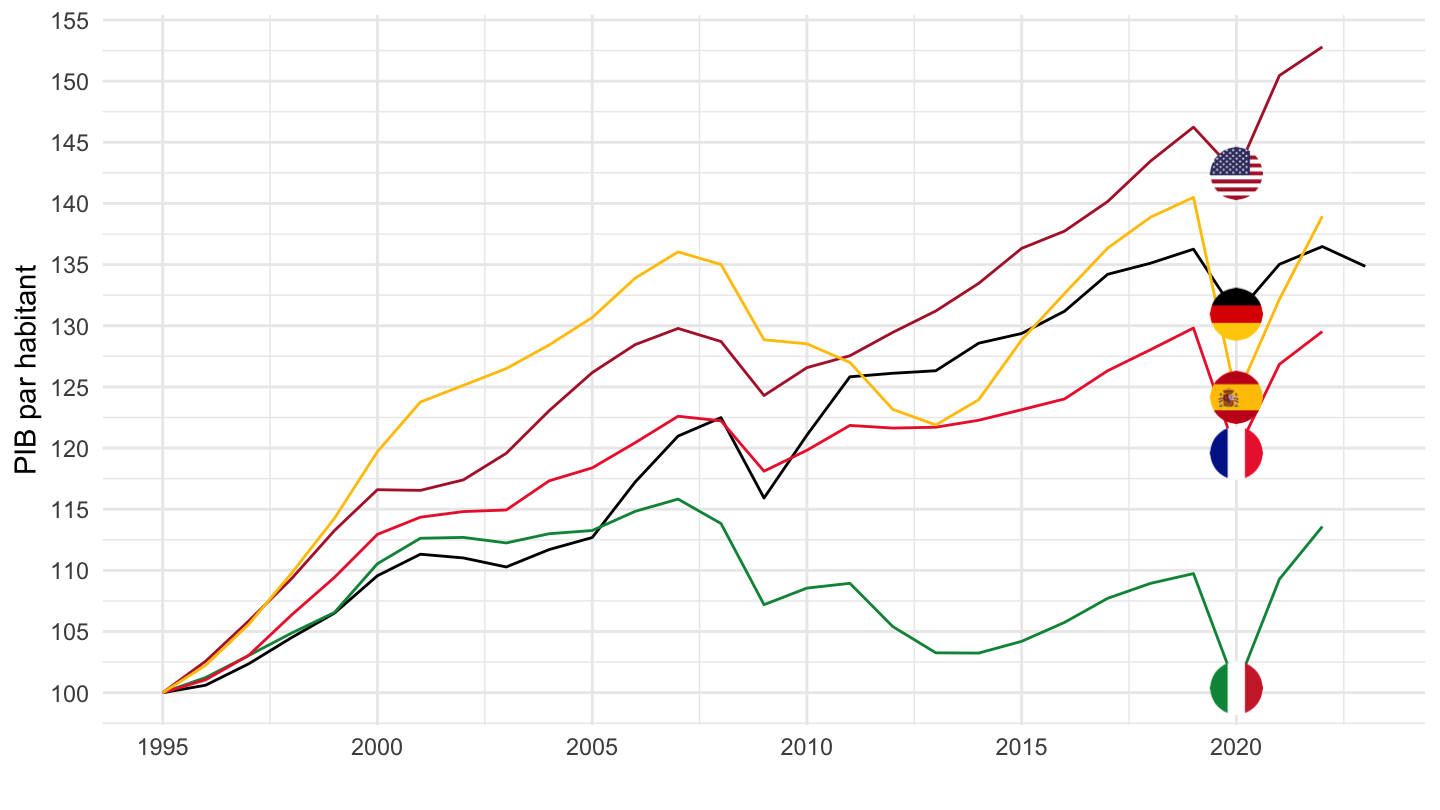
theme_minimal() + xlab("") + ylab("PIB par travailleur") +
scale_x_date(breaks = seq(1960, 2100, 5) %>% paste0("-01-01") %>% as.Date,
labels = date_format("%Y")) +
theme(legend.position = "none") +
scale_y_continuous(breaks = seq(0, 200, 5))