| source | dataset | Title | Download | Compile |
|---|---|---|---|---|
| oecd | PAG | Pensions at A Glance - PAG | 2023-09-09 | [2026-01-11] |
| oecd | PNN_NEW | Funded Pension Statistics - PNN_NEW | 2019-12-24 | [2026-01-11] |
| oecd | PNNI_NEW | Funded Pensions Indicators - PNNI_NEW | 2019-12-27 | [2026-01-11] |
| oecd | SOCX_AGG | Social Expenditure - Aggregated data - SOCX_AGG | 2024-06-30 | [2026-01-11] |
| eurostat | spr_exp_pens | Pensions - spr_exp_pens | 2026-01-09 | [2026-01-10] |
Pensions at A Glance - PAG
Data - OECD
Info
LAST_COMPILE
| LAST_COMPILE |
|---|
| 2026-01-15 |
Last
| obsTime | Nobs |
|---|---|
| 2075 | 51 |
IND
Code
PAG %>%
  left_join(PAG_var$IND, by = "IND") %>%
  group_by(IND, Ind) %>%
  summarise(Nobs = n()) %>%
  arrange(-Nobs) %>%
  {if (is_html_output()) datatable(., filter = 'top', rownames = F) else .}
COU
Code
PAG %>%
  left_join(PAG_var$COU, by = "COU") %>%
  group_by(COU, Cou) %>%
  summarise(Nobs = n()) %>%
  arrange(-Nobs) %>%
  mutate(Flag = gsub(" ", "-", str_to_lower(gsub(" ", "-", Cou))),
         Flag = paste0('<img src="../../icon/flag/vsmall/', Flag, '.png" alt="Flag">')) %>%
  select(Flag, everything()) %>%
  {if (is_html_output()) datatable(., filter = 'top', rownames = F, escape = F) else .}
obsTime
Code
PAG %>%
  group_by(obsTime) %>%
  summarise(Nobs = n()) %>%
  arrange(desc(obsTime)) %>%
  {if (is_html_output()) datatable(., filter = 'top', rownames = F) else .}
Age
Code
PAG %>%
  filter(IND %in% c("PEN1A", "PEN1B"),
         obsTime == "2018") %>%
  left_join(PAG_var$COU, by = "COU") %>%
  select(COU, Cou, IND, obsValue) %>%
  spread(IND, obsValue) %>%
  mutate(Flag = gsub(" ", "-", str_to_lower(gsub(" ", "-", Cou))),
         Flag = paste0('<img src="../../icon/flag/vsmall/', Flag, '.png" alt="Flag">')) %>%
  select(Flag, everything()) %>%
  {if (is_html_output()) datatable(., filter = 'top', rownames = F, escape = F) else .}
Old Age Poverty
PEN24F - Old age income poverty, whole population
Code
PAG %>%
  left_join(PAG_var$COU, by = "COU") %>%
  filter(IND == "PEN24F") %>%
  filter(obsTime == "2018") %>%
  select_if(~ n_distinct(.) > 1) %>%
  mutate(Flag = gsub(" ", "-", str_to_lower(gsub(" ", "-", Cou))),
         Flag = paste0('<img src="../../icon/flag/vsmall/', Flag, '.png" alt="Flag">')) %>%
  select(Flag, COU, Cou, everything()) %>%
  arrange(obsValue) %>%
  {if (is_html_output()) datatable(., filter = 'top', rownames = F, escape = F) else .}
PEN24A - Old age income poverty, 66+
Code
PAG %>%
  left_join(PAG_var$COU, by = "COU") %>%
  filter(IND == "PEN24A") %>%
  filter(obsTime == "2018") %>%
  select_if(~ n_distinct(.) > 1) %>%
  mutate(Flag = gsub(" ", "-", str_to_lower(gsub(" ", "-", Cou))),
         Flag = paste0('<img src="../../icon/flag/vsmall/', Flag, '.png" alt="Flag">')) %>%
  select(Flag, COU, Cou, everything()) %>%
  arrange(obsValue) %>%
  {if (is_html_output()) datatable(., filter = 'top', rownames = F, escape = F) else .}
Actual + Projections
France, Germany, Italy
Code
PAG %>%
  filter(IND %in% c("PEN25", "PEN27"),
         COU %in% c("FRA", "DEU", "ITA")) %>%
  left_join(PAG_var$COU, by = "COU") %>%
  left_join(PAG_var$IND, by = "IND") %>%
  year_to_date %>%
  mutate(variable = case_when(IND == "PEN25" ~ paste0(Cou, " - Actual"),
                              IND == "PEN27" ~ paste0(Cou, " - Projection")),
         obsValue = obsValue / 100) %>%
  rename(Location = Cou) %>%
  left_join(colors, by = c("Location" = "country")) %>%
  ggplot() + geom_line(aes(x = date, y = obsValue, color = color, linetype = Ind)) +
  scale_color_identity() + theme_minimal() + add_3flags +
  scale_x_date(breaks = seq(1920, 2080, 5) %>% paste0("-01-01") %>% as.Date,
               labels = date_format("%Y")) +
  theme(legend.position = c(0.25, 0.9),
        legend.title = element_blank()) +
  scale_y_continuous(breaks = 0.01*seq(-7, 20, 1),
                     labels = scales::percent_format(accuracy = 1)) +
  ylab("Public expenditure on pensions (% of GDP)") + xlab("")
Actual + Projections
France, Germany, Italy, Chile
Code
PAG %>%
  filter(IND %in% c("PEN25", "PEN27"),
         COU %in% c("FRA", "DEU", "ITA", "CHL")) %>%
  left_join(PAG_var$COU, by = "COU") %>%
  left_join(PAG_var$IND, by = "IND") %>%
  year_to_date %>%
  mutate(Ind = case_when(IND == "PEN25" ~ "Public expenditure on pensions - Actual",
                              IND == "PEN27" ~ "Public expenditure on pensions - Projection"),
         obsValue = obsValue / 100) %>%
  rename(Location = Cou) %>%
  left_join(colors, by = c("Location" = "country")) %>%
  ggplot() + geom_line(aes(x = date, y = obsValue, color = color, linetype = Ind)) +
  scale_color_identity() + theme_minimal() + add_4flags +
  scale_x_date(breaks = seq(1920, 2080, 5) %>% paste0("-01-01") %>% as.Date,
               labels = date_format("%Y")) +
  theme(legend.position = c(0.65, 0.4),
        legend.title = element_blank()) +
  scale_y_continuous(breaks = 0.01*seq(-7, 20, 1),
                     labels = scales::percent_format(accuracy = 1)) +
  ylab("Public expenditure on pensions (% of GDP)") + xlab("")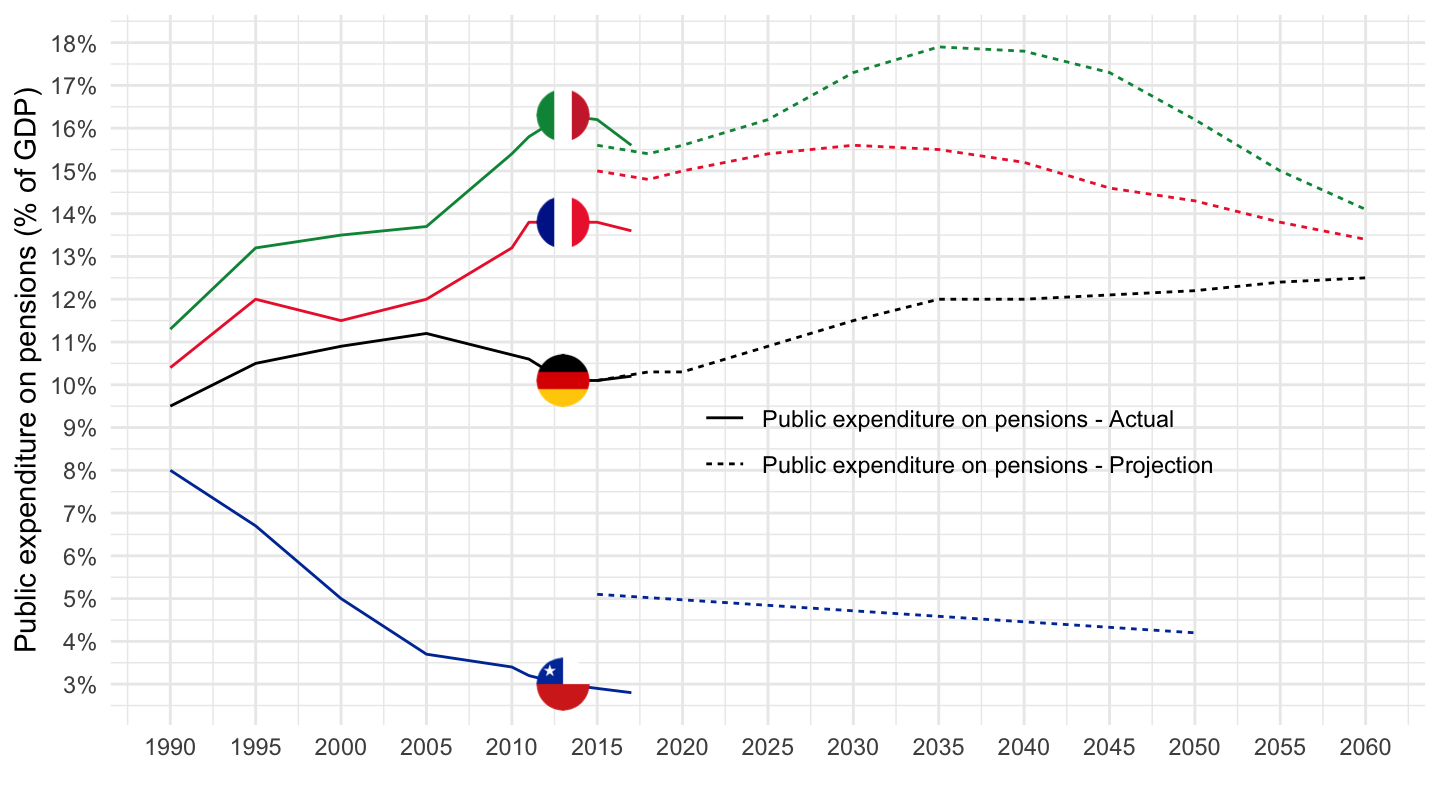
Denmark, Netherlands, Switzerland
Code
PAG %>%
  filter(IND %in% c("PEN25", "PEN27"),
         COU %in% c("NLD", "CHE", "DNK")) %>%
  left_join(PAG_var$COU, by = "COU") %>%
  left_join(PAG_var$IND, by = "IND") %>%
  year_to_date %>%
  mutate(variable = case_when(IND == "PEN25" ~ paste0(Cou, " - Actual"),
                              IND == "PEN27" ~ paste0(Cou, " - Projection")),
         obsValue = obsValue / 100) %>%
  rename(Location = Cou) %>%
  left_join(colors, by = c("Location" = "country")) %>%
  ggplot() + geom_line(aes(x = date, y = obsValue, color = color, linetype = Ind)) +
  scale_color_identity() + theme_minimal() + add_3flags +
  scale_x_date(breaks = seq(1920, 2080, 5) %>% paste0("-01-01") %>% as.Date,
               labels = date_format("%Y")) +
  theme(legend.position = c(0.65, 0.25),
        legend.title = element_blank()) +
  scale_y_continuous(breaks = 0.01*seq(-7, 16, 1),
                     labels = scales::percent_format(accuracy = 1),
                     limits = c(0.0, 0.11)) +
  ylab("Public expenditure on pensions (% of GDP)") + xlab("")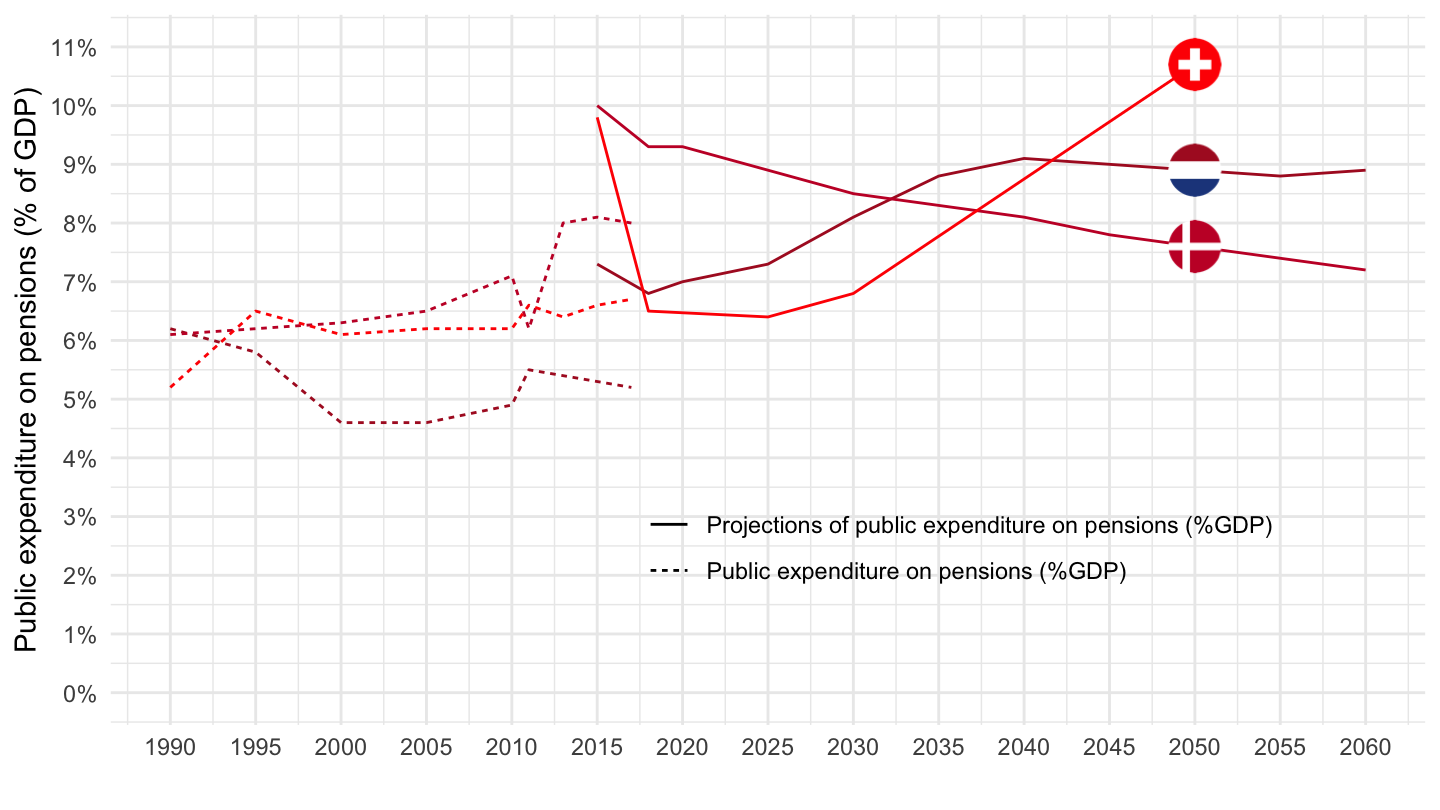
Japan, United Kingdom, United States
Code
PAG %>%
  filter(IND %in% c("PEN25", "PEN27"),
         COU %in% c("JPN", "USA", "GBR")) %>%
  left_join(PAG_var$COU, by = "COU") %>%
  left_join(PAG_var$IND, by = "IND") %>%
  year_to_date %>%
  mutate(variable = case_when(IND == "PEN25" ~ paste0(Cou, " - Actual"),
                              IND == "PEN27" ~ paste0(Cou, " - Projection")),
         obsValue = obsValue / 100) %>%
  rename(Location = Cou) %>%
  left_join(colors, by = c("Location" = "country")) %>%
  ggplot() + geom_line(aes(x = date, y = obsValue, color = color, linetype = Ind)) +
  scale_color_identity() + theme_minimal() + add_3flags +
  scale_x_date(breaks = seq(1920, 2080, 5) %>% paste0("-01-01") %>% as.Date,
               labels = date_format("%Y")) +
  theme(legend.position = c(0.65, 0.25),
        legend.title = element_blank()) +
  scale_y_continuous(breaks = 0.01*seq(-7, 12, 1),
                     labels = scales::percent_format(accuracy = 1),
                     limits = c(0.0, 0.11)) +
  ylab("Public expenditure on pensions (% of GDP)") + xlab("")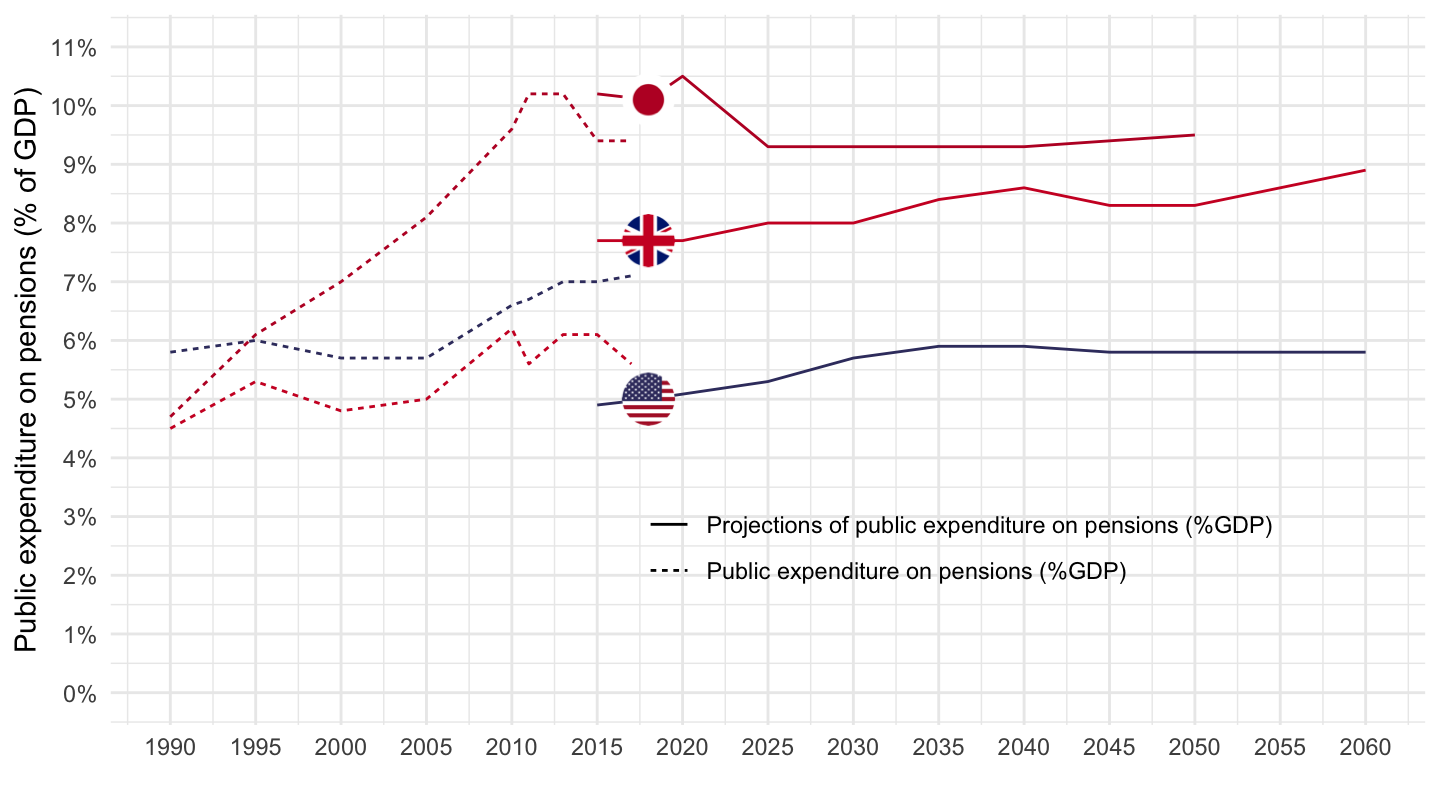
PEN25
France, Germany, Italy
Code
PAG %>%
  filter(IND == "PEN25",
         COU %in% c("FRA", "DEU", "ITA")) %>%
  left_join(PAG_var$COU, by = "COU") %>%
  left_join(PAG_var$IND, by = "IND") %>%
  year_to_date %>%
  mutate(obsValue = obsValue / 100) %>%
  filter(year(date) >= 1990) %>%
  arrange(Cou) %>%
  select(Cou, Ind, date, obsValue) %>%
  rename(Location = Cou) %>%
  left_join(colors, by = c("Location" = "country")) %>%
  ggplot() + geom_line(aes(x = date, y = obsValue, color = color)) +
  scale_color_identity() + theme_minimal() + add_3flags +
  scale_x_date(breaks = seq(1920, 2080, 5) %>% paste0("-01-01") %>% as.Date,
               labels = date_format("%Y")) +
  theme(legend.position = c(0.65, 0.25),
        legend.title = element_blank()) +
  scale_y_continuous(breaks = 0.01*seq(-7, 20, 1),
                     labels = scales::percent_format(accuracy = 1)) +
  ylab("Public expenditure on pensions (% of GDP)") + xlab("")
PEN27 - Projections of public expenditure on pensions
France, Germany, Italy
Code
PAG %>%
  filter(IND == "PEN27",
         COU %in% c("FRA", "DEU", "ITA")) %>%
  left_join(PAG_var$COU, by = "COU") %>%
  left_join(PAG_var$IND, by = "IND") %>%
  year_to_date %>%
  mutate(obsValue = obsValue / 100) %>%
  filter(year(date) >= 1990) %>%
  arrange(Cou) %>%
  select(Cou, Ind, date, obsValue) %>%
  rename(Location = Cou) %>%
  left_join(colors, by = c("Location" = "country")) %>%
  ggplot() + geom_line(aes(x = date, y = obsValue, color = color)) +
  scale_color_identity() + theme_minimal() + add_3flags +
  scale_x_date(breaks = seq(1920, 2080, 5) %>% paste0("-01-01") %>% as.Date,
               labels = date_format("%Y")) +
  theme(legend.position = c(0.65, 0.25),
        legend.title = element_blank()) +
  scale_y_continuous(breaks = 0.01*seq(-7, 20, 1),
                     labels = scales::percent_format(accuracy = 1)) +
  ylab("Public expenditure on pensions (% of GDP)") + xlab("")
Denmark, Netherlands, Switzerland
Code
PAG %>%
  filter(IND == "PEN27",
         COU %in% c("NLD", "CHE", "DNK")) %>%
  left_join(PAG_var$COU, by = "COU") %>%
  left_join(PAG_var$IND, by = "IND") %>%
  year_to_date %>%
  mutate(obsValue = obsValue / 100) %>%
  filter(year(date) >= 1990) %>%
  arrange(Cou) %>%
  select(Cou, Ind, date, obsValue) %>%
  rename(Location = Cou) %>%
  left_join(colors, by = c("Location" = "country")) %>%
  ggplot() + geom_line(aes(x = date, y = obsValue, color = color)) +
  scale_color_identity() + theme_minimal() + add_3flags +
  scale_x_date(breaks = seq(1920, 2080, 5) %>% paste0("-01-01") %>% as.Date,
               labels = date_format("%Y")) +
  theme(legend.position = c(0.65, 0.25),
        legend.title = element_blank()) +
  scale_y_continuous(breaks = 0.01*seq(-7, 20, 1),
                     labels = scales::percent_format(accuracy = 1)) +
  ylab("Public expenditure on pensions (% of GDP)") + xlab("")
France, Germany
PEN25
Code
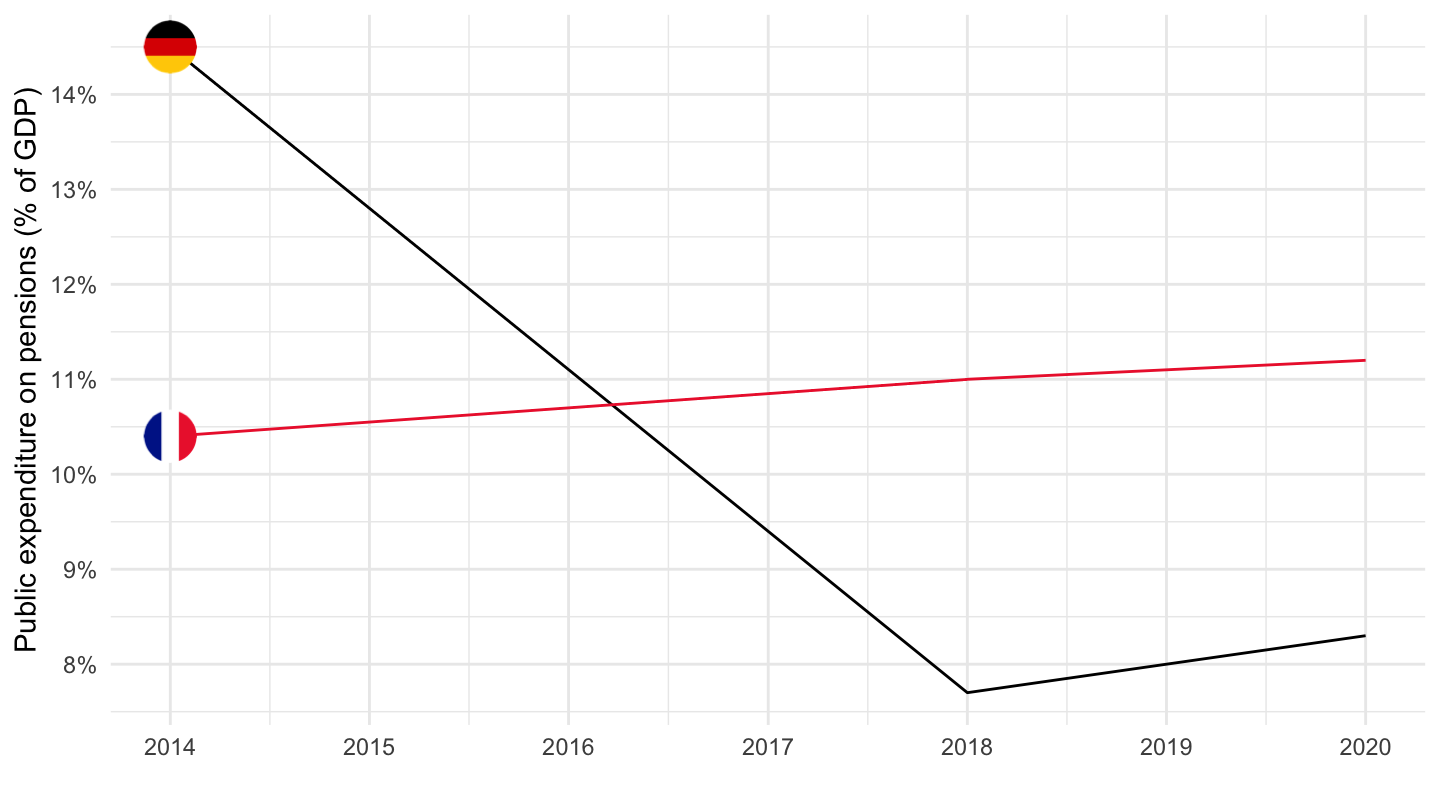
PAG %>%
  filter(IND == "PEN25",
         COU %in% c("FRA", "DEU")) %>%
  left_join(PAG_var$COU, by = "COU") %>%
  left_join(PAG_var$IND, by = "IND") %>%
  year_to_date %>%
  mutate(obsValue = obsValue / 100) %>%
  filter(year(date) >= 1990) %>%
  arrange(Cou) %>%
  select(Cou, Ind, date, obsValue) %>%
  rename(Location = Cou) %>%
  left_join(colors, by = c("Location" = "country")) %>%
  ggplot() + geom_line(aes(x = date, y = obsValue, color = color)) +
  scale_color_identity() + theme_minimal() + add_2flags +
  scale_x_date(breaks = seq(1920, 2080, 5) %>% paste0("-01-01") %>% as.Date,
               labels = date_format("%Y")) +
  theme(legend.position = c(0.65, 0.25),
        legend.title = element_blank()) +
  scale_y_continuous(breaks = 0.01*seq(-7, 20, 1),
                     labels = scales::percent_format(accuracy = 1)) +
  ylab("Public expenditure on pensions (% of GDP)") + xlab("")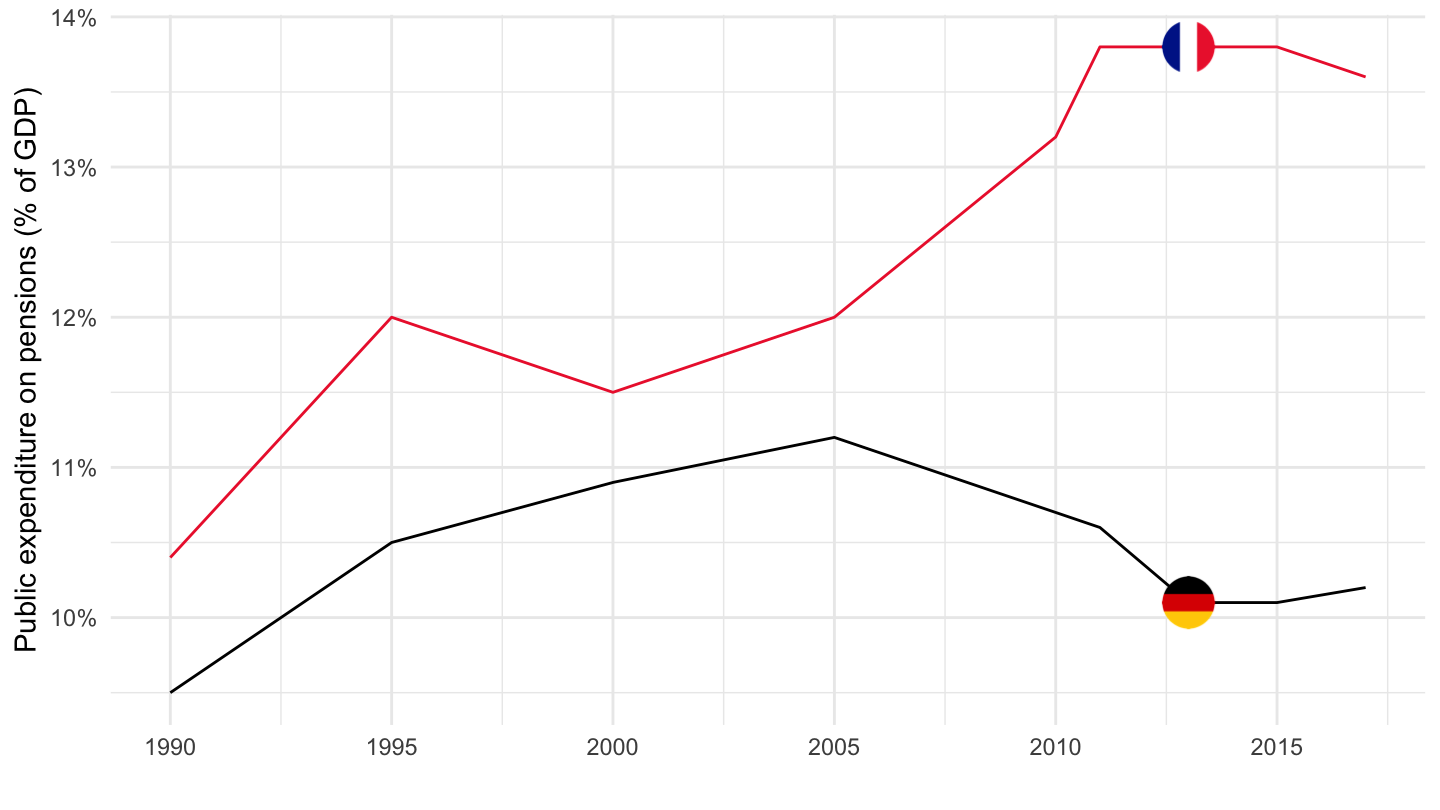
PEN3B
Code
PAG %>%
  filter(IND == "PEN3B",
         COU %in% c("FRA", "DEU")) %>%
  left_join(PAG_var$COU, by = "COU") %>%
  left_join(PAG_var$IND, by = "IND") %>%
  year_to_date %>%
  mutate(obsValue = obsValue/100) %>%
  filter(year(date) >= 1990) %>%
  arrange(Cou) %>%
  select(Cou, Ind, date, obsValue) %>%
  rename(Location = Cou) %>%
  left_join(colors, by = c("Location" = "country")) %>%
  ggplot() + geom_line(aes(x = date, y = obsValue, color = color)) +
  scale_color_identity() + theme_minimal() + add_2flags +
  scale_x_date(breaks = seq(1920, 2080, 1) %>% paste0("-01-01") %>% as.Date,
               labels = date_format("%Y")) +
  theme(legend.position = c(0.65, 0.25),
        legend.title = element_blank()) +
  scale_y_continuous(breaks = 0.01*seq(0, 100, 5),
                     labels = scales::percent_format(accuracy = 1)) +
  ylab("Public expenditure on pensions (% of GDP)") + xlab("")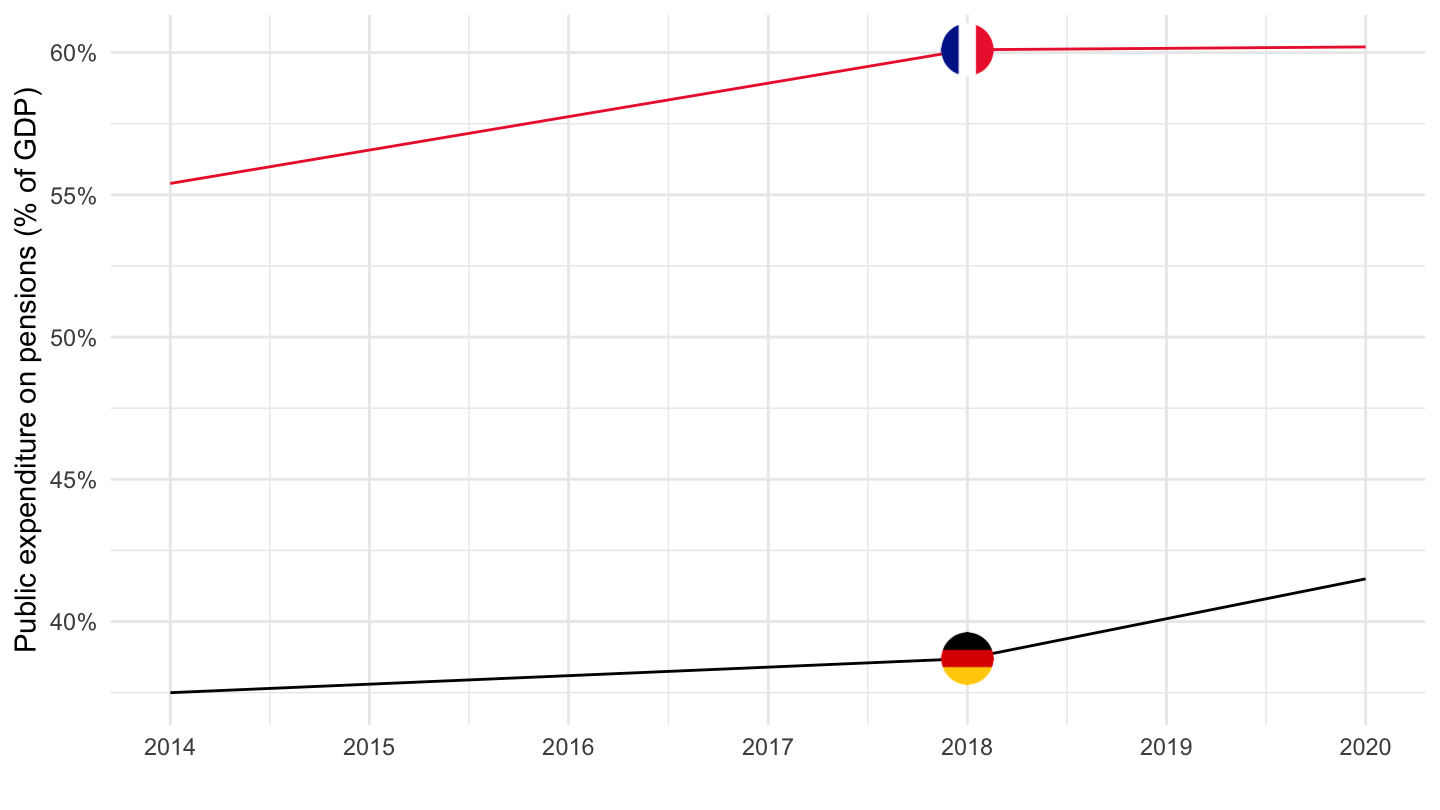
PEN3B
Code
PAG %>%
  filter(IND == "PEN3B",
         COU %in% c("FRA", "DEU")) %>%
  left_join(PAG_var$COU, by = "COU") %>%
  left_join(PAG_var$IND, by = "IND") %>%
  year_to_date %>%
  mutate(obsValue = obsValue/100) %>%
  filter(year(date) >= 1990) %>%
  arrange(Cou) %>%
  select(Cou, Ind, date, obsValue) %>%
  rename(Location = Cou) %>%
  left_join(colors, by = c("Location" = "country")) %>%
  ggplot() + geom_line(aes(x = date, y = obsValue, color = color)) +
  scale_color_identity() + theme_minimal() + add_2flags +
  scale_x_date(breaks = seq(1920, 2080, 1) %>% paste0("-01-01") %>% as.Date,
               labels = date_format("%Y")) +
  theme(legend.position = c(0.65, 0.25),
        legend.title = element_blank()) +
  scale_y_continuous(breaks = 0.01*seq(0, 100, 5),
                     labels = scales::percent_format(accuracy = 1)) +
  ylab("Public expenditure on pensions (% of GDP)") + xlab("")
PEN5B
Code
PAG %>%
  filter(IND == "PEN5B",
         COU %in% c("FRA", "DEU")) %>%
  left_join(PAG_var$COU, by = "COU") %>%
  left_join(PAG_var$IND, by = "IND") %>%
  year_to_date %>%
  mutate(obsValue = obsValue/100) %>%
  filter(year(date) >= 1990) %>%
  arrange(Cou) %>%
  select(Cou, Ind, date, obsValue) %>%
  rename(Location = Cou) %>%
  left_join(colors, by = c("Location" = "country")) %>%
  ggplot() + geom_line(aes(x = date, y = obsValue, color = color)) +
  scale_color_identity() + theme_minimal() + add_2flags +
  scale_x_date(breaks = seq(1920, 2080, 1) %>% paste0("-01-01") %>% as.Date,
               labels = date_format("%Y")) +
  theme(legend.position = c(0.65, 0.25),
        legend.title = element_blank()) +
  scale_y_continuous(breaks = 0.01*seq(0, 100, 1),
                     labels = scales::percent_format(accuracy = 1)) +
  ylab("Public expenditure on pensions (% of GDP)") + xlab("")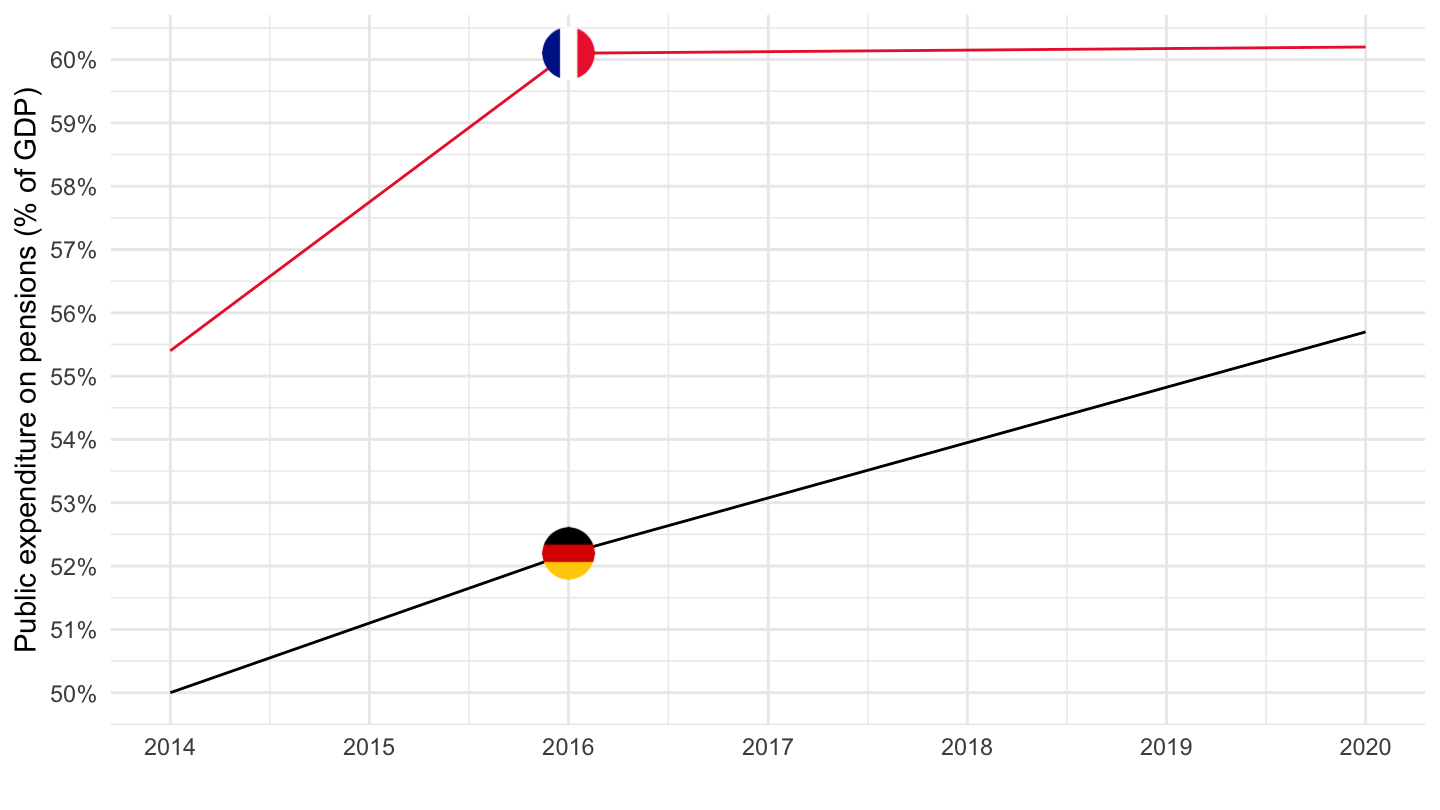
PEN10B
Code
PAG %>%
  filter(IND == "PEN10B",
         COU %in% c("FRA", "DEU")) %>%
  left_join(PAG_var$COU, by = "COU") %>%
  left_join(PAG_var$IND, by = "IND") %>%
  year_to_date %>%
  mutate(obsValue = obsValue/100) %>%
  filter(year(date) >= 1990) %>%
  arrange(Cou) %>%
  select(Cou, Ind, date, obsValue) %>%
  rename(Location = Cou) %>%
  left_join(colors, by = c("Location" = "country")) %>%
  ggplot() + geom_line(aes(x = date, y = obsValue, color = color)) +
  scale_color_identity() + theme_minimal() + add_2flags +
  scale_x_date(breaks = seq(1920, 2080, 1) %>% paste0("-01-01") %>% as.Date,
               labels = date_format("%Y")) +
  theme(legend.position = c(0.65, 0.25),
        legend.title = element_blank()) +
  scale_y_continuous(breaks = 0.01*seq(0, 100, 1),
                     labels = scales::percent_format(accuracy = 1)) +
  ylab("Public expenditure on pensions (% of GDP)") + xlab("")