Main Science and Technology Indicators (MSTI database)
Data - OECD
Info
Last observation: Annual: 2025 (N = 439)
First observation: Annual: 1981 (N = 1,960)
Last data update: 23 jul 2026, 23:21. Last compile: 24 jul 2026, 03:58
Structure
High Technology Exports
China, United States
Linear
Code
MSTI %>%
  filter(MEASURE %in% c("TD_EAERO", "TD_ECOMP", "TD_EDRUG"),
         REF_AREA %in% c("CHN", "USA"),
         UNIT_MEASURE == "USD") %>%

  mutate(Ref_area = ifelse(REF_AREA == "CHN", "China", Ref_area)) %>%
  year_to_date %>%
  select_if(~ n_distinct(.) > 1) %>%
  select(MEASURE, Ref_area, date, obsValue) %>%
  spread(MEASURE, obsValue) %>%
  mutate(obsValue = (TD_EAERO + TD_ECOMP + TD_EDRUG)/1000) %>%
  left_join(colors, by = c("Ref_area" = "country")) %>%
  ggplot + geom_line(aes(x = date, y = obsValue, color = color)) +
  scale_color_identity() + theme_minimal() + add_2flags +
  scale_x_date(breaks = seq(1920, 2100, 5) %>% paste0("-01-01") %>% as.Date,
               labels = date_format("%Y")) +
  scale_y_continuous(breaks = seq(0, 1200, 100),
                     labels = dollar_format(su = " Bn")) +
  ylab("High Technology Exports = Aerospace + \nComputer, electronic and optical industry + Pharmaceutical") + xlab("")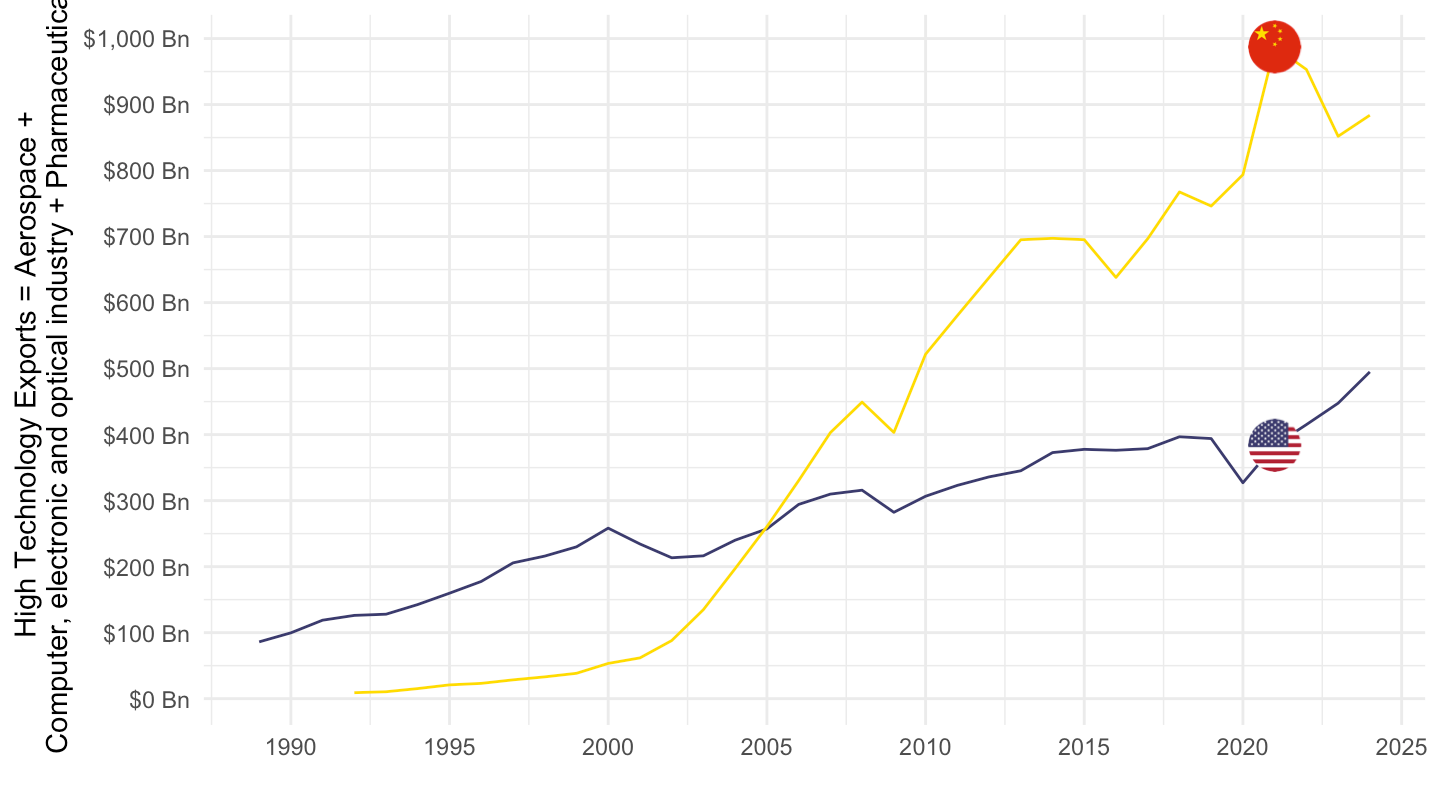
Log
Code
MSTI %>%
  filter(MEASURE %in% c("TD_EAERO", "TD_ECOMP", "TD_EDRUG"),
         REF_AREA %in% c("CHN", "USA"),
         UNIT_MEASURE == "USD") %>%

  mutate(Ref_area = ifelse(REF_AREA == "CHN", "China", Ref_area)) %>%
  year_to_date %>%
  select(MEASURE, Ref_area = Ref_area, date, obsValue) %>%
  spread(MEASURE, obsValue) %>%
  mutate(obsValue = (TD_EAERO + TD_ECOMP + TD_EDRUG)/1000) %>%
  left_join(colors, by = c("Ref_area" = "country")) %>%
  ggplot + geom_line(aes(x = date, y = obsValue, color = color)) +
  scale_color_identity() + theme_minimal() + add_2flags +
  scale_x_date(breaks = seq(1920, 2100, 5) %>% paste0("-01-01") %>% as.Date,
               labels = date_format("%Y")) +
  scale_y_log10(breaks = c(1, 2, 3, 5, 8, 10, 20, 30, 50, 80, 100, 200, 300, 500, 800),
                     labels = dollar_format(su = " Bn", a = 1)) +
  ylab("High Technology Exports = Aerospace + \nComputer, electronic and optical industry + Pharmaceutical") + xlab("")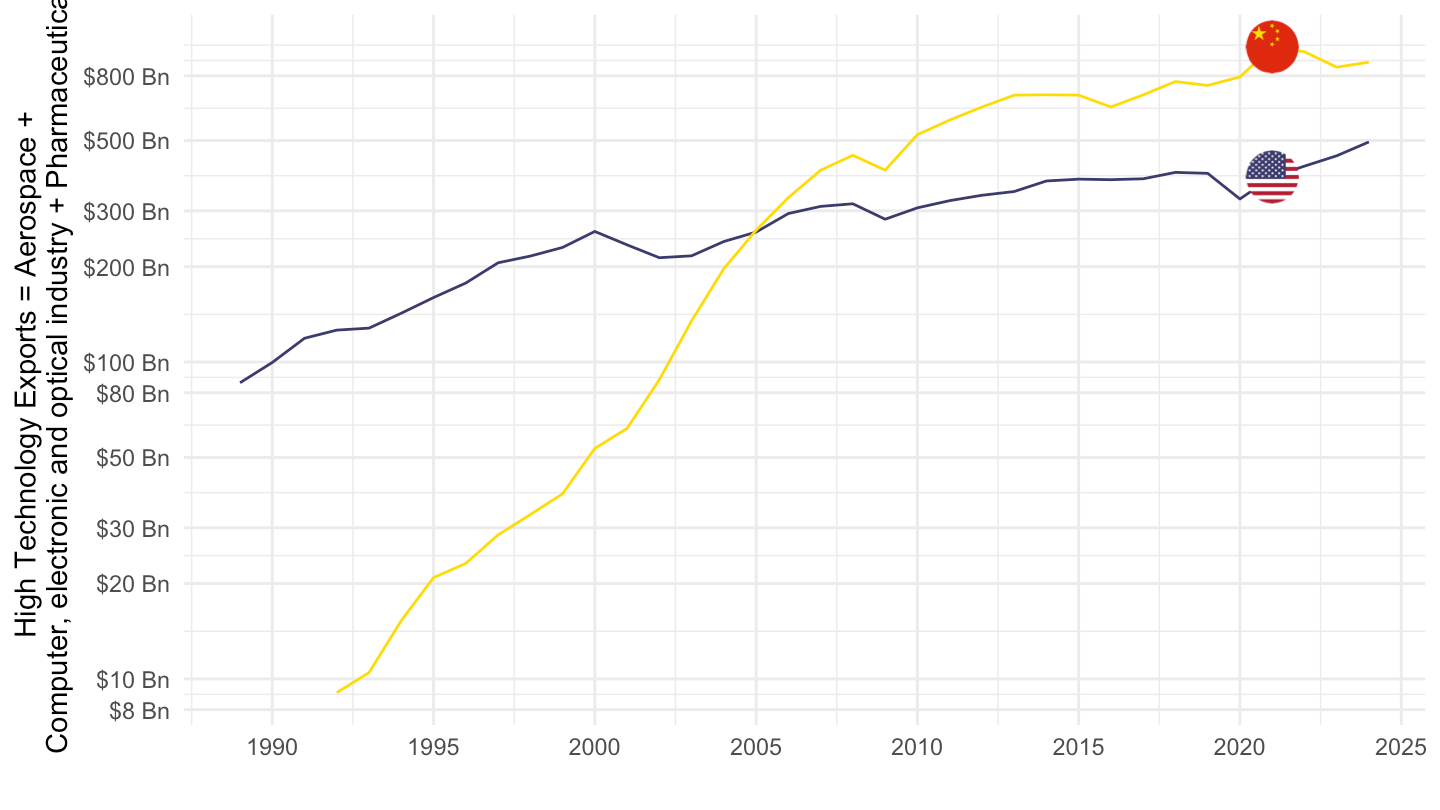
China, United States, Germany, France
Linear
Code
MSTI %>%
  filter(MEASURE %in% c("TD_EAERO", "TD_ECOMP", "TD_EDRUG"),
         REF_AREA %in% c("CHN", "USA", "DEU", "FRA"),
         UNIT_MEASURE == "USD") %>%

  mutate(Ref_area = ifelse(REF_AREA == "CHN", "China", Ref_area)) %>%
  year_to_date %>%
  select(MEASURE, Ref_area = Ref_area, date, obsValue) %>%
  spread(MEASURE, obsValue) %>%
  mutate(obsValue = (TD_EAERO + TD_ECOMP + TD_EDRUG)/1000) %>%
  left_join(colors, by = c("Ref_area" = "country")) %>%
  ggplot + geom_line(aes(x = date, y = obsValue, color = color)) +
  scale_color_identity() + theme_minimal() + add_4flags +
  scale_x_date(breaks = seq(1920, 2100, 5) %>% paste0("-01-01") %>% as.Date,
               labels = date_format("%Y")) +
  scale_y_continuous(breaks = seq(0, 1200, 100),
                     labels = dollar_format(su = " Bn")) +
  ylab("High Technology Exports = Aerospace + \nComputer, electronic and optical industry + Pharmaceutical") + xlab("")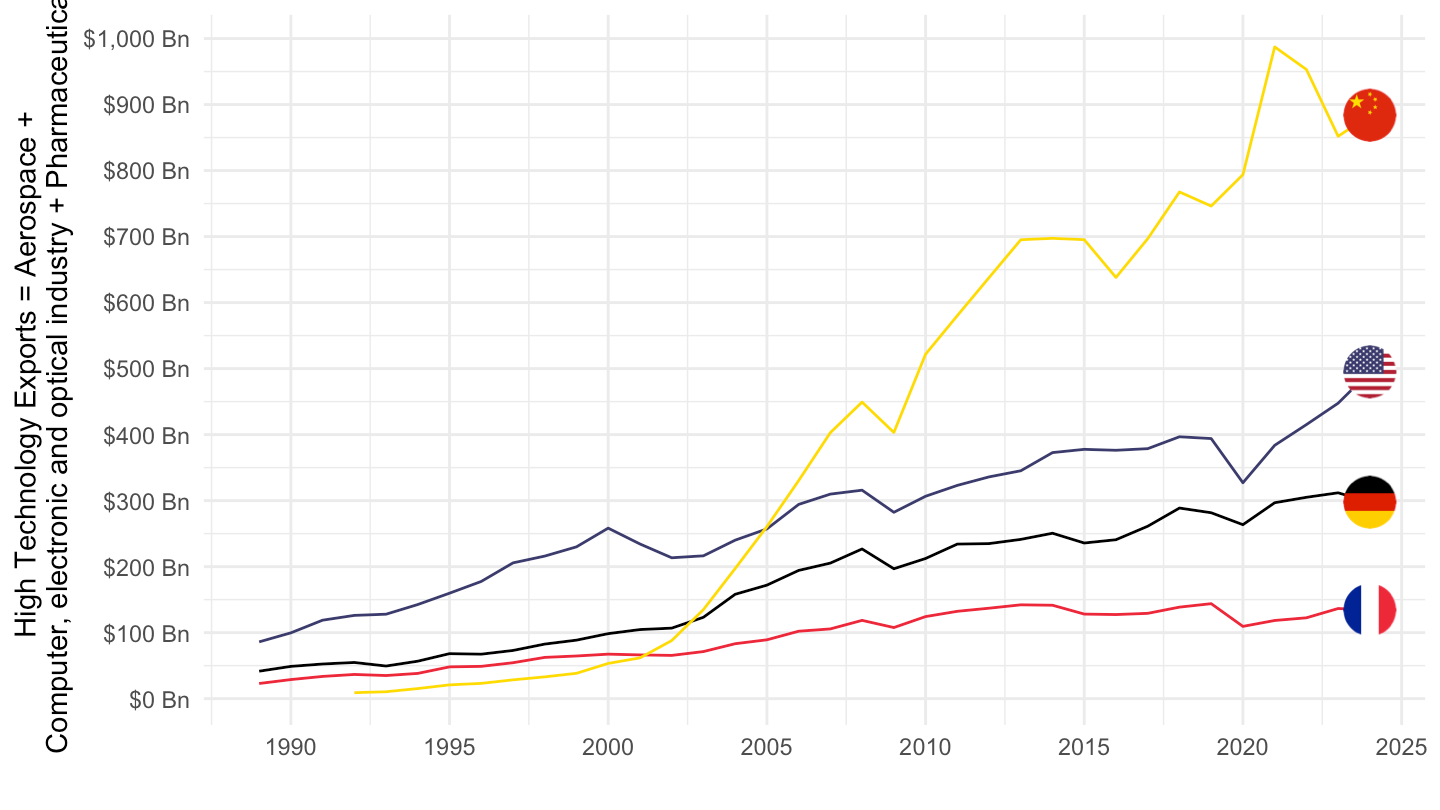
Log
All
Code
MSTI %>%
  filter(MEASURE %in% c("TD_EAERO", "TD_ECOMP", "TD_EDRUG"),
         REF_AREA %in% c("CHN", "USA", "DEU", "FRA", "EU27_2020"),
         UNIT_MEASURE == "USD") %>%

  mutate(Ref_area = ifelse(REF_AREA == "CHN", "China", Ref_area)) %>%
  year_to_date %>%
  select(MEASURE, REF_AREA, Ref_area = Ref_area, date, obsValue) %>%
  spread(MEASURE, obsValue) %>%
  mutate(obsValue = (TD_EAERO + TD_ECOMP + TD_EDRUG)/1000) %>%
  mutate(Ref_area = ifelse(REF_AREA == "EU27_2020", "Europe", Ref_area)) %>%
  left_join(colors, by = c("Ref_area" = "country")) %>%
  mutate(color = ifelse(REF_AREA == "USA", color2, color)) %>%
  ggplot + geom_line(aes(x = date, y = obsValue, color = color)) +
  scale_color_identity() + theme_minimal() + add_4flags +
  scale_x_date(breaks = seq(1920, 2100, 5) %>% paste0("-01-01") %>% as.Date,
               labels = date_format("%Y")) +
  scale_y_log10(breaks = c(1, 2, 3, 5, 8, 10, 20, 30, 50, 80, 100, 200, 300, 500, 800),
                     labels = dollar_format(su = " Bn", a = 1)) +
  ylab("High Technology Exports = Aerospace + \nComputer, electronic and optical industry + Pharmaceutical") + xlab("")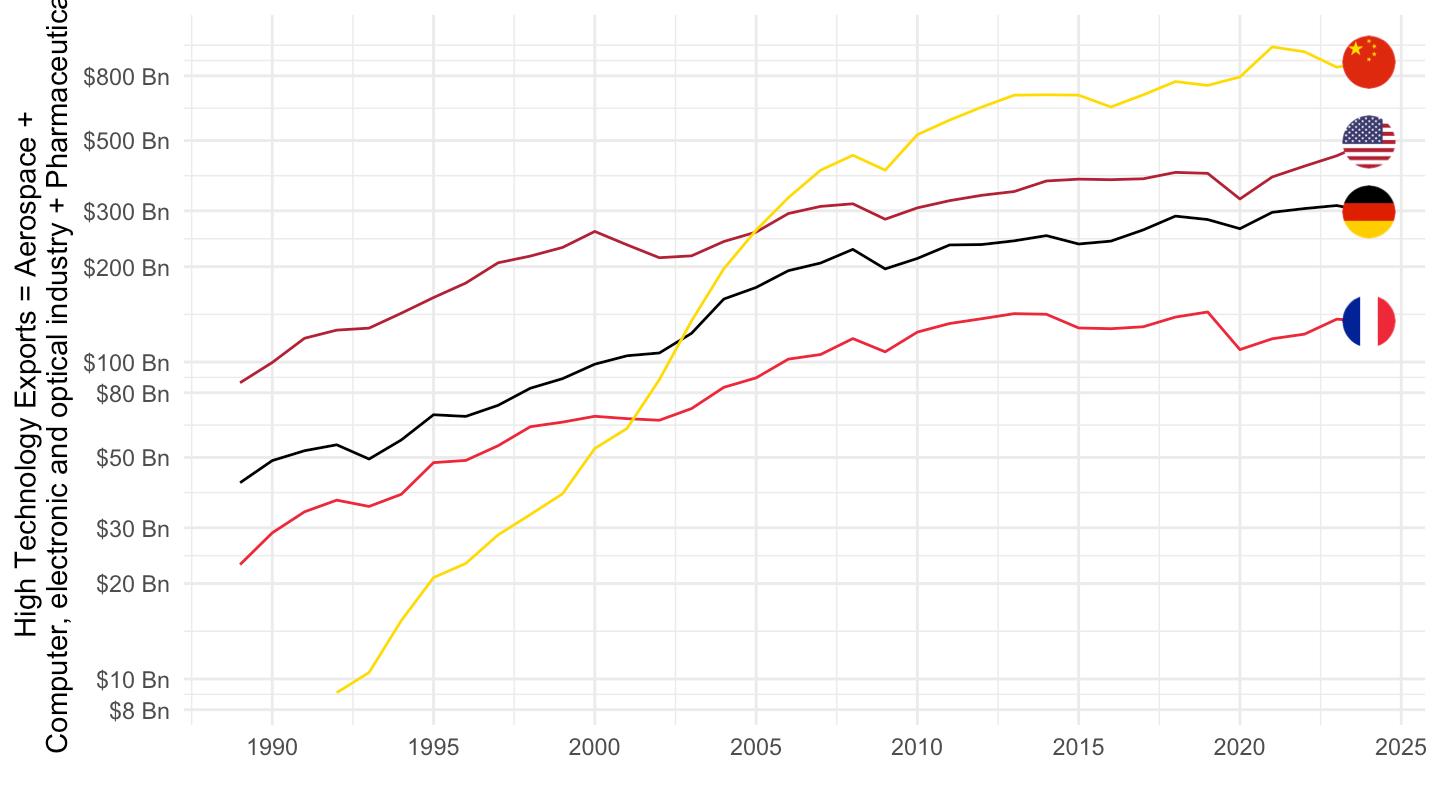
1995-
Code
MSTI %>%
  filter(MEASURE %in% c("TD_EAERO", "TD_ECOMP", "TD_EDRUG"),
         REF_AREA %in% c("CHN", "USA", "DEU", "FRA"),
         UNIT_MEASURE == "USD") %>%

  mutate(Ref_area = ifelse(REF_AREA == "CHN", "China", Ref_area)) %>%
  year_to_date %>%
  filter(date >= as.Date("1995-01-01")) %>%
  select(MEASURE, REF_AREA, Ref_area = Ref_area, date, obsValue) %>%
  spread(MEASURE, obsValue) %>%
  mutate(obsValue = (TD_EAERO + TD_ECOMP + TD_EDRUG)/1000) %>%
  left_join(colors, by = c("Ref_area" = "country")) %>%
  mutate(color = ifelse(REF_AREA %in% c("CHN", "USA"), color2, color)) %>%
  ggplot + geom_line(aes(x = date, y = obsValue, color = color)) +
  scale_color_identity() + theme_minimal() + add_4flags +
  scale_x_date(breaks = seq(1920, 2100, 5) %>% paste0("-01-01") %>% as.Date,
               labels = date_format("%Y")) +
  scale_y_log10(breaks = c(1, 2, 3, 5, 8, 10, 20, 30, 50, 80, 100, 200, 300, 500, 800),
                     labels = dollar_format(su = " Bn", a = 1)) +
  ylab("High Tech. Exports = Aerospace + Computer, \nelectronic and optical industry + Pharmaceutical") + xlab("")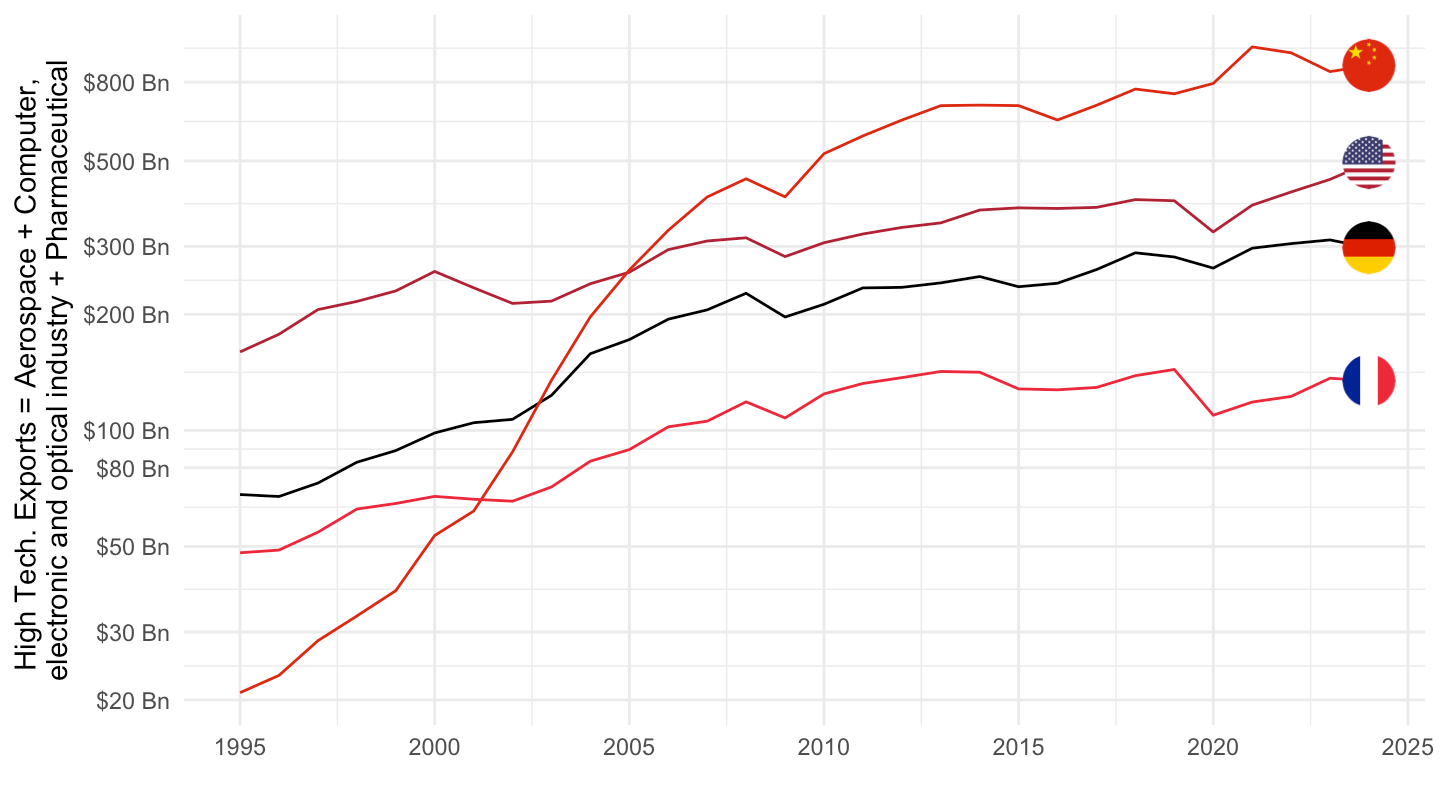
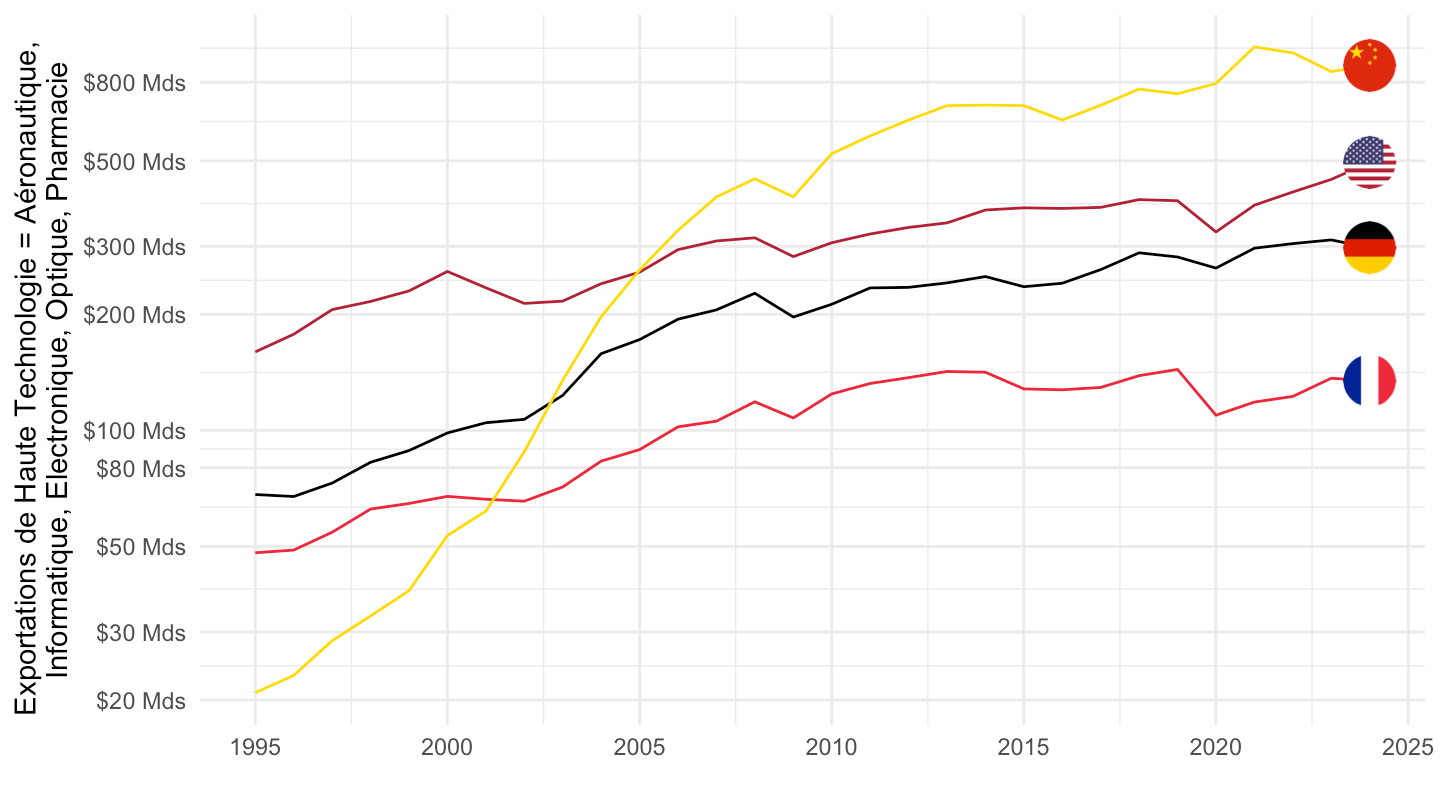
1995-
Code
MSTI %>%
  filter(MEASURE %in% c("TD_EAERO", "TD_ECOMP", "TD_EDRUG"),
         REF_AREA %in% c("CHN", "USA", "DEU", "FRA"),
         UNIT_MEASURE == "USD") %>%

  mutate(Ref_area = ifelse(REF_AREA == "CHN", "China", Ref_area)) %>%
  year_to_date %>%
  filter(date >= as.Date("1995-01-01")) %>%
  select(MEASURE, REF_AREA, Ref_area = Ref_area, date, obsValue) %>%
  spread(MEASURE, obsValue) %>%
  mutate(obsValue = (TD_EAERO + TD_ECOMP + TD_EDRUG)/1000) %>%
  left_join(colors, by = c("Ref_area" = "country")) %>%
  mutate(color = ifelse(REF_AREA %in% c("USA"), color2, color)) %>%
  ggplot + geom_line(aes(x = date, y = obsValue, color = color)) +
  scale_color_identity() + theme_minimal() + add_4flags +
  scale_x_date(breaks = seq(1920, 2100, 5) %>% paste0("-01-01") %>% as.Date,
               labels = date_format("%Y")) +
  scale_y_log10(breaks = c(1, 2, 3, 5, 8, 10, 20, 30, 50, 80, 100, 200, 300, 500, 800),
                     labels = dollar_format(su = " Mds", a = 1)) +
  ylab("Exportations de Haute Technologie = Aéronautique,  \nInformatique, Electronique, Optique, Pharmacie") + xlab("")