METR %>%
# HBTOPUPS: Includes Housing Benefits?
filter(LOCATION == "DEU",
FAMILY == "SINGLE",
EARNINGS == "AW",
HBTOPUPS == 1) %>%
year_to_date %>%
left_join(METR_var$TRANSITION %>%
setNames(c("TRANSITION", "Transition")), by = "TRANSITION") %>%
mutate(obsValue = obsValue/100) %>%
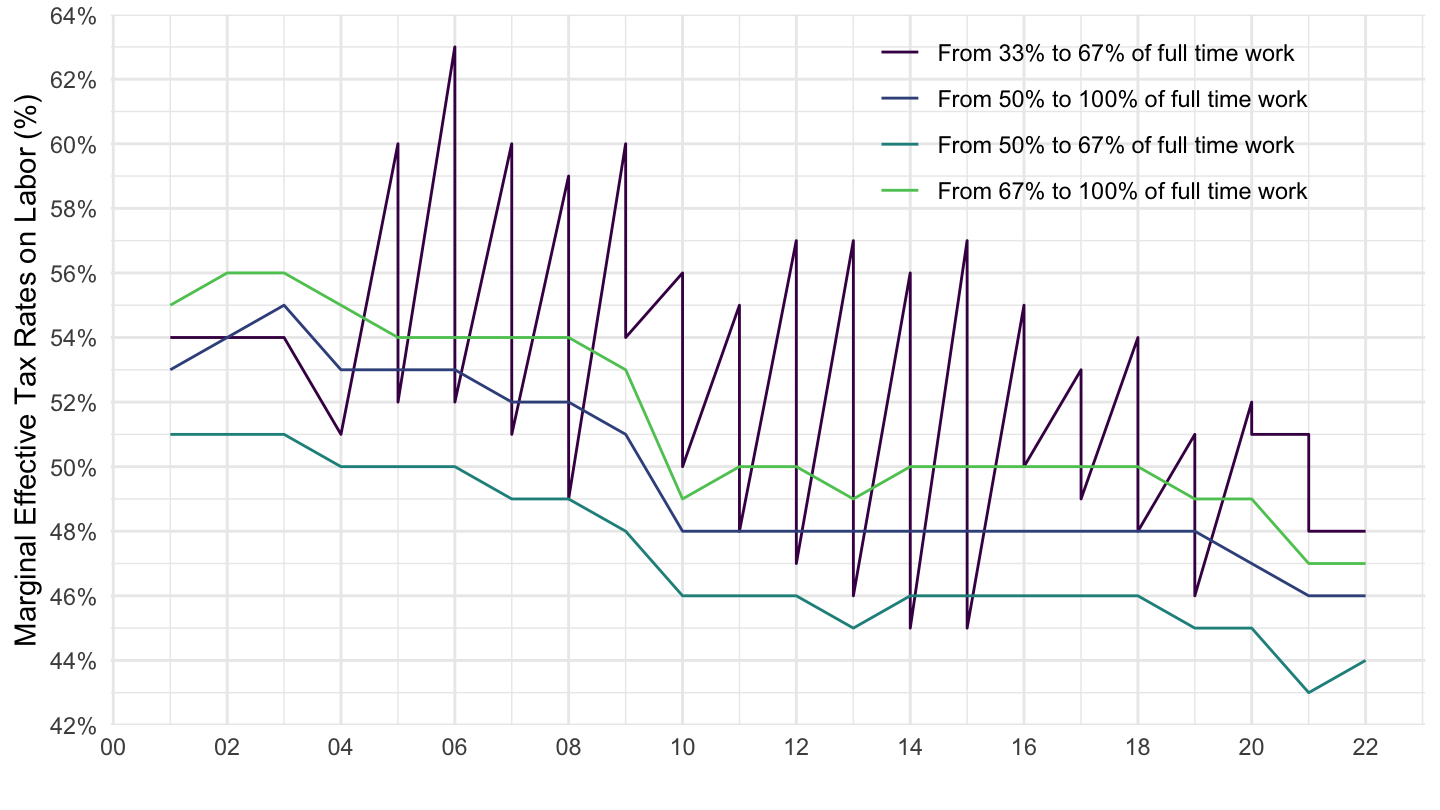
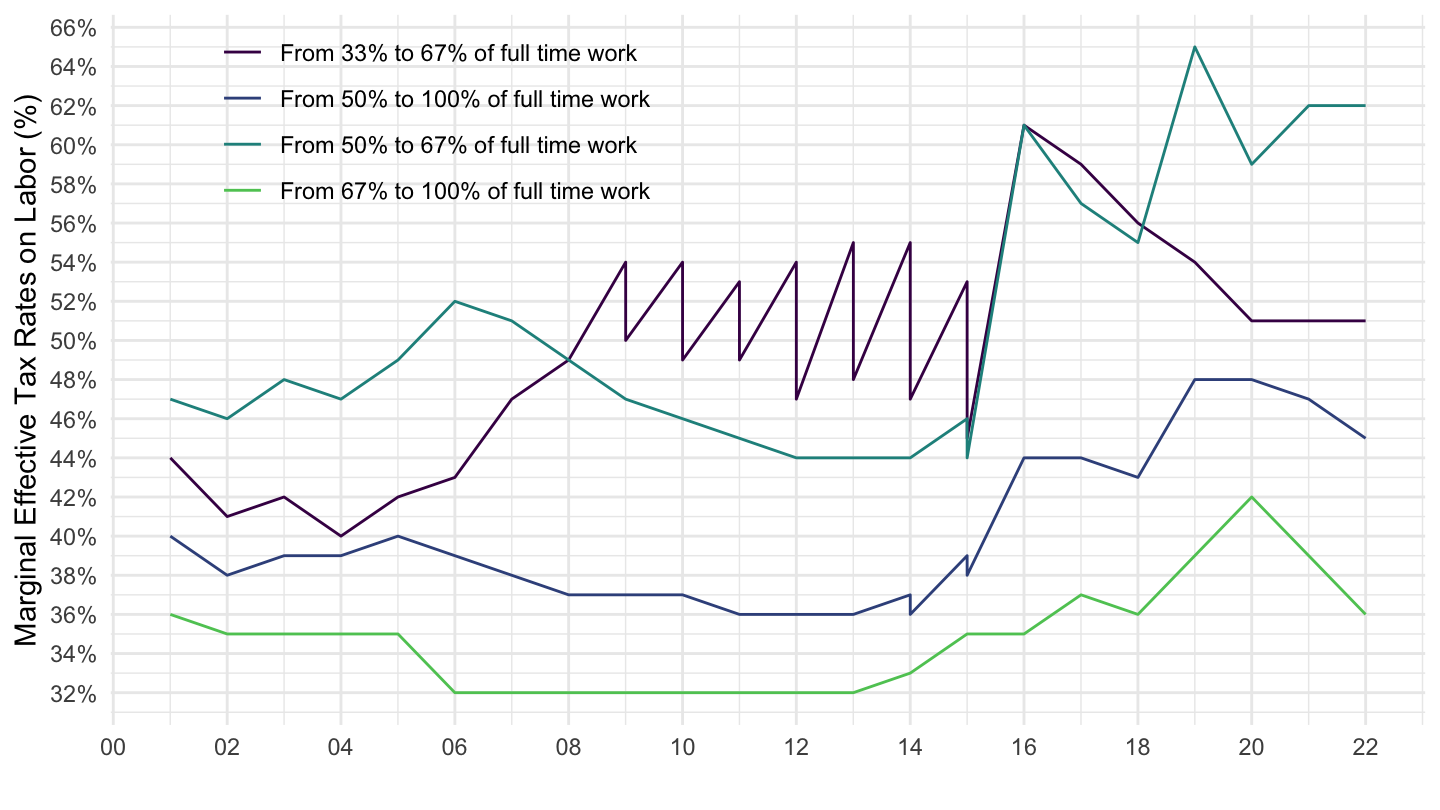
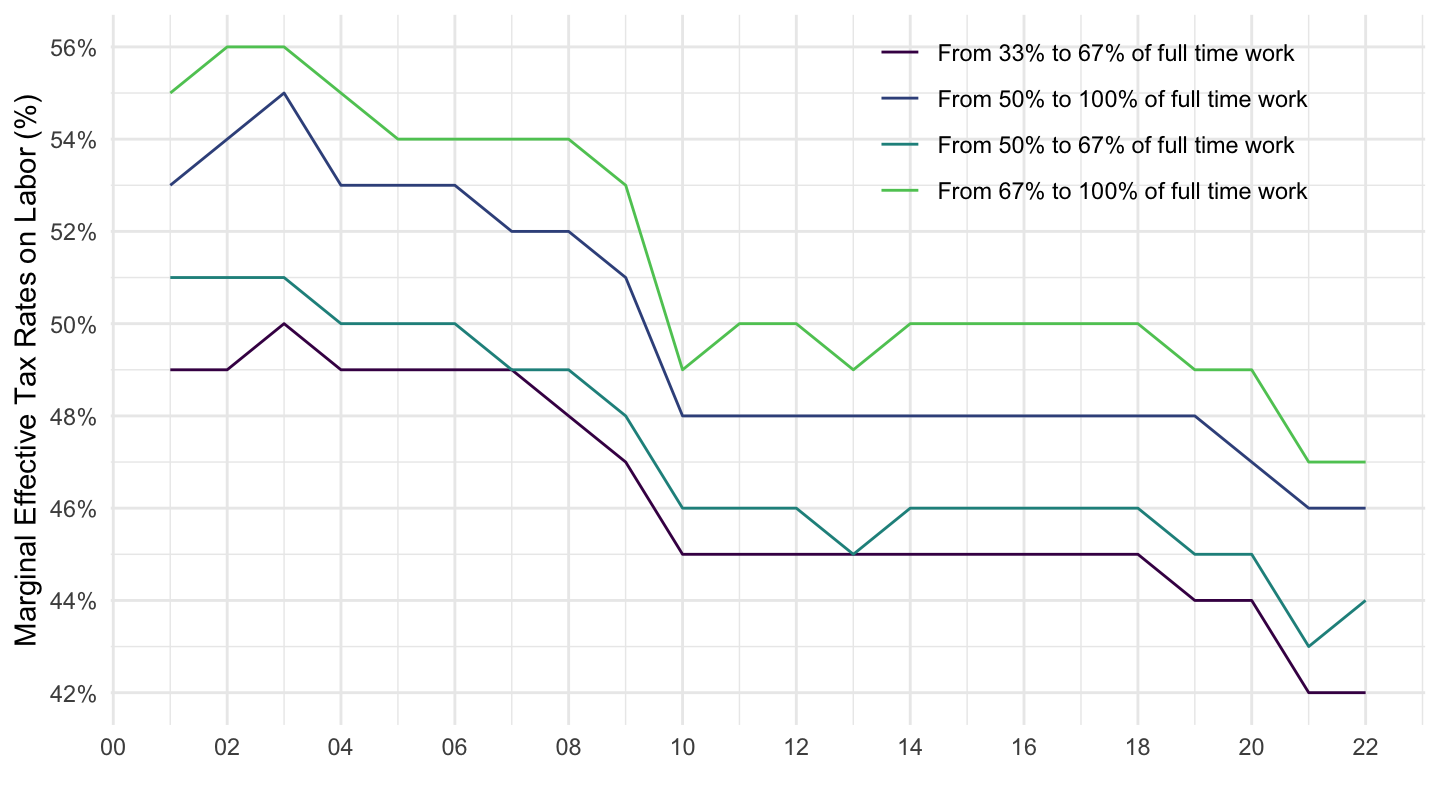
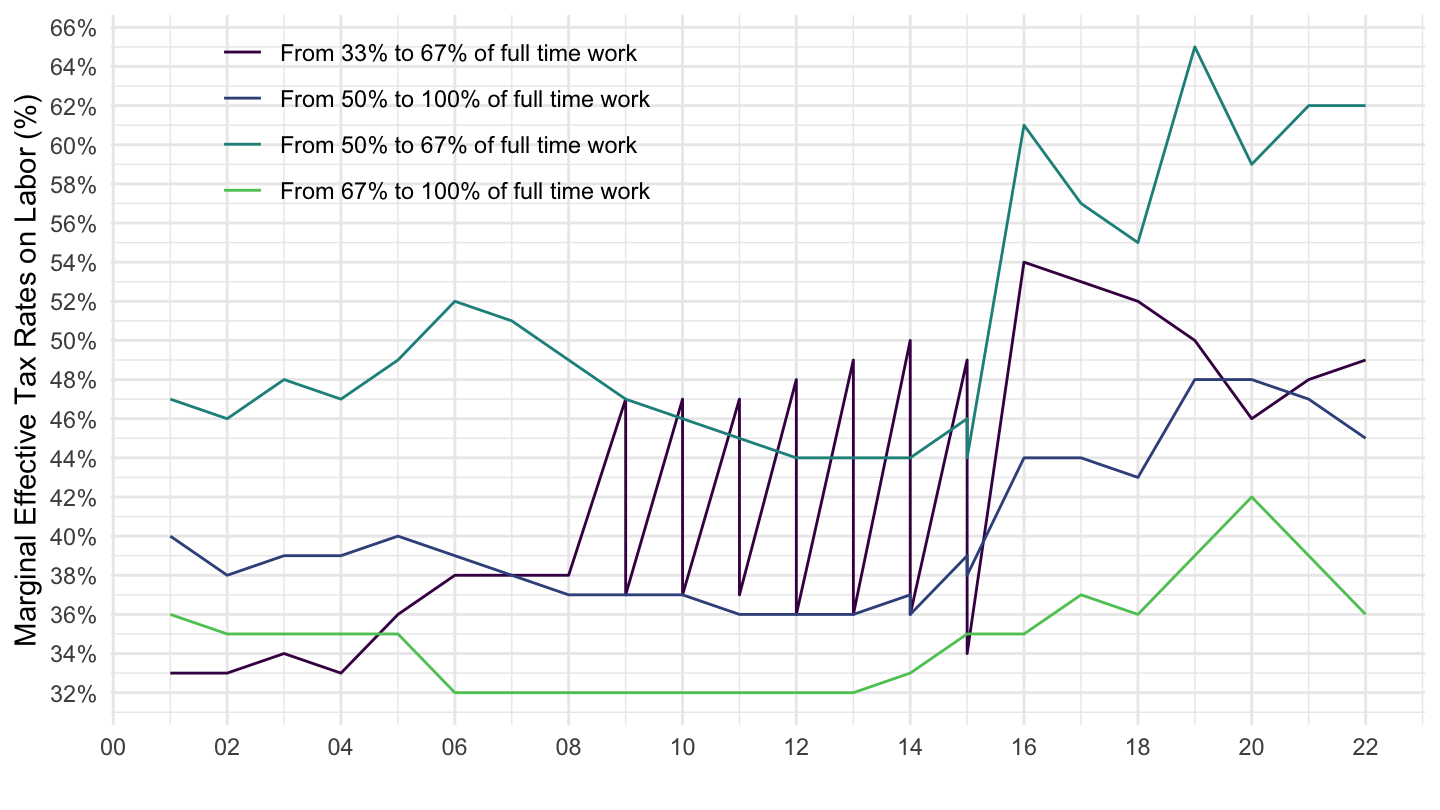
ggplot() + ylab("Marginal Effective Tax Rates on Labor (%)") + xlab("") +
geom_line(aes(x = date, y = obsValue, color = Transition)) + theme_minimal() +
scale_color_manual(values = viridis(5)[1:4]) +
scale_x_date(breaks = seq(1920, 2025, 2) %>% paste0("-01-01") %>% as.Date,
labels = date_format("%y")) +
theme(legend.position = c(0.75, 0.85),
legend.title = element_blank()) +
scale_y_continuous(breaks = 0.01*seq(0, 100, 2),
labels = percent_format(accuracy = 1))