Code
HISTPOP %>%
  left_join(HISTPOP_var$SEX, by = "SEX") %>%
  group_by(SEX, Sex) %>%
  summarise(Nobs = n()) %>%
  arrange(-Nobs) %>%
print_table_conditional| SEX | Sex | Nobs |
|---|---|---|
| M | Men | 126728 |
| T | Total | 126728 |
| W | Women | 126728 |
Data - OECD
HISTPOP %>%
left_join(HISTPOP_var$SEX, by = "SEX") %>%
group_by(SEX, Sex) %>%
summarise(Nobs = n()) %>%
arrange(-Nobs) %>%
print_table_conditional| SEX | Sex | Nobs |
|---|---|---|
| M | Men | 126728 |
| T | Total | 126728 |
| W | Women | 126728 |
HISTPOP %>%
  left_join(HISTPOP_var$AGE, by = "AGE") %>%
  group_by(AGE, Age) %>%
  summarise(Nobs = n()) %>%
  arrange(-Nobs) %>%
print_table_conditionalHISTPOP %>%
left_join(HISTPOP_var$LOCATION, by = "LOCATION") %>%
group_by(LOCATION, Location) %>%
summarise(Nobs = n()) %>%
arrange(-Nobs) %>%
mutate(Flag = gsub(" ", "-", str_to_lower(gsub(" ", "-", Location))),
Flag = paste0('<img src="../../icon/flag/vsmall/', Flag, '.png" alt="Flag">')) %>%
select(Flag, everything()) %>%
{if (is_html_output()) datatable(., filter = 'top', rownames = F, escape = F) else .}HISTPOP %>%
group_by(obsTime) %>%
summarise(Nobs = n()) %>%
arrange(desc(obsTime)) %>%
print_table_conditionalHISTPOP %>%
filter(LOCATION == c("FRA", "DEU", "ITA"),
SEX == "T",
AGE %in% c("OAD20-64")) %>%
left_join(HISTPOP_var$LOCATION, by = "LOCATION") %>%
year_to_date %>%
ggplot + theme_minimal() + xlab("") + ylab("Old Age Dependancy Ratio") +
geom_line(aes(x = date, y = obsValue, color = Location)) +
scale_x_date(breaks = seq(1960, 2100, 5) %>% paste0("-01-01") %>% as.Date,
labels = date_format("%Y")) +
scale_y_continuous(breaks = 0.01*seq(0, 100, 5),
labels = percent_format(acc = 1)) +
theme(legend.position = c(0.7, 0.80),
legend.title = element_blank())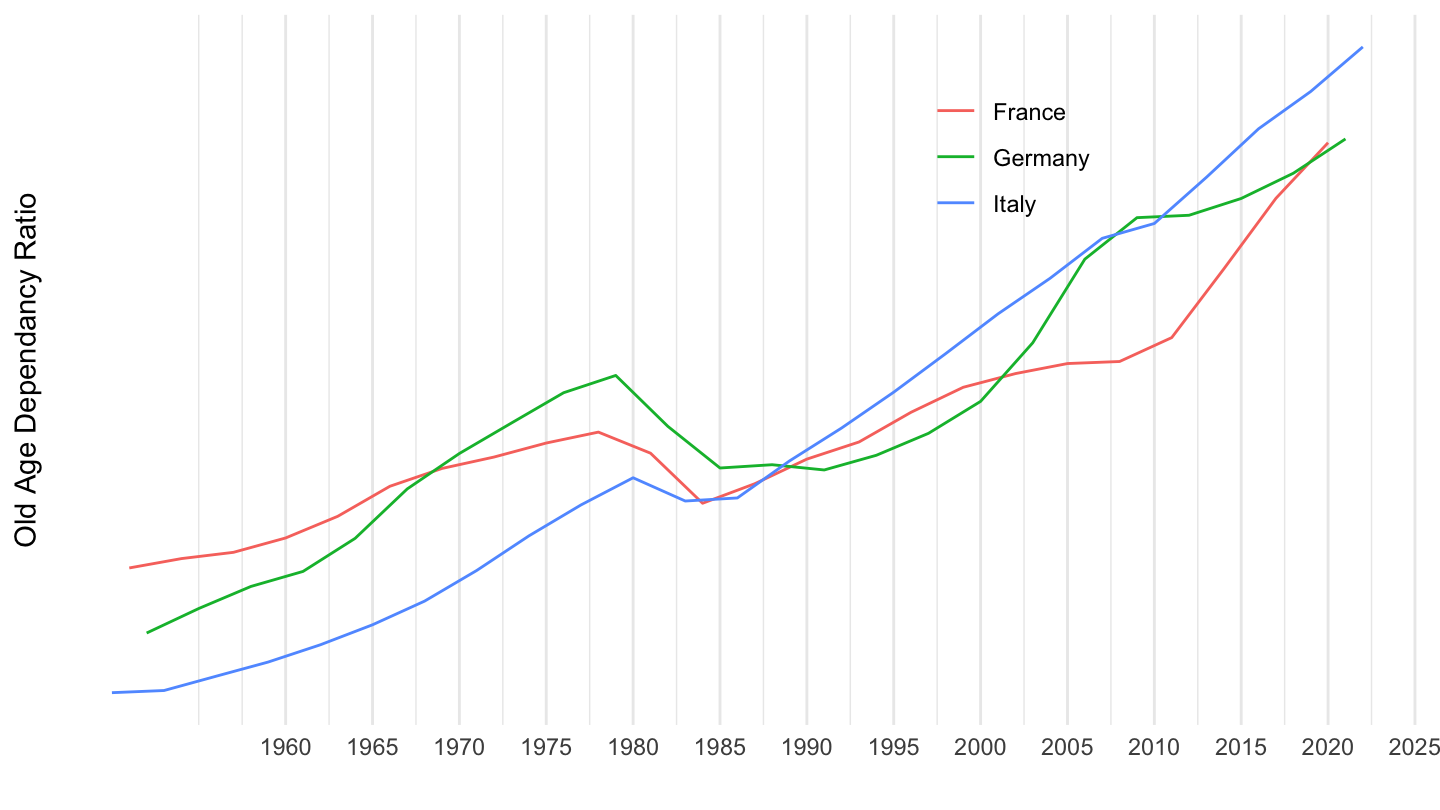
HISTPOP %>%
  filter(LOCATION == c("USA", "GBR", "NZL"),
         SEX == "T",
         AGE %in% c("OAD20-64")) %>%
  left_join(HISTPOP_var$LOCATION, by = "LOCATION") %>%
  year_to_date %>%
  ggplot + theme_minimal() + xlab("") + ylab("Old Age Dependancy Ratio") +
  geom_line(aes(x = date, y = obsValue, color = Location)) +
  scale_x_date(breaks = seq(1960, 2100, 5) %>% paste0("-01-01") %>% as.Date,
               labels = date_format("%Y")) +
  scale_y_continuous(breaks = 0.01*seq(0, 100, 2),
                     labels = percent_format(acc = 1)) +

  theme(legend.position = c(0.7, 0.80),
        legend.title = element_blank())
HISTPOP %>%
  filter(LOCATION == c("FRA", "DEU", "ITA"),
         SEX == "T",
         AGE %in% c("15-64_SHARE")) %>%
  left_join(HISTPOP_var$LOCATION, by = "LOCATION") %>%
  year_to_date %>%
  ggplot + theme_minimal() + xlab("") + ylab("Old Age Dependancy Ratio") +
  geom_line(aes(x = date, y = obsValue/100, color = Location)) +
  scale_x_date(breaks = seq(1940, 2100, 5) %>% paste0("-01-01") %>% as.Date,
               labels = date_format("%Y")) +
  scale_y_continuous(breaks = 0.01*seq(0, 100, 1),
                     labels = percent_format(acc = 1)) +

  theme(legend.position = c(0.9, 0.80),
        legend.title = element_blank())
HISTPOP %>%
  filter(LOCATION == c("USA", "GBR", "NZL"),
         SEX == "T",
         AGE %in% c("15-64_SHARE")) %>%
  left_join(HISTPOP_var$LOCATION, by = "LOCATION") %>%
  year_to_date %>%
  ggplot + theme_minimal() + xlab("") + ylab("Old Age Dependancy Ratio") +
  geom_line(aes(x = date, y = obsValue/100, color = Location)) +
  scale_x_date(breaks = seq(1940, 2100, 5) %>% paste0("-01-01") %>% as.Date,
               labels = date_format("%Y")) +
  scale_y_continuous(breaks = 0.01*seq(0, 100, 1),
                     labels = percent_format(acc = 1)) +

  theme(legend.position = c(0.8, 0.2),
        legend.title = element_blank())
HISTPOP %>%
  filter(LOCATION == c("FRA", "DEU", "ITA"),
         SEX == "T",
         AGE %in% c("15-24_SHARE")) %>%
  left_join(HISTPOP_var$LOCATION, by = "LOCATION") %>%
  year_to_date %>%
  ggplot + theme_minimal() + xlab("") + ylab("Share of 15 to 24 - youth") +
  geom_line(aes(x = date, y = obsValue/100, color = Location)) +
  scale_x_date(breaks = seq(1940, 2100, 5) %>% paste0("-01-01") %>% as.Date,
               labels = date_format("%Y")) +
  scale_y_continuous(breaks = 0.01*seq(0, 100, 1),
                     labels = percent_format(acc = 1)) +

  theme(legend.position = c(0.9, 0.80),
        legend.title = element_blank())
HISTPOP %>%
  filter(LOCATION == c("USA", "GBR", "NZL"),
         SEX == "T",
         AGE %in% c("15-24_SHARE")) %>%
  left_join(HISTPOP_var$LOCATION, by = "LOCATION") %>%
  year_to_date %>%
  ggplot + theme_minimal() + xlab("") + ylab("Share of 15 to 24 - youth") +
  geom_line(aes(x = date, y = obsValue/100, color = Location)) +
  scale_x_date(breaks = seq(1940, 2100, 5) %>% paste0("-01-01") %>% as.Date,
               labels = date_format("%Y")) +
  scale_y_continuous(breaks = 0.01*seq(0, 100, 1),
                     labels = percent_format(acc = 1)) +

  theme(legend.position = c(0.8, 0.8),
        legend.title = element_blank())
HISTPOP %>%
  filter(LOCATION == c("FRA", "DEU", "ITA"),
         SEX == "T",
         AGE %in% c("LESS_15_SHARE")) %>%
  left_join(HISTPOP_var$LOCATION, by = "LOCATION") %>%
  year_to_date %>%
  ggplot + theme_minimal() + xlab("") + ylab("Share of under 15 - children") +
  geom_line(aes(x = date, y = obsValue/100, color = Location)) +
  scale_x_date(breaks = seq(1940, 2100, 5) %>% paste0("-01-01") %>% as.Date,
               labels = date_format("%Y")) +
  scale_y_continuous(breaks = 0.01*seq(0, 100, 1),
                     labels = percent_format(acc = 1)) +

  theme(legend.position = c(0.9, 0.80),
        legend.title = element_blank())
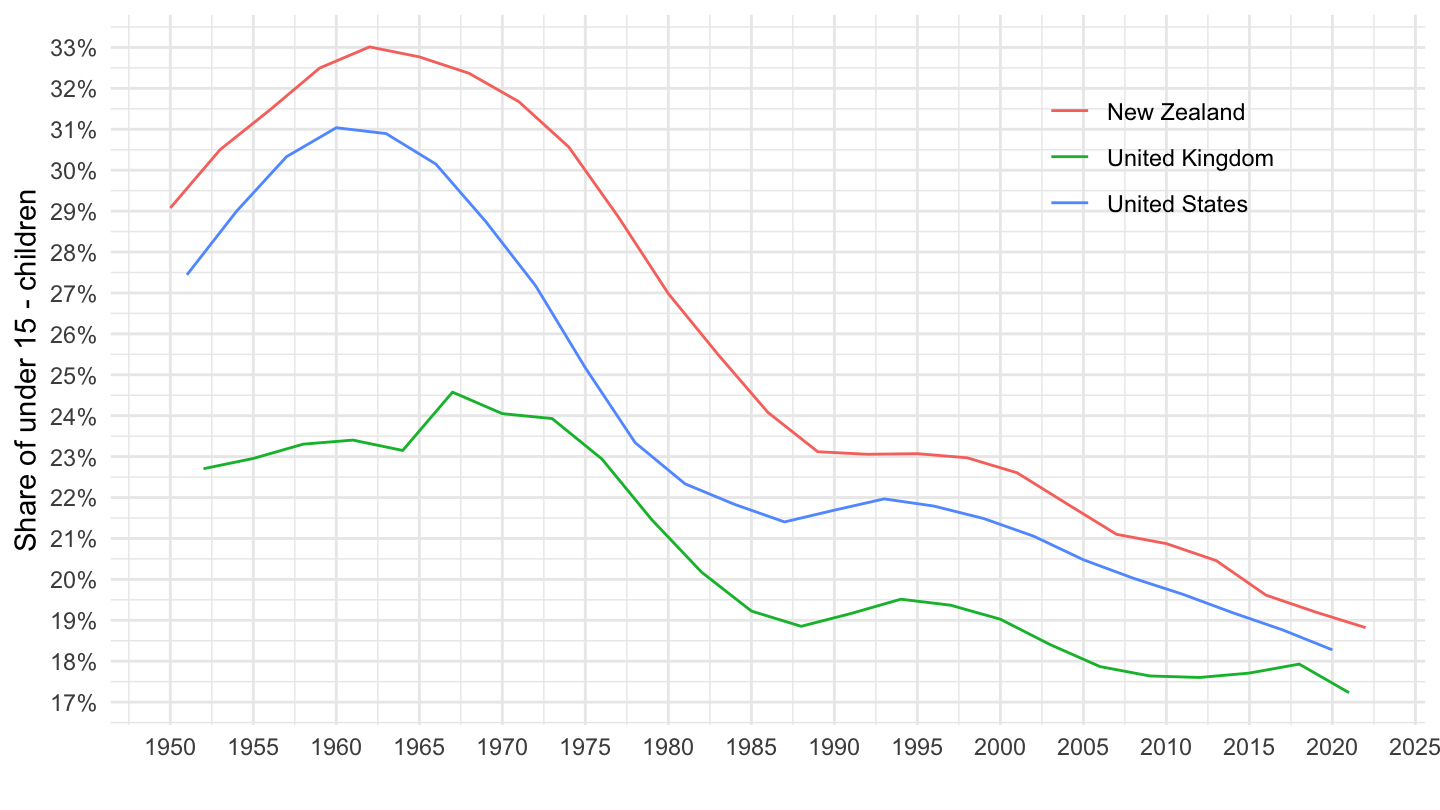
HISTPOP %>%
  filter(LOCATION == c("USA", "GBR", "NZL"),
         SEX == "T",
         AGE %in% c("LESS_15_SHARE")) %>%
  left_join(HISTPOP_var$LOCATION, by = "LOCATION") %>%
  year_to_date %>%
  ggplot + theme_minimal() + xlab("") + ylab("Share of under 15 - children") +
  geom_line(aes(x = date, y = obsValue/100, color = Location)) +
  scale_x_date(breaks = seq(1940, 2100, 5) %>% paste0("-01-01") %>% as.Date,
               labels = date_format("%Y")) +
  scale_y_continuous(breaks = 0.01*seq(0, 100, 1),
                     labels = percent_format(acc = 1)) +

  theme(legend.position = c(0.8, 0.8),
        legend.title = element_blank())