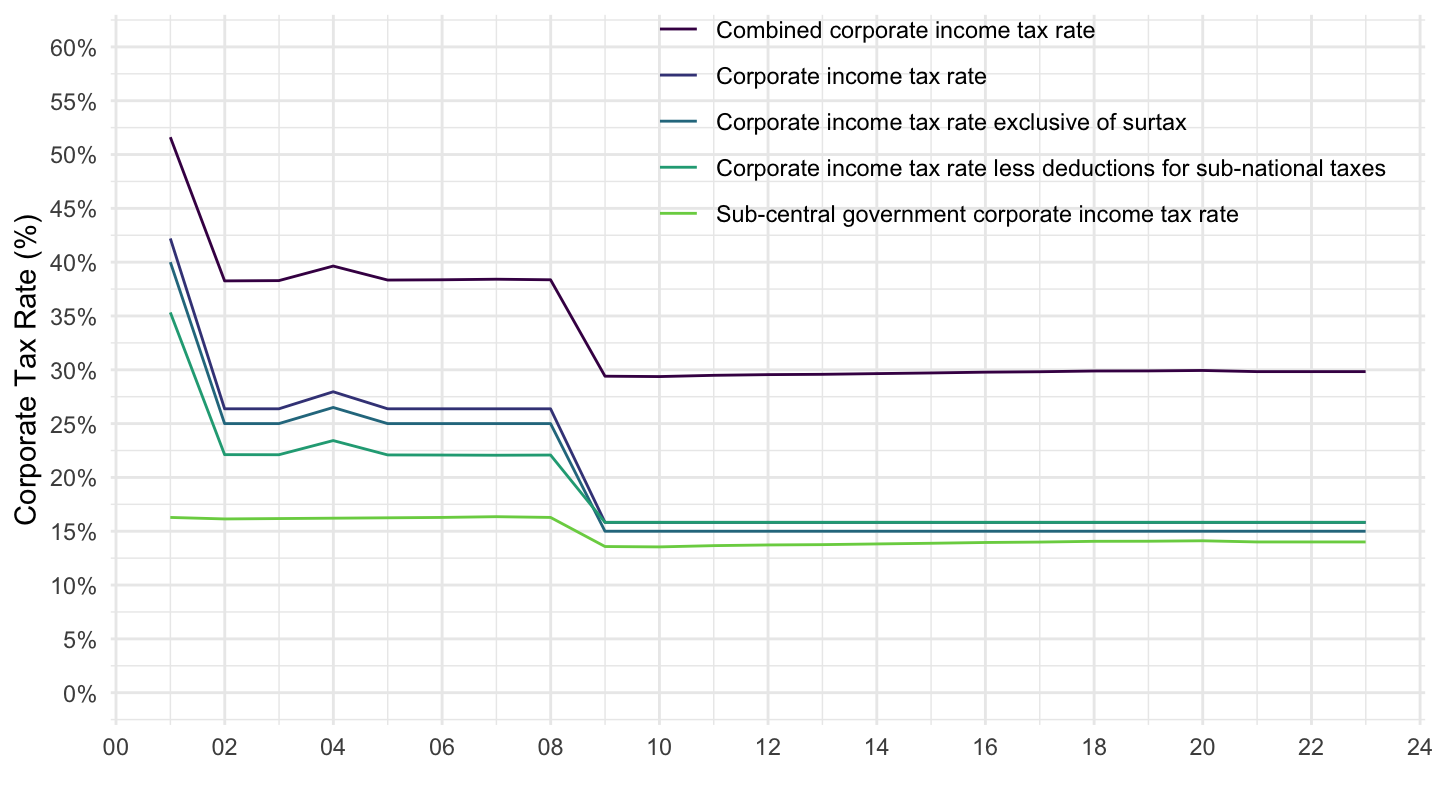
Statutory Corporate Income Tax Rates - CTS_CIT

Data - OECD


CORP_TAX

Code
CTS_CIT %>%
  left_join(CTS_CIT_var$CORP_TAX %>%
              setNames(c("CORP_TAX", "Corp_tax")), by = "CORP_TAX") %>%
  group_by(CORP_TAX, Corp_tax) %>%
  summarise(Nobs = n()) %>%
  arrange(-Nobs) %>%
  {if (is_html_output()) print_table(.) else .}
CORP_TAX Corp_tax Nobs
CIT_RATE Corporate income tax rate 2710
COMB_CIT_RATE Combined corporate income tax rate 2710
CIT_RATE_LESS_SUB_NAT Corporate income tax rate less deductions for sub-national taxes 2687
SUB_CENT_GOV_CIT_RATE Sub-central government corporate income tax rate 236
CIT_RATE_EXCL_SURTAX Corporate income tax rate exclusive of surtax 215

COU

Code
CTS_CIT %>%
  left_join(CTS_CIT_var$COU %>%
              setNames(c("COU", "Cou")), by = "COU") %>%
  group_by(COU, Cou) %>%
  summarise(Nobs = n()) %>%
  arrange(-Nobs) %>%
  {if (is_html_output()) datatable(., filter = 'top', rownames = F) else .}

Ex: Corporate Tax

Germany

Code
CTS_CIT %>%
  filter(COU == "DEU") %>%
  year_to_enddate() %>%
  left_join(CTS_CIT_var$CORP_TAX %>%
              setNames(c("CORP_TAX", "Corp_tax")), by = "CORP_TAX") %>%
  ggplot() + theme_minimal() + ylab("Corporate Tax Rate (%)") + xlab("") +
  geom_line(aes(x = date, y = obsValue/100, color = Corp_tax)) +
  scale_color_manual(values = viridis(6)[1:5]) +
  scale_x_date(breaks = seq(1920, 2025, 2) %>% paste0("-01-01") %>% as.Date,
               labels = date_format("%y")) +
  theme(legend.position = c(0.7, 0.85),
        legend.title = element_blank()) +
  scale_y_continuous(breaks = 0.01*seq(0, 60, 5),
                     labels = percent_format(accuracy = 1),
                     limits = c(0, 0.6))

France

Code
CTS_CIT %>%
  filter(COU == "FRA") %>%
  year_to_enddate() %>%
  left_join(CTS_CIT_var$CORP_TAX %>%
              setNames(c("CORP_TAX", "Corp_tax")), by = "CORP_TAX") %>%
  ggplot() + theme_minimal() + ylab("Corporate Tax Rate (%)") + xlab("") +
  geom_line(aes(x = date, y = obsValue/100, color = Corp_tax)) +
  scale_color_manual(values = viridis(6)[1:5]) +
  scale_x_date(breaks = seq(1920, 2025, 2) %>% paste0("-01-01") %>% as.Date,
               labels = date_format("%y")) +
  theme(legend.position = c(0.65, 0.85),
        legend.title = element_blank()) +
  scale_y_continuous(breaks = 0.01*seq(0, 60, 5),
                     labels = percent_format(accuracy = 1),
                     limits = c(0, 0.6))

United States

Code
CTS_CIT %>%
  filter(COU == "USA") %>%
  year_to_enddate() %>%
  left_join(CTS_CIT_var$CORP_TAX %>%
              setNames(c("CORP_TAX", "Corp_tax")), by = "CORP_TAX") %>%
  ggplot() + theme_minimal() + ylab("Corporate Tax Rate (%)") + xlab("") +
  geom_line(aes(x = date, y = obsValue/100, color = Corp_tax)) +
  scale_color_manual(values = viridis(6)[1:5]) +
  scale_x_date(breaks = seq(1920, 2025, 2) %>% paste0("-01-01") %>% as.Date,
               labels = date_format("%y")) +
  theme(legend.position = c(0.65, 0.85),
        legend.title = element_blank()) +
  scale_y_continuous(breaks = 0.01*seq(0, 60, 5),
                     labels = percent_format(accuracy = 1),
                     limits = c(0, 0.6))

Luxembourg

Code
CTS_CIT %>%
  filter(COU == "LUX") %>%
  year_to_enddate() %>%
  left_join(CTS_CIT_var$CORP_TAX %>%
              setNames(c("CORP_TAX", "Corp_tax")), by = "CORP_TAX") %>%
  ggplot() + theme_minimal() + ylab("Corporate Tax Rate (%)") + xlab("") +
  geom_line(aes(x = date, y = obsValue/100, color = Corp_tax)) +
  scale_color_manual(values = viridis(6)[1:5]) +
  scale_x_date(breaks = seq(1920, 2025, 2) %>% paste0("-01-01") %>% as.Date,
               labels = date_format("%y")) +
  theme(legend.position = c(0.65, 0.85),
        legend.title = element_blank()) +
  scale_y_continuous(breaks = 0.01*seq(0, 60, 5),
                     labels = percent_format(accuracy = 1),
                     limits = c(0, 0.6))

Japan

Code
CTS_CIT %>%
  filter(COU == "JPN") %>%
  year_to_enddate() %>%
  left_join(CTS_CIT_var$CORP_TAX %>%
              setNames(c("CORP_TAX", "Corp_tax")), by = "CORP_TAX") %>%
  ggplot() + theme_minimal() + ylab("Corporate Tax Rate (%)") + xlab("") +
  geom_line(aes(x = date, y = obsValue/100, color = Corp_tax)) +
  scale_color_manual(values = viridis(6)[1:5]) +
  scale_x_date(breaks = seq(1920, 2025, 2) %>% paste0("-01-01") %>% as.Date,
               labels = date_format("%y")) +
  theme(legend.position = c(0.65, 0.85),
        legend.title = element_blank()) +
  scale_y_continuous(breaks = 0.01*seq(0, 60, 5),
                     labels = percent_format(accuracy = 1),
                     limits = c(0, 0.6))