
Last data update: 15 oct. 2026, 23:24
Last compile: 15 oct. 2026, 23:24
DPE_m2 |>
print_table_conditional()| taille | A | B | C | D | E | F | G | TOTAL |
|---|---|---|---|---|---|---|---|---|
| - de 30m2 | 8 | 32 | 90 | 284 | 317 | 227 | 183 | 1142 |
| De 30 à 60m2 | 95 | 277 | 836 | 1943 | 1488 | 764 | 514 | 5917 |
| De 60 à 100m2 | 244 | 659 | 2539 | 4756 | 3325 | 1386 | 671 | 13579 |
| Plus de 100m2 | 172 | 404 | 1696 | 2809 | 1862 | 699 | 341 | 7983 |
DPE_m2 |>
  gather(DPE, value, -taille) |>
  group_by(taille) |>
  mutate(value = value/value[DPE == "TOTAL"]) |>
  filter(DPE != "TOTAL") |>
  ggplot() + geom_line(aes(x = DPE, y = value, linetype = taille, group = taille)) +
  theme_minimal() + xlab("") + ylab("") +
  scale_y_continuous(breaks = 0.01*seq(-30, 50, 5),
                     labels = percent_format(accuracy = 1)) +
  theme(legend.position = c(0.15, 0.8),
        legend.title = element_blank()) +
  theme(axis.text.x = element_text(size = 15, colour = c("#339a33", "#33cc33", "#ccff33",
                                              "#ffff00", "#ffcc00", "#ff9a33", "#ff0000"))) +
  geom_vline(xintercept = "A", color = "#339a33", linetype = "dashed") +
  geom_vline(xintercept = "B", color = "#33cc33", linetype = "dashed") +
  geom_vline(xintercept = "C", color = "#ccff33", linetype = "dashed") +
  geom_vline(xintercept = "D", color = "#ffff00", linetype = "dashed") +
  geom_vline(xintercept = "E", color = "#ffcc00", linetype = "dashed") +
  geom_vline(xintercept = "F", color = "#ff9a33", linetype = "dashed") +
  geom_vline(xintercept = "G", color = "#ff0000", linetype = "dashed")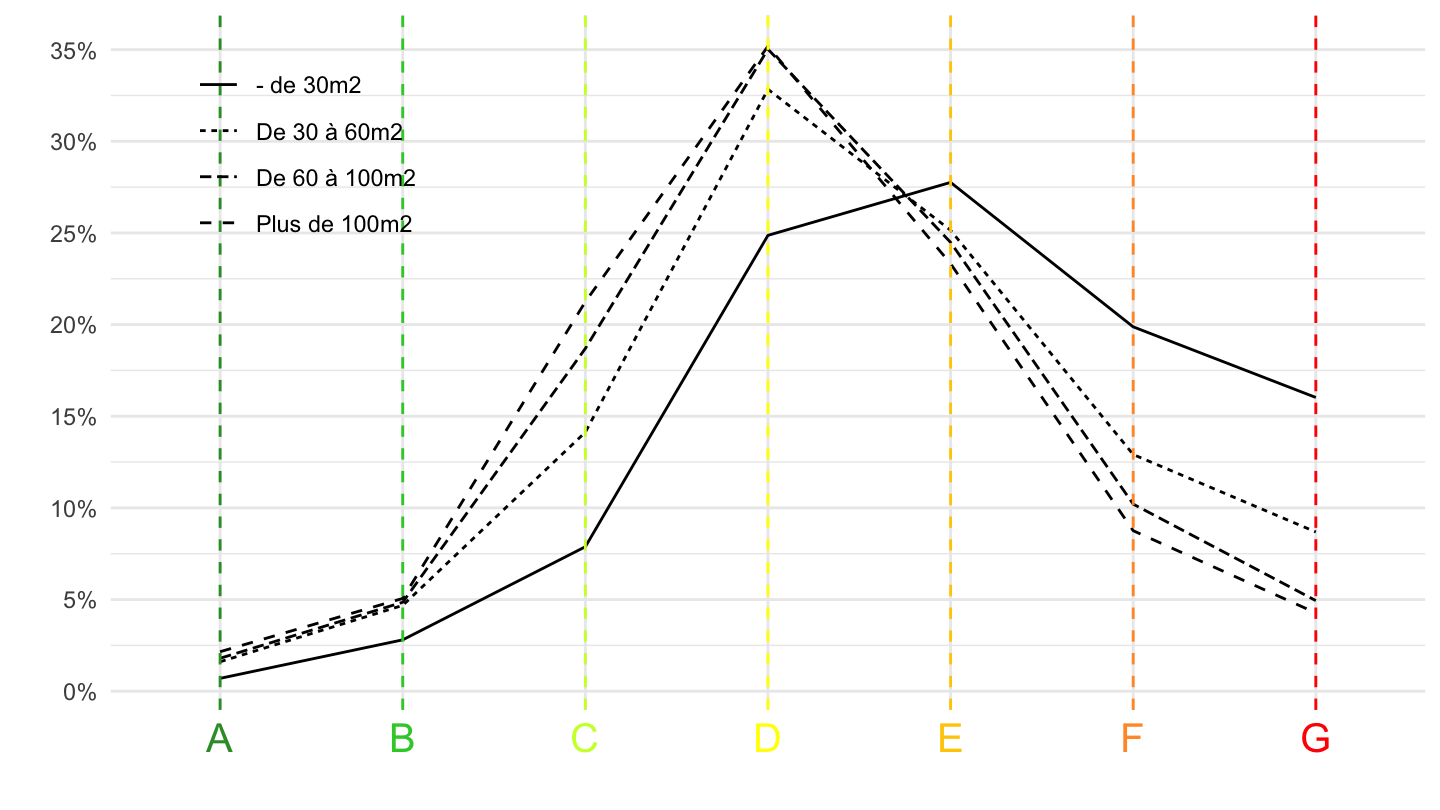
DPE_m2 |>
  gather(DPE, value, -taille) |>
  mutate(taille2 = ifelse(taille == "- de 30m2", "Moins de 30m2", "Plus de 30m2")) |>
  group_by(taille2, DPE) |>
  summarise(value = sum(value)) |>
  group_by(taille2) |>
  mutate(value = value/value[DPE == "TOTAL"]) |>
  filter(DPE != "TOTAL") |>
  ggplot() + geom_line(aes(x = DPE, y = value, linetype = taille2, group = taille2)) +
  theme_minimal() + xlab("") + ylab("") +
  scale_y_continuous(breaks = 0.01*seq(-30, 50, 5),
                     labels = percent_format(accuracy = 1)) +
  theme(legend.position = c(0.15, 0.8),
        legend.title = element_blank()) +
  theme(axis.text.x = element_text(size = 15, colour = c("#339a33", "#33cc33", "#ccff33",
                                                         "#ffff00", "#ffcc00", "#ff9a33", "#ff0000"))) +
  geom_vline(xintercept = "A", color = "#339a33", linetype = "dashed") +
  geom_vline(xintercept = "B", color = "#33cc33", linetype = "dashed") +
  geom_vline(xintercept = "C", color = "#ccff33", linetype = "dashed") +
  geom_vline(xintercept = "D", color = "#ffff00", linetype = "dashed") +
  geom_vline(xintercept = "E", color = "#ffcc00", linetype = "dashed") +
  geom_vline(xintercept = "F", color = "#ff9a33", linetype = "dashed") +
  geom_vline(xintercept = "G", color = "#ff0000", linetype = "dashed")