Institut des Politiques Publiques - ipp
Données - IPP
List of Main Datasets
Javascript
Flat
Code
source_dataset_table("ipp") %>%
  {if (is_html_output()) mutate(., Updated = paste0("[", Updated, "](https://fgeerolf.com/data/ipp/",id, ".html)")) else .} %>%
{if (is_html_output()) print_table(.) else .}| id | Title | Updated | Nobs |
|---|---|---|---|
| bareme_ir | Barême de l'Impôt sur le Revenu | [2026-08-01] | https: |
| crds | Contribution au remboursement de la dette sociale (CRDS) (depuis 1996) | [2026-08-01] | https: |
| indicefp | Point d'indice de la fonction publique | [2026-08-11] | https: |
| ret_etat | Contribution employeur à la charge de l'Etat | [2026-08-01] | https: |
| revalorisation_pension | Revalorisation du Régime général de la caisse nationale d'assurance vieillesse (CNAV) | [2026-08-01] | https: |
| taux_de_tva | Taux de TVA | [2026-08-01] | https: |
List of All Datasets
Javascript
Prestations sociales
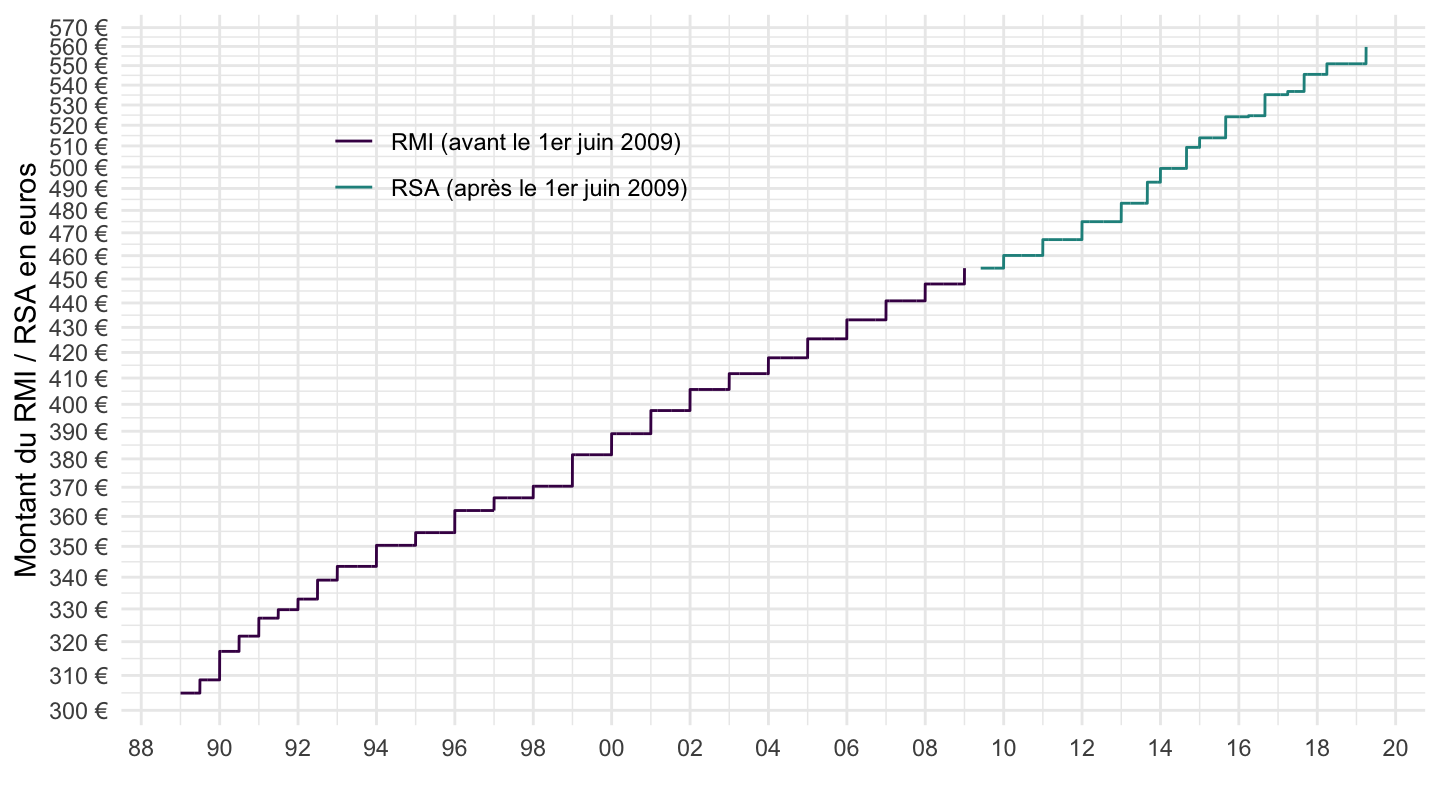
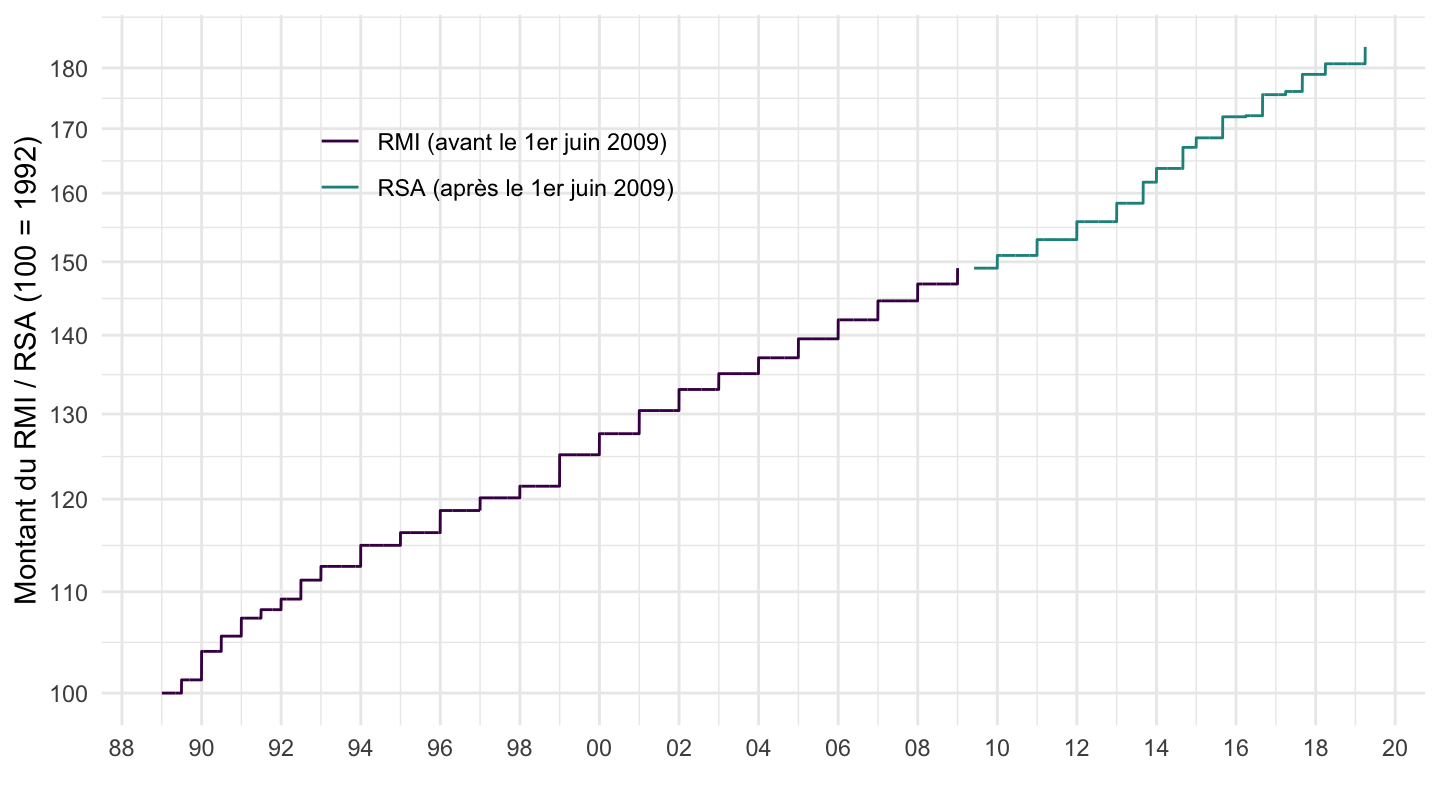
RMI / RSA
Montant en €
Code
ig_d("ipp", "prestations-sociales", "rmi-rsa")| Source | Dataset | Updated | PNG | |
|---|---|---|---|---|
RMI / RSA
Code
ig_d("ipp", "prestations-sociales", "rmi-rsa-base-100")| Source | Dataset | Updated | PNG | |
|---|---|---|---|---|
Taux de TVA (1954-2014)
Code
taux_de_tva |>
  select(1:4) %>%
  {if (is_html_output()) datatable(., filter = 'top', rownames = F) else .}
Code
taux_de_tva |>
  select(date, taux_reduit = `Taux réduit`, taux_normal = `Taux normal`) |>
  arrange(date) %>%
  add_row(date = Sys.Date(), taux_reduit = last(.[[2]]), taux_normal = last(.[[3]])) |>
  complete(date = seq.Date(min(date), max(date), by = "day")) |>
  fill(taux_normal, taux_reduit) |>
  gather(variable, value, -date) |>
  ggplot() + geom_line(aes(x = date, y = value, color = variable)) +
  theme_minimal() +
  scale_x_date(breaks = seq(1920, 2100, 5) |> paste0("-01-01") |> as.Date(),
               labels = date_format("%Y")) +
  theme(legend.position = c(0.65, 0.6),
        legend.title = element_blank()) +
  scale_y_continuous(breaks = 0.01*seq(0, 50, 1),
                     labels = percent_format(accuracy = 1)) +
  ylab("Tax Rate (%)") + xlab("")
Taux tabac
Code
taux_normaux_tabac |>
  select(-date_parution_jo, -reference) |>
  slice(1, c(1:n())) |>
  mutate(date = ifelse(row_number() == 1, as.Date(Sys.Date()), date),
         date = as.Date(date)) |>
  gather(variable, value, -date) |>
  group_by(variable) |>
  complete(date = seq.Date(min(date), max(date), by = "day")) |>
  fill(value) |>
  ggplot() + geom_line(aes(x = date, y = value, color = variable)) +
  theme_minimal() +
  scale_x_date(breaks = seq(1920, 2100, 5) |> paste0("-01-01") |> as.Date(),
               labels = date_format("%Y")) +
  theme(legend.position = c(0.3, 0.2),
        legend.title = element_blank()) +
  scale_y_continuous(breaks = 0.01*seq(0, 80, 5),
                     labels = percent_format(accuracy = 1),
                     limits = c(0, 0.65)) +
  ylab("Taux normaux tabacs (%)") + xlab("")
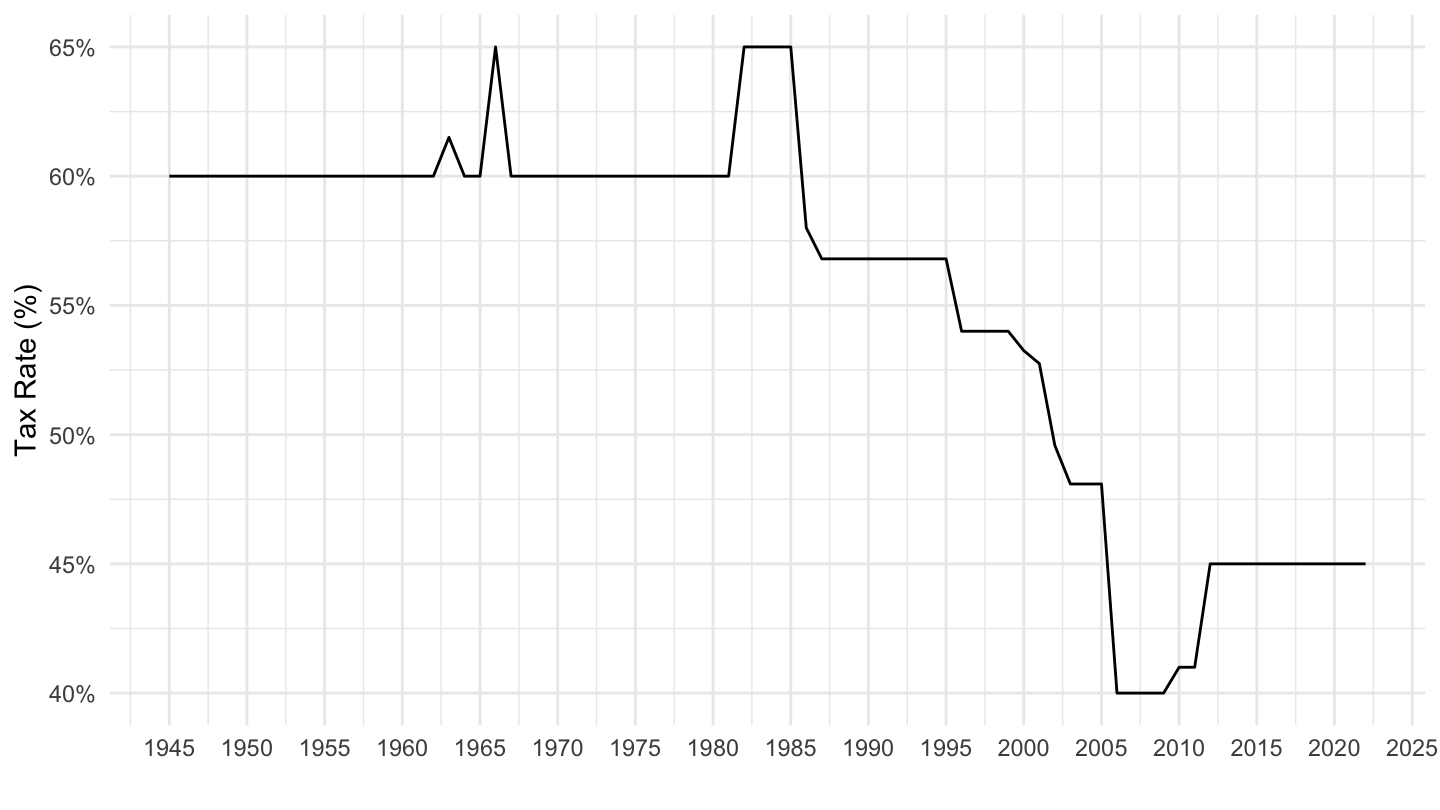
Taux supérieur d’IR
Code
ig_d("ipp", "bareme_ir", "tranches-superieures")| Source | Dataset | Updated | PNG | |
|---|---|---|---|---|
IS
Code
societe_taux_reduit |>
  full_join(societe_taux_normal, by = "date") |>
  full_join(societe_taux_intermediaire, by = "date") |>
  gather(variable, value, -date) |>
  group_by(variable) |>
  complete(date = seq.Date(min(date), max(date), by = "day")) |>
  fill(value) |>
  ggplot() + geom_line(aes(x = date, y = value, color = variable)) +

  theme_minimal() +
  scale_x_date(breaks = seq(1920, 2100, 5) |> paste0("-01-01") |> as.Date(),
               labels = date_format("%Y")) +
  theme(legend.position = c(0.65, 0.8),
        legend.title = element_blank()) +
  scale_y_continuous(breaks = 0.01*seq(0, 80, 5),
                     labels = percent_format(accuracy = 1),
                     limits = c(0, 0.6)) +
  ylab("Impôt sur les Sociétés (%)") + xlab("")
CSG - Activité
Code
csg_activite |>
  select(-date_parution_jo, -reference, -notes) |>
  gather(variable, value, -date) |>
  group_by(variable) |>
  complete(date = seq.Date(min(date), max(date), by = "day")) |>
  fill(value) |>
  ggplot() + geom_line(aes(x = date, y = value, color = variable)) +

  theme_minimal() +
  scale_x_date(breaks = seq(1920, 2100, 5) |> paste0("-01-01") |> as.Date(),
               labels = date_format("%Y")) +
  theme(legend.position = c(0.3, 0.8),
        legend.title = element_blank()) +
  scale_y_continuous(breaks = 0.01*seq(0, 80, 1),
                     labels = percent_format(accuracy = 1)) +
  ylab("CSG Activité (%)") + xlab("")
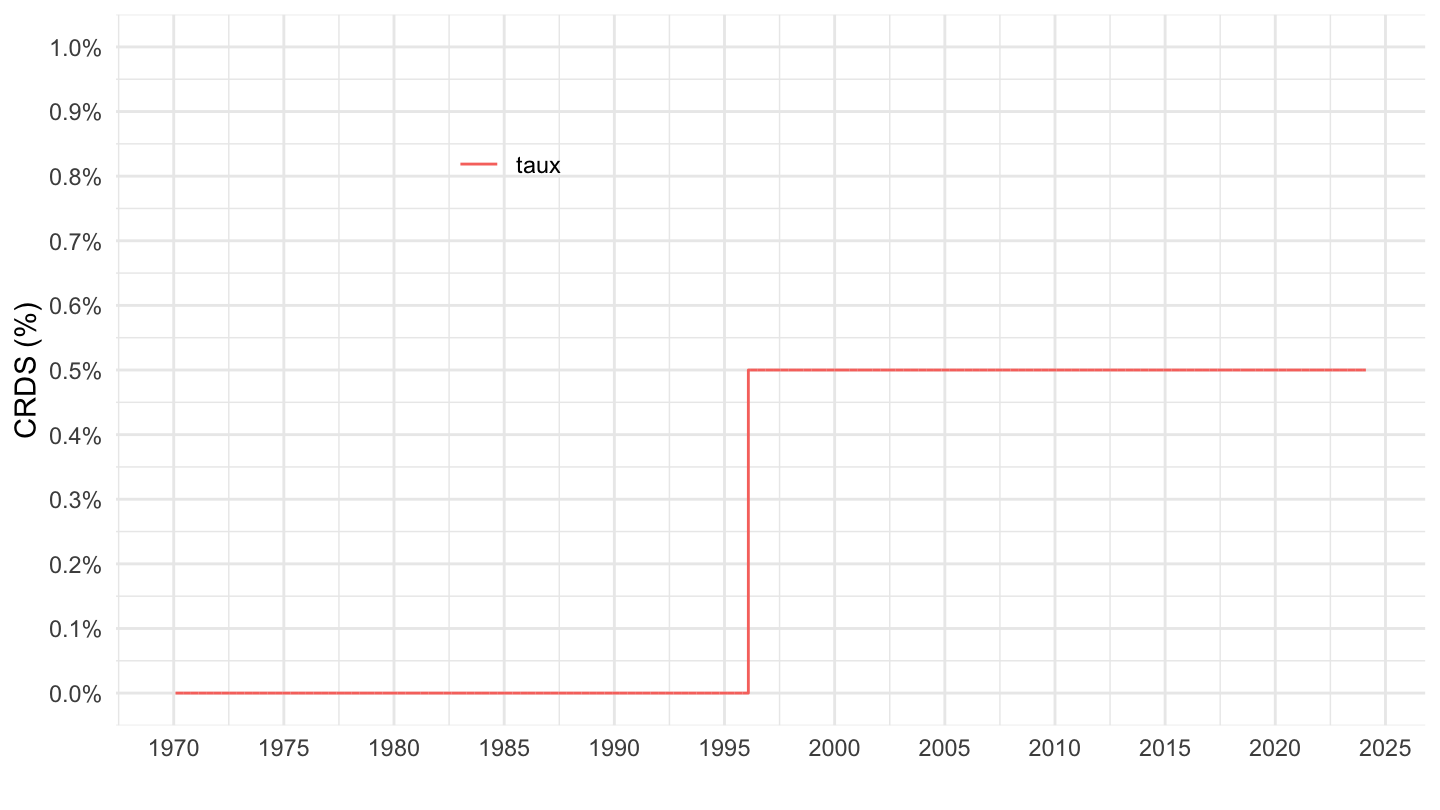
CRDS
Code
ig_d("ipp", "crds", "crds")| Source | Dataset | Updated | PNG | |
|---|---|---|---|---|
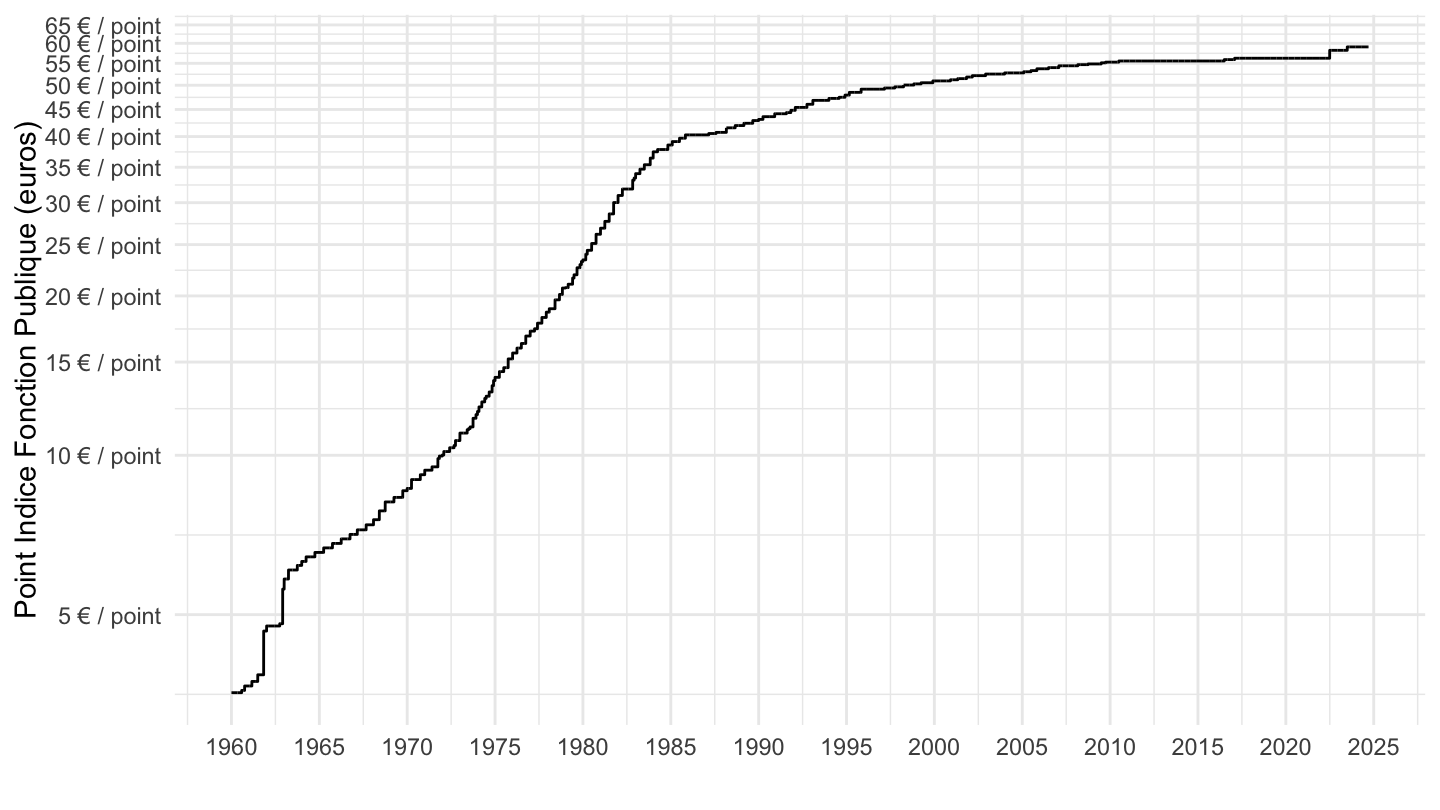
Indice Fonction Publique
All
Valeur
Code
ig_d("ipp", "indicefp", "indicefp")| Source | Dataset | Updated | PNG | |
|---|---|---|---|---|
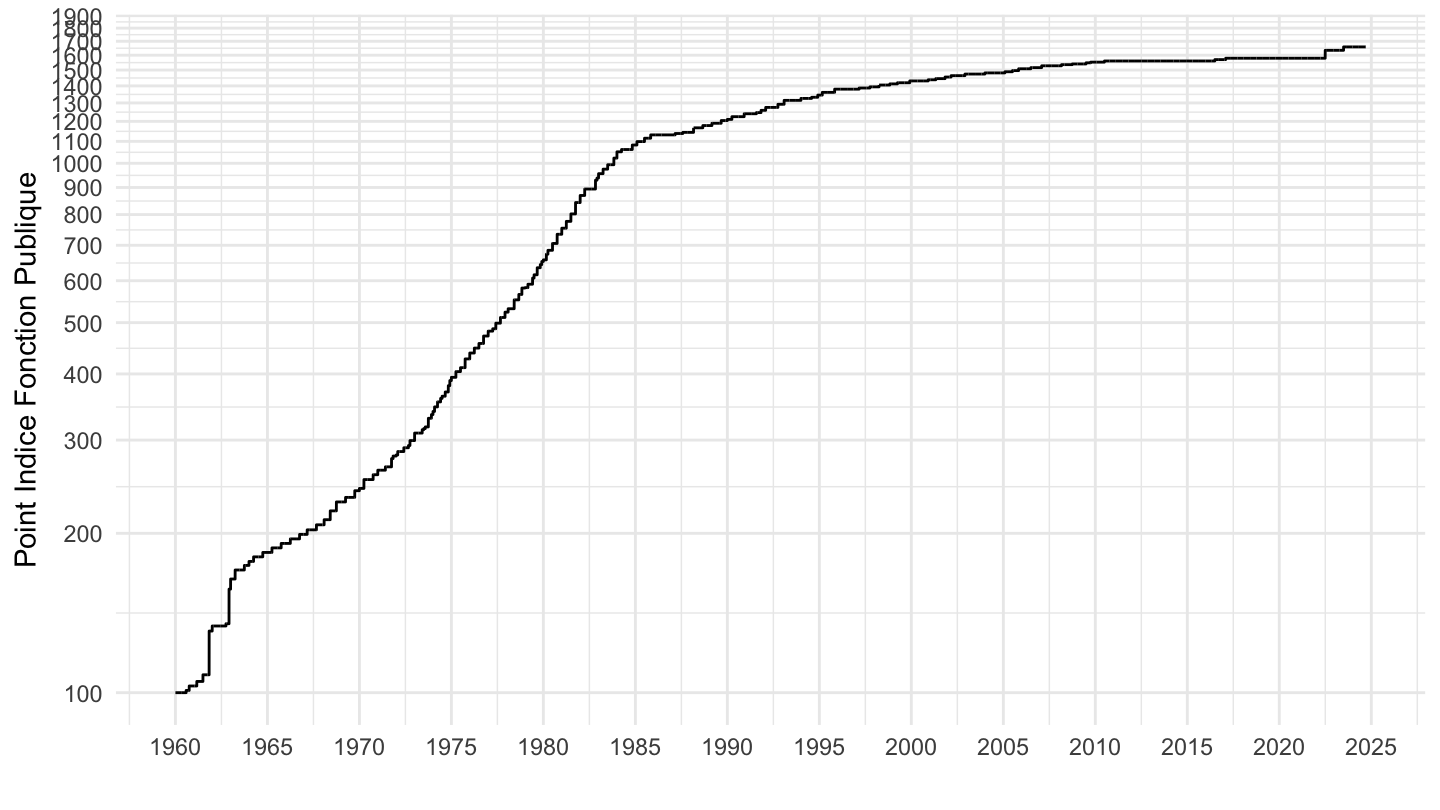
Base 100
Code
ig_d("ipp", "indicefp", "indicefp-base-100")| Source | Dataset | Updated | PNG | |
|---|---|---|---|---|
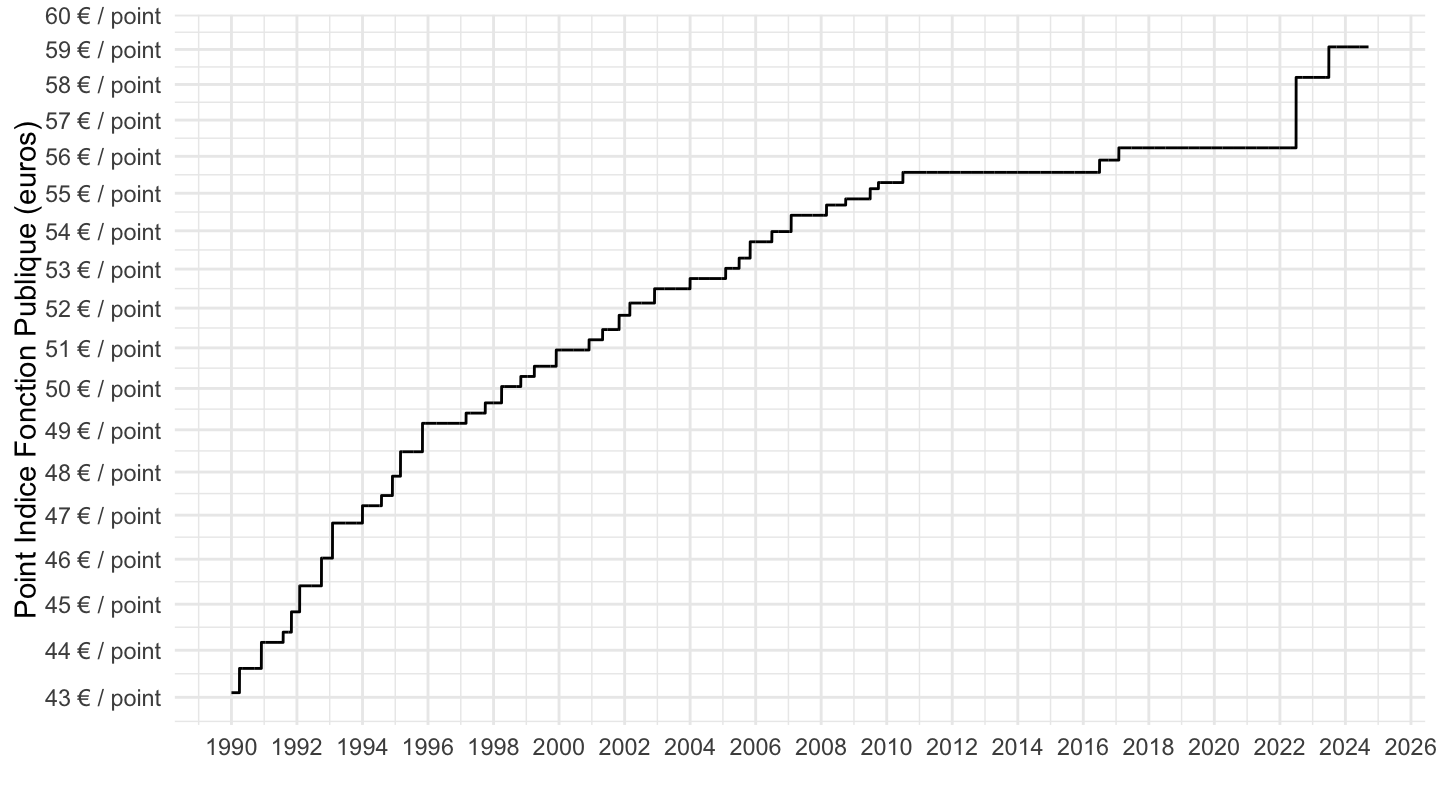
1990-
Valeur
Code
ig_d("ipp", "indicefp", "indicefp-1990")| Source | Dataset | Updated | PNG | |
|---|---|---|---|---|
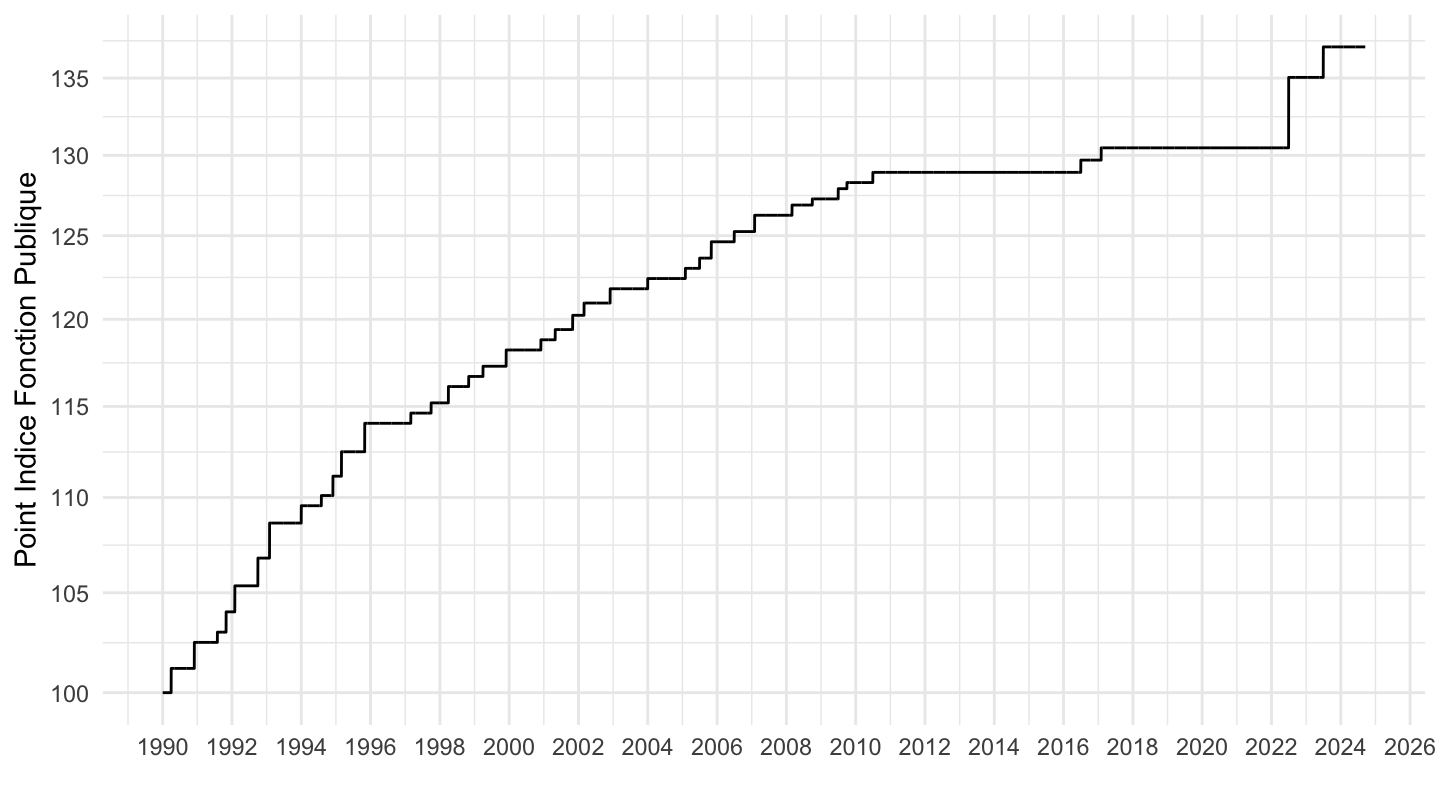
Base 100
Code
ig_d("ipp", "indicefp", "indicefp-1990-base-100")| Source | Dataset | Updated | PNG | |
|---|---|---|---|---|
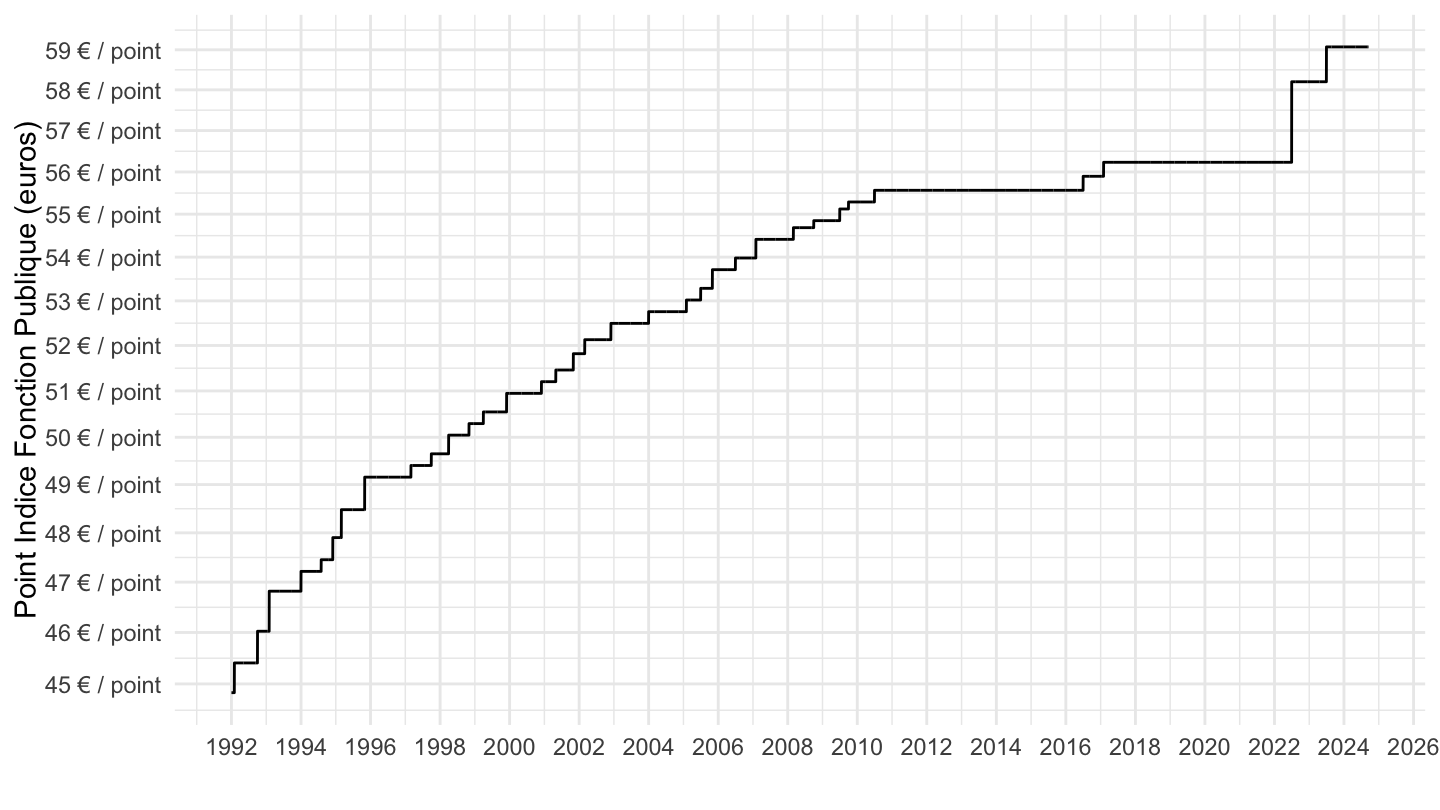
1992-
Valeur
Code
ig_d("ipp", "indicefp", "indicefp-1992")| Source | Dataset | Updated | PNG | |
|---|---|---|---|---|
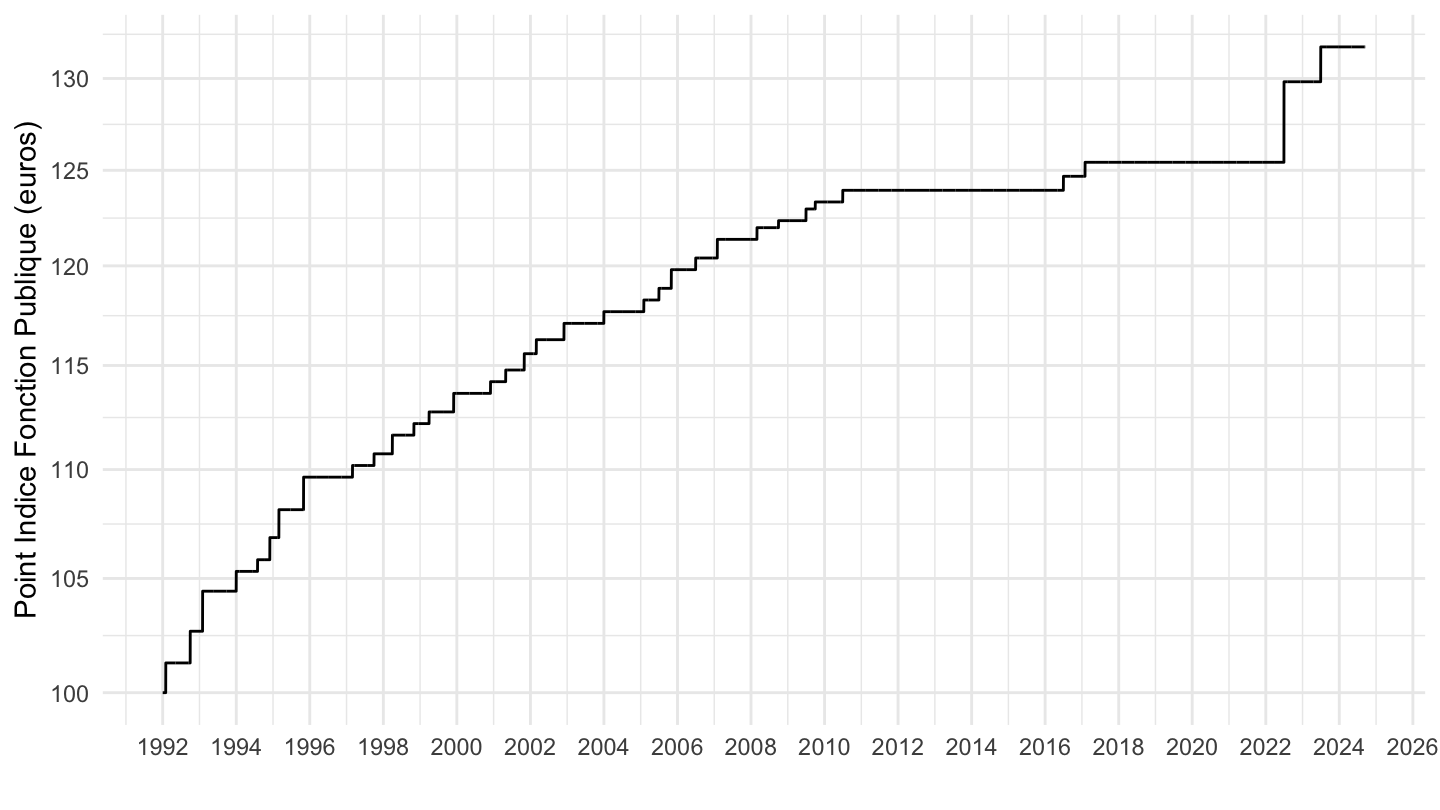
Base 100
Code
ig_d("ipp", "indicefp", "indicefp-1992-base-100")| Source | Dataset | Updated | PNG | |
|---|---|---|---|---|
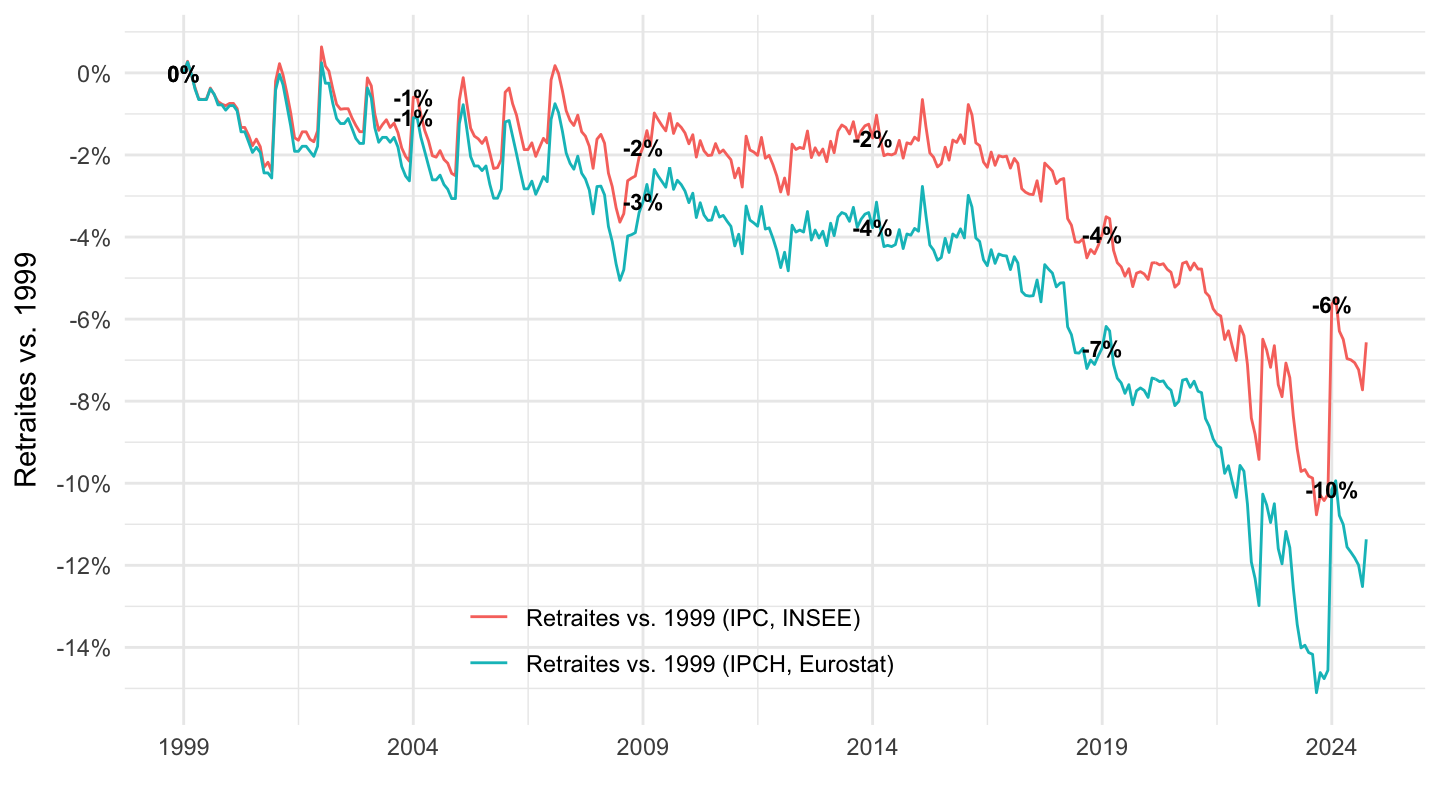
Revalorisation des pensions
En réel
Code
ig_d("ipp", "revalorisation_pension", "reval-1999-reel")| Source | Dataset | Updated | PNG | |
|---|---|---|---|---|
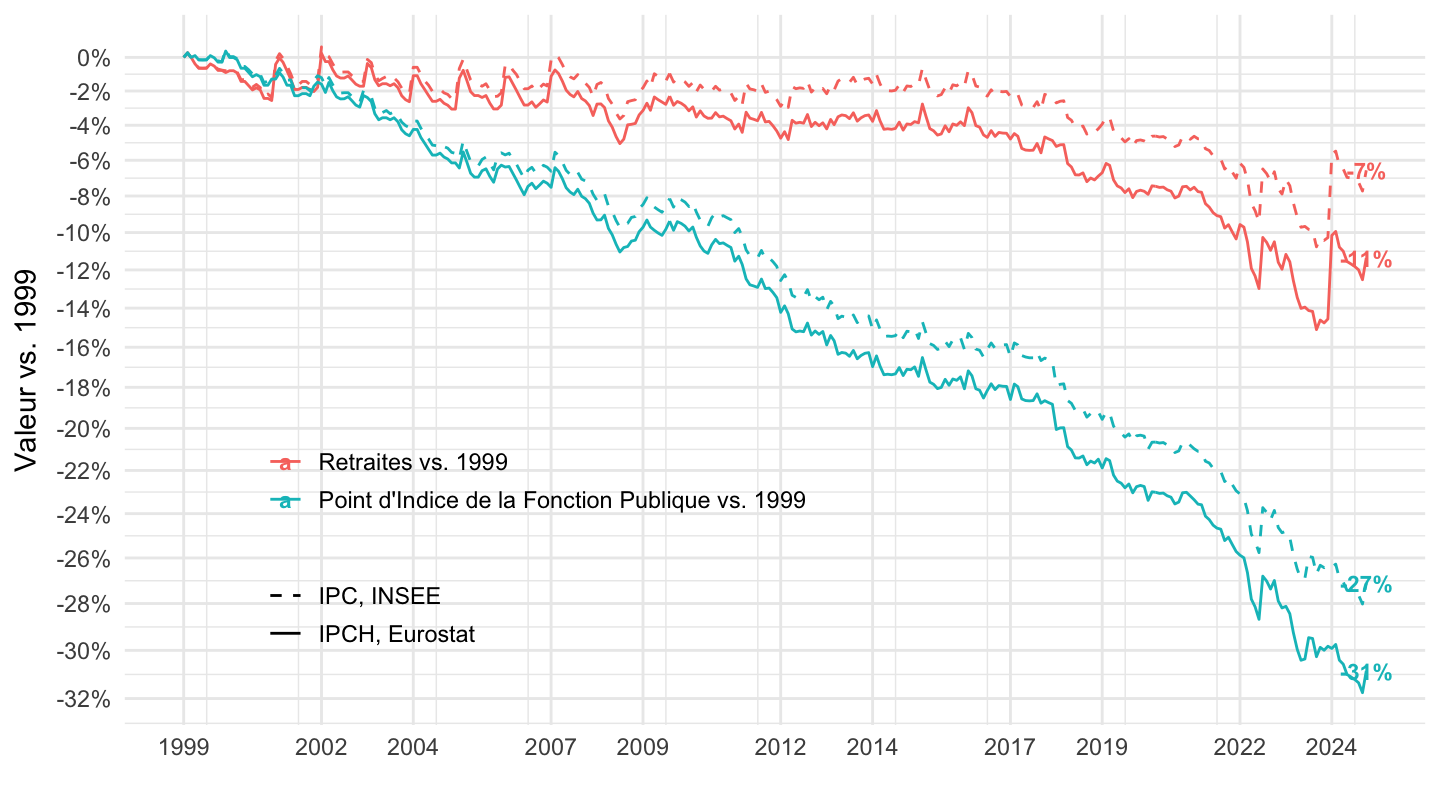
Comparaison avec Indice FP
Code
ig_d("ipp", "revalorisation_pension", "merge-indicefp")| Source | Dataset | Updated | PNG | |
|---|---|---|---|---|
Famille
Code
famille |>
  select(-date_parution_jo, -reference, -notes) |>
  gather(variable, value, -date) |>
  group_by(variable) |>
  complete(date = seq.Date(min(date), max(date), by = "day")) |>
  fill(value) |>
  ggplot() + geom_line(aes(x = date, y = value, color = variable)) +

  theme_minimal() +
  scale_x_date(breaks = seq(1920, 2100, 5) |> paste0("-01-01") |> as.Date(),
               labels = date_format("%Y")) +
  theme(legend.position = c(0.3, 0.8),
        legend.title = element_blank()) +
  scale_y_continuous(breaks = 0.01*seq(0, 80, 1),
                     labels = percent_format(accuracy = 0.1)) +
  ylab("Cotisation Famille (%)") + xlab("")