Last data update: 16 oct. 2026, 06:34
Last compile: 16 oct. 2026, 06:46
last_day <- max(policy_rates$scraped_date)

policy_rates |>
  filter(scraped_date == last_day) |>
  transmute(`Banque centrale` = central_bank, `Taux` = rate,
            `Prochaine réunion` = next_meeting, `Dernier mouvement` = last_change) |>
  arrange(desc(`Taux`)) |>
print_table_conditional()| Banque centrale | Taux | Prochaine réunion | Dernier mouvement |
|---|---|---|---|
| Central Bank of the Russian Federation (CBR) | 14.00 | Oct 23, 2026 | Jul 24, 2026 (-25bp) |
| Central Bank of Brazil (BCB) | 13.75 | Nov 03, 2026 | Sep 16, 2026 (-25bp) |
| Reserve Bank of India (RBI) | 5.50 | Dec 04, 2026 | Oct 07, 2026 (25bp) |
| Reserve Bank of Australia (RBA) | 4.60 | Nov 03, 2026 | Sep 29, 2026 (25bp) |
| Federal Reserve (FED) | 4.00 | Oct 28, 2026 | Sep 16, 2026 (25bp) |
| Bank of England (BOE) | 3.75 | Oct 29, 2026 | Dec 18, 2025 (-25bp) |
| People's Bank of China (PBOC) | 3.00 | Oct 20, 2026 | May 20, 2025 (-10bp) |
| Reserve Bank of New Zealand (RBNZ) | 2.75 | Oct 28, 2026 | Sep 02, 2026 (25bp) |
| European Central Bank (ECB) | 2.65 | Oct 29, 2026 | Sep 10, 2026 (25bp) |
| Bank of Canada (BOC) | 2.25 | Oct 28, 2026 | Oct 29, 2025 (-25bp) |
| Bank of Japan (BOJ) | 1.25 | Oct 30, 2026 | Sep 18, 2026 (25bp) |
| Swiss National Bank (SNB) | 0.00 | Dec 10, 2026 | Jun 19, 2025 (-25bp) |
Source : investing.com, instantané du 16 octobre 2026.
policy_rates |>
  filter(scraped_date == max(scraped_date)) |>
  mutate(central_bank = fct_reorder(central_bank, rate)) |>
  ggplot(aes(x = central_bank, y = rate)) +
  geom_col(fill = "grey55") +
  geom_text(aes(label = sprintf("%.2f", rate)), hjust = -0.2, size = 3) +
  coord_flip() + theme_minimal() +
  xlab("") + ylab("Taux directeur (%)")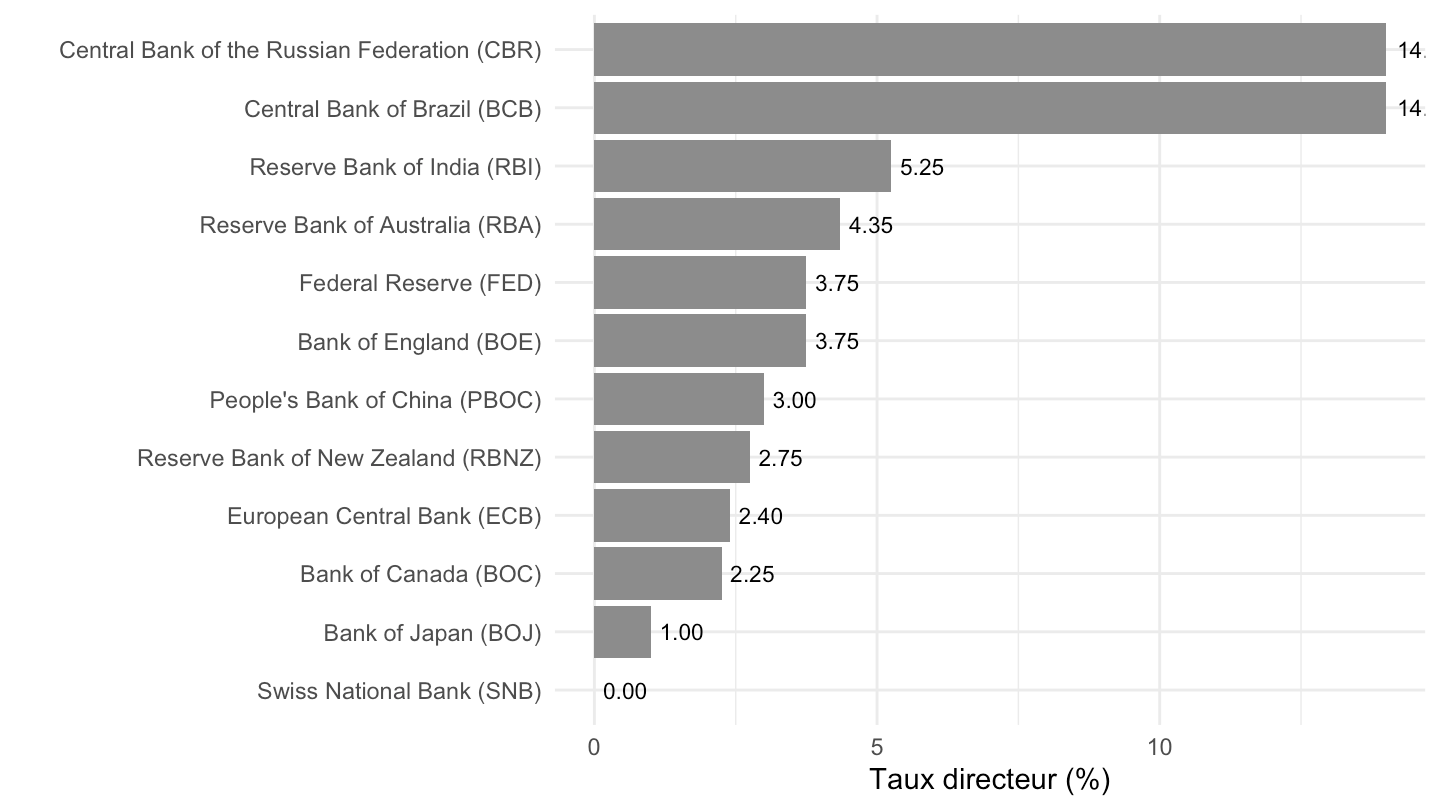
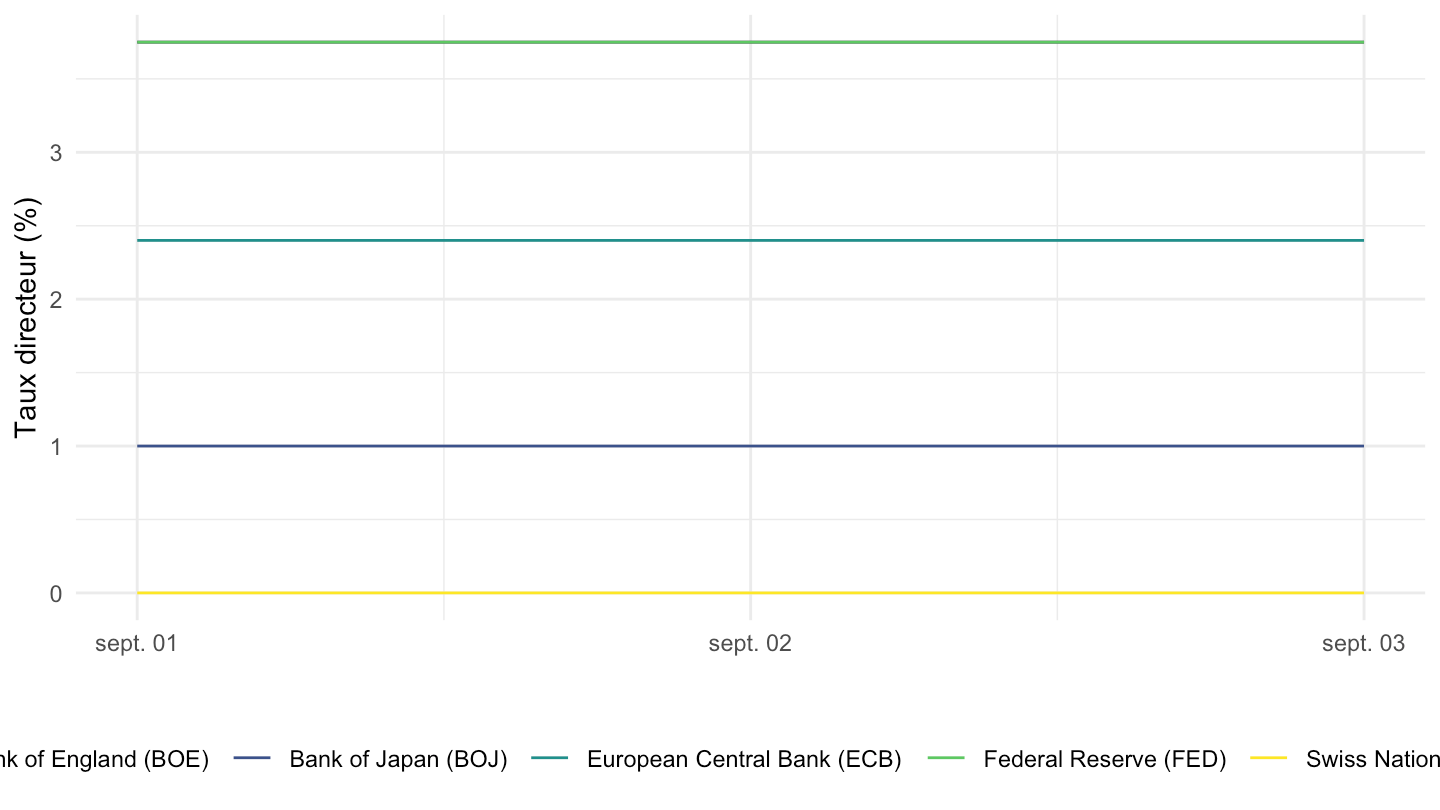
sel <- c("Federal Reserve (FED)", "European Central Bank (ECB)",
         "Bank of England (BOE)", "Bank of Japan (BOJ)",
         "Swiss National Bank (SNB)")
d <- policy_rates |> filter(central_bank %in% sel)

if (n_distinct(d$scraped_date) < 2) {
  knitr::asis_output(paste0(
    "_Série trop courte (", n_distinct(d$scraped_date),
    " relevé) — le graphique se remplira au fil des instantanés quotidiens._"))
} else {
  d |>
    ggplot() +
    geom_step(aes(x = scraped_date, y = rate, color = central_bank)) +
    theme_minimal() + xlab("") + ylab("Taux directeur (%)") +
    scale_color_viridis_d() +
    theme(legend.position = "bottom", legend.title = element_blank())
}