Code
investing_datasets %>%
  mutate(html = paste0('<a  target=_blank href=https://fgeerolf.com/data/investing/', id, '.html > html </a>')) %>%
{if (is_html_output()) datatable(., filter = 'top', rownames = F, escape = F) else .}Data
investing_datasets %>%
mutate(html = paste0('<a target=_blank href=https://fgeerolf.com/data/investing/', id, '.html > html </a>')) %>%
{if (is_html_output()) datatable(., filter = 'top', rownames = F, escape = F) else .}investing_datasets %>%
{if (is_html_output()) mutate(., html = paste0("[html](https://fgeerolf.com/data/investing/",id, ".html)")) else .} %>%
{if (is_html_output()) print_table(.) else .}| id | label | Nobs | html |
|---|---|---|---|
| etfs | Exchange Traded Funds | 11403 | [html] |
| currency_crosses | Exchange Rates | 2029 | [html] |
| bonds | Bond Prices | 2958329 | [html] |
| indices | Main Indices | 6076842 | [html] |
| commodities | Commodity Prices | 292232 | [html] |
| stocks | Stock Prices | 39952 | [html] |
Update: December 09, 2024. [html]
Update: December 09, 2024. [html]
Update: December 09, 2024. [html]
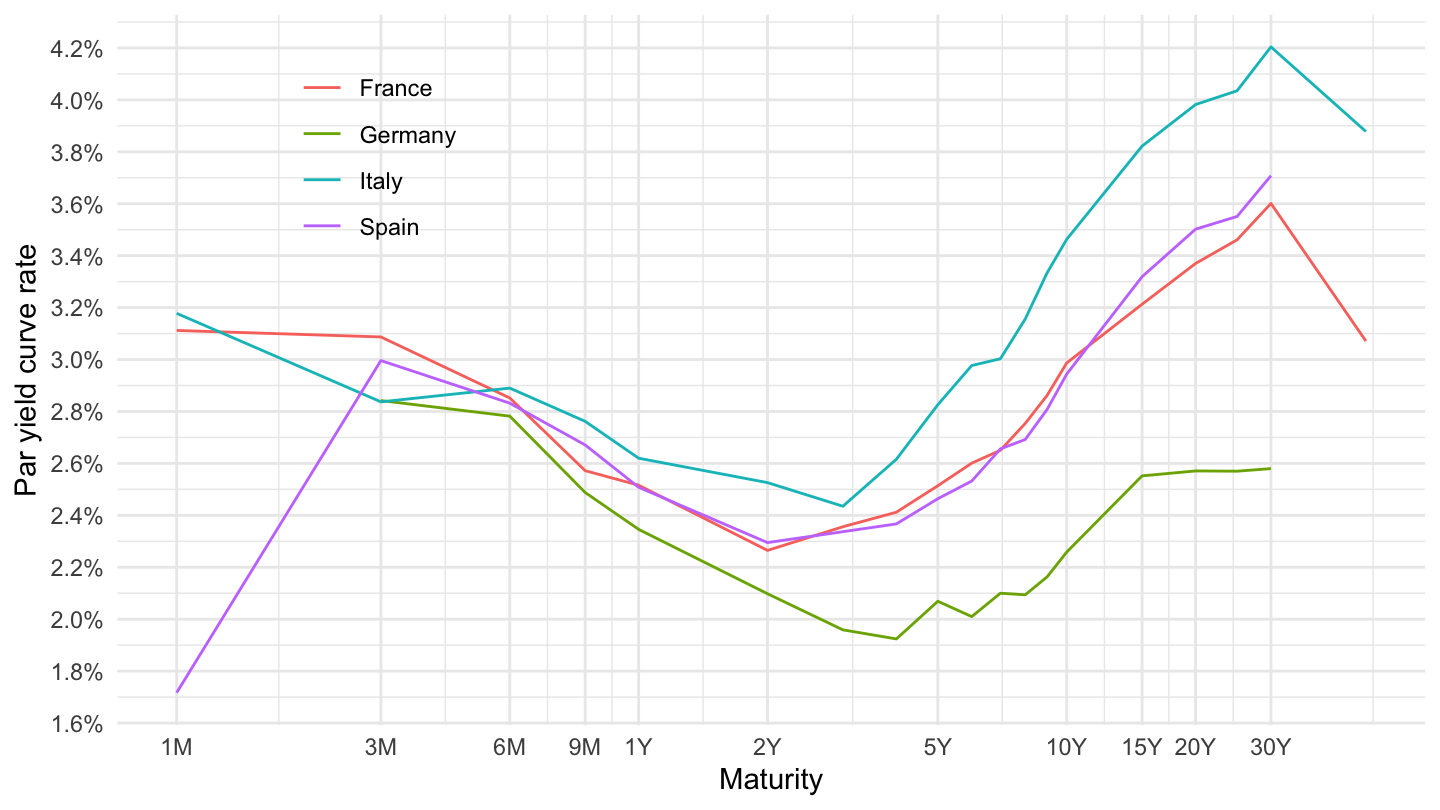
world_government_bonds %>%
  group_by(country) %>%
  summarise(Nobs = n(),
            `10Y` = Yield[duration == "10Y"],
            `30Y` = Yield[duration == "30Y"]) %>%
print_table_conditional()world_government_bonds %>%
mutate(number = parse_number(duration),
number = ifelse(duration %in% paste0(1:12, "M"), number/12, number)) %>%
filter(country %in% c("France", "Italy", "Spain", "Germany")) %>%
ggplot + geom_line(aes(x = number, y = Yield/100, color = country)) +
theme_minimal() + xlab("Maturity") + ylab("Par yield curve rate") +
scale_x_log10(breaks = c(1/12, 3/12, 6/12, 9/12, 1, 2, 5, 10, 15, 20, 30),
labels = c("1M", "3M", "6M", "9M", "1Y", "2Y", "5Y", "10Y", "15Y", "20Y", "30Y")) +
scale_y_continuous(breaks = 0.01*seq(-10, 50, 0.2),
labels = percent_format(accuracy = .1)) +
theme(legend.position = c(0.2, 0.8),
legend.title = element_blank())
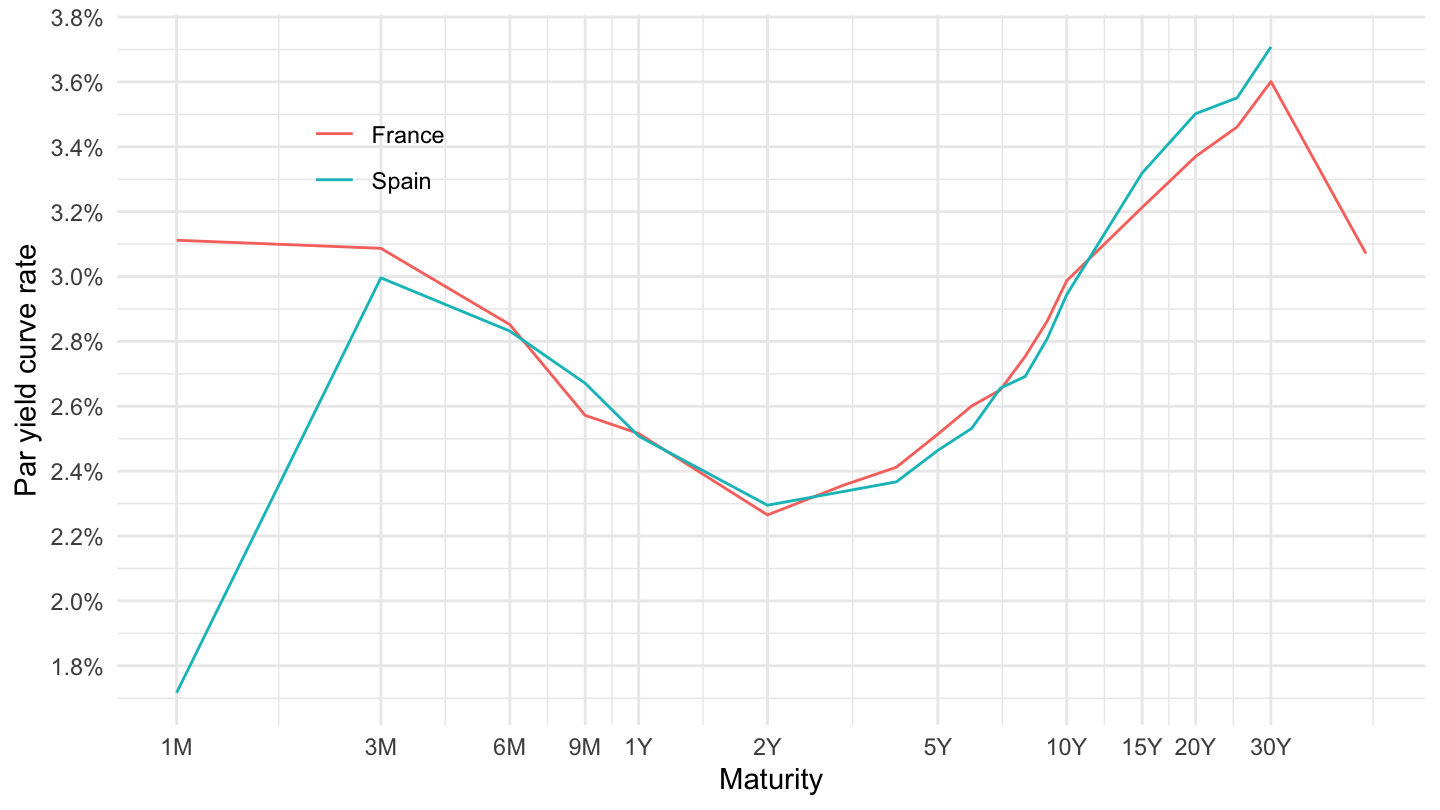
world_government_bonds %>%
  mutate(number = parse_number(duration),
         number = ifelse(duration %in% paste0(1:12, "M"), number/12, number)) %>%
  filter(country %in% c("France", "Spain")) %>%
   ggplot + geom_line(aes(x = number, y = Yield/100, color = country)) +
  theme_minimal() + xlab("Maturity") + ylab("Par yield curve rate") +
  scale_x_log10(breaks = c(1/12, 3/12, 6/12, 9/12, 1, 2, 5, 10, 15, 20, 30),
                     labels = c("1M", "3M", "6M", "9M", "1Y", "2Y", "5Y", "10Y", "15Y", "20Y", "30Y")) +
  scale_y_continuous(breaks = 0.01*seq(-10, 50, 0.2),
                     labels = percent_format(accuracy = .1)) +
  theme(legend.position = c(0.2, 0.8),
        legend.title = element_blank())
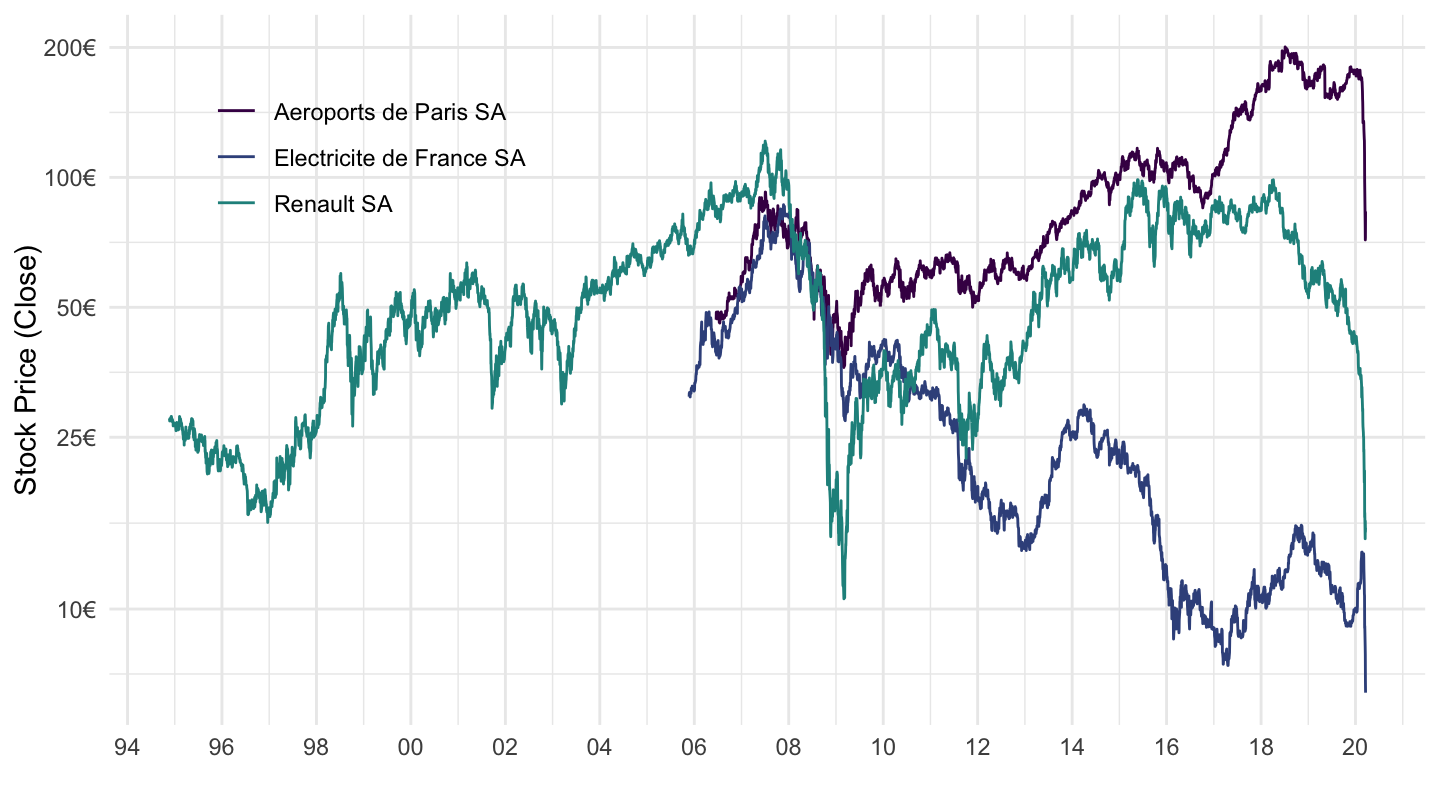
ig_d("investing", "stocks_FRA", "ADP-BNPP-EDF")