Code
etfs %>%
  filter(country == "france") %>%
  select(symbol, name) %>%
{if (is_html_output()) datatable(., filter = 'top', rownames = F) else .}Data - Investing
etfs %>%
filter(country == "france") %>%
select(symbol, name) %>%
{if (is_html_output()) datatable(., filter = 'top', rownames = F) else .}etfs %>%
filter(country == "united states",
grepl("S&P", name)) %>%
select(symbol, name) %>%
left_join(etfs_USA %>%
group_by(symbol) %>%
summarise(Nobs = n(),
Close_last = last(Close)),
by = "symbol") %>%
arrange(-Nobs) %>%
{if (is_html_output()) datatable(., filter = 'top', rownames = F) else .}etfs_USA %>%
filter(symbol %in% c("ITOT", "SPYV", "IVE")) %>%
left_join(etfs_USA_var, by = "symbol") %>%
ggplot + geom_line(aes(x = Date, y = Close, color = full_name)) +
theme_minimal() + xlab("") + ylab("Stock Price (Close)") +
scale_x_date(breaks = seq(1960, 2020, 2) %>% paste0("-01-01") %>% as.Date,
labels = date_format("%y")) +
scale_y_log10(breaks = c(1, 2, 3, 5, 10, 25, 50, 100, 200, 500),
labels = dollar_format(accuracy = 1)) +
scale_color_manual(values = viridis(5)[1:4]) +
theme(legend.position = c(0.25, 0.9),
legend.title = element_blank())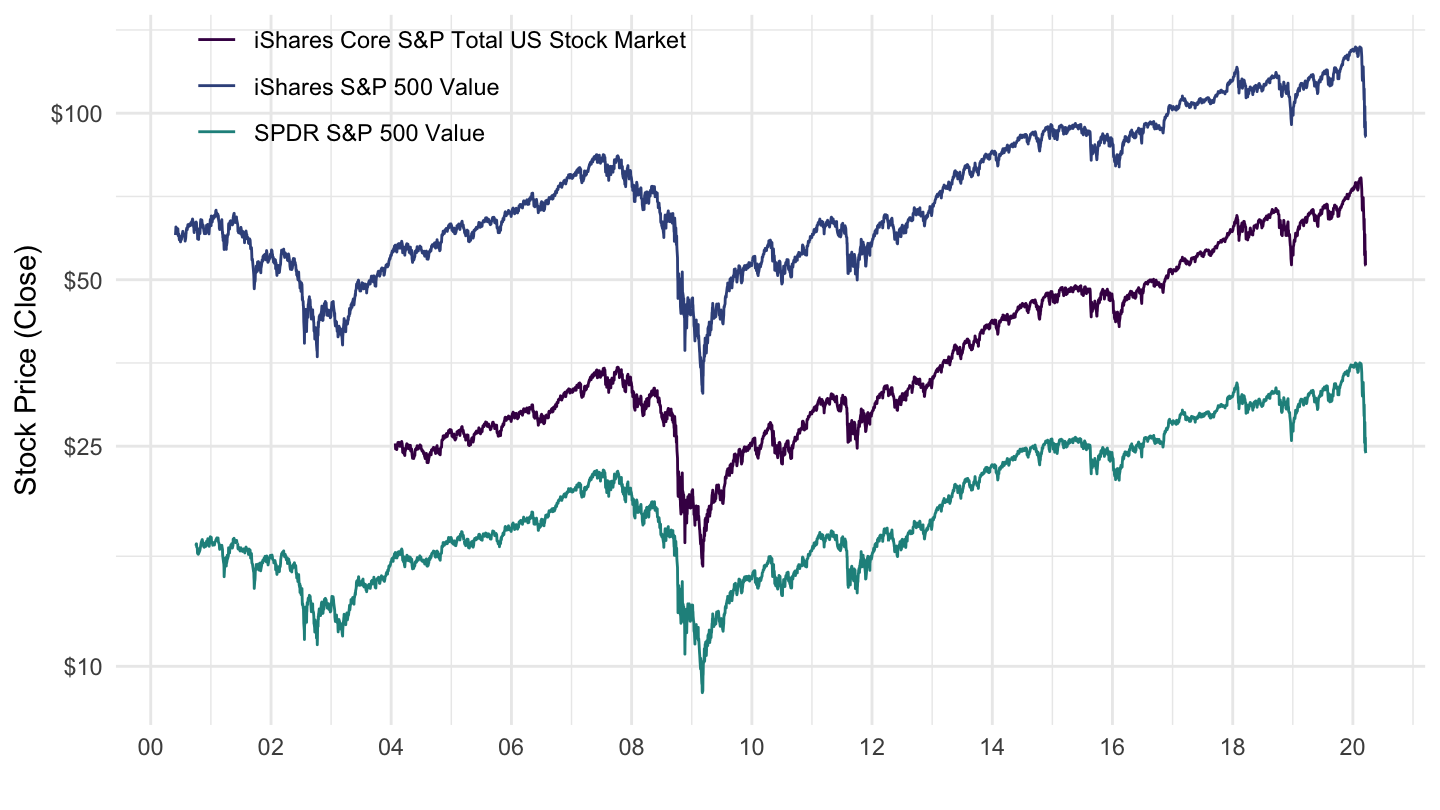
etfs_USA %>%
  filter(symbol %in% c("ITOT", "SPYV", "IVE"),
         Date >= as.Date("2008-01-01")) %>%
  left_join(etfs_USA_var, by = "symbol") %>%
  ggplot + geom_line(aes(x = Date, y = Close, color = full_name)) +
  theme_minimal() + xlab("") + ylab("Stock Price (Close)") +
  scale_x_date(breaks = seq(1960, 2020, 1) %>% paste0("-01-01") %>% as.Date,
               labels = date_format("%y")) +
  scale_y_log10(breaks = seq(0, 200, 10),
                     labels = dollar_format(accuracy = 1)) +
  scale_color_manual(values = viridis(5)[1:4]) +
  theme(legend.position = c(0.25, 0.9),
        legend.title = element_blank())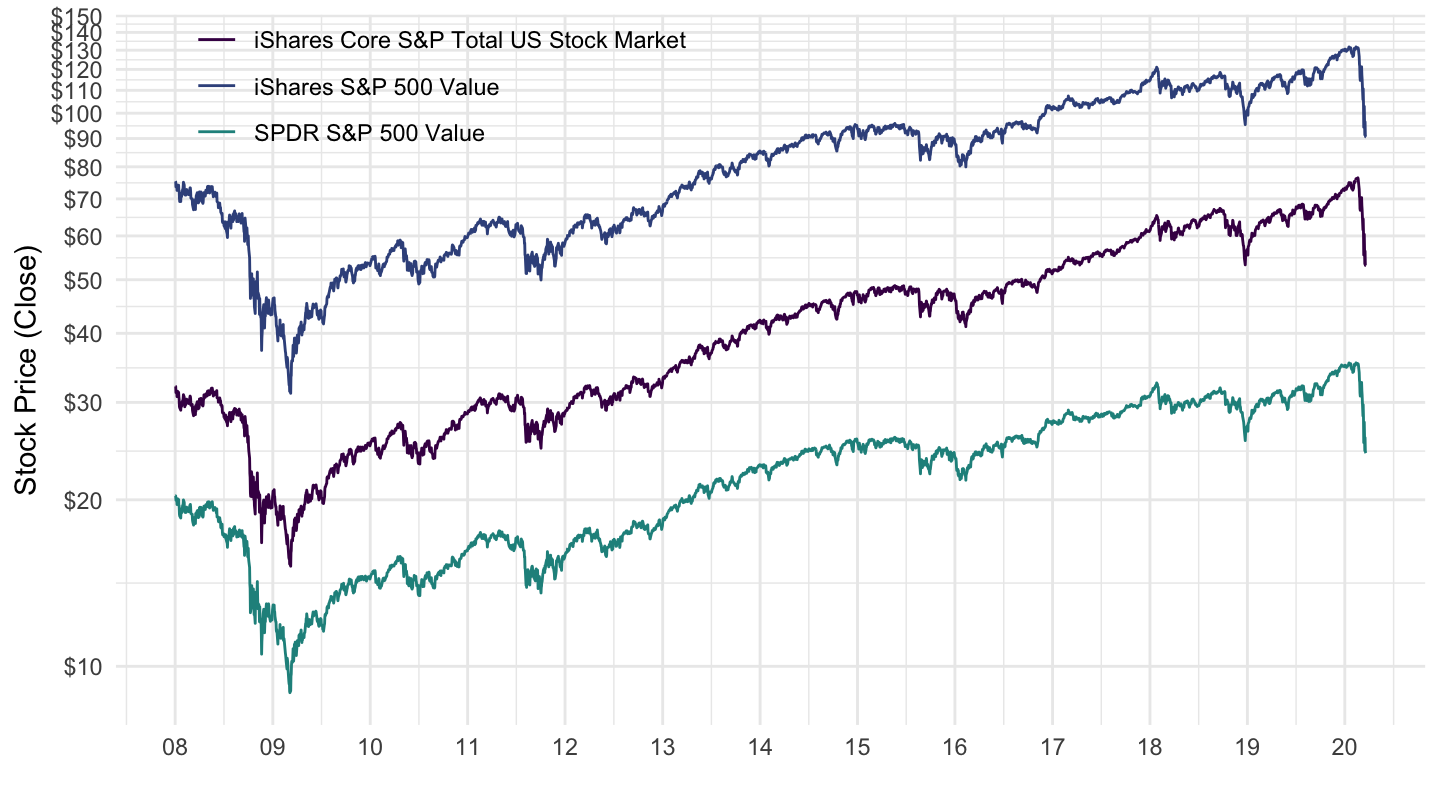
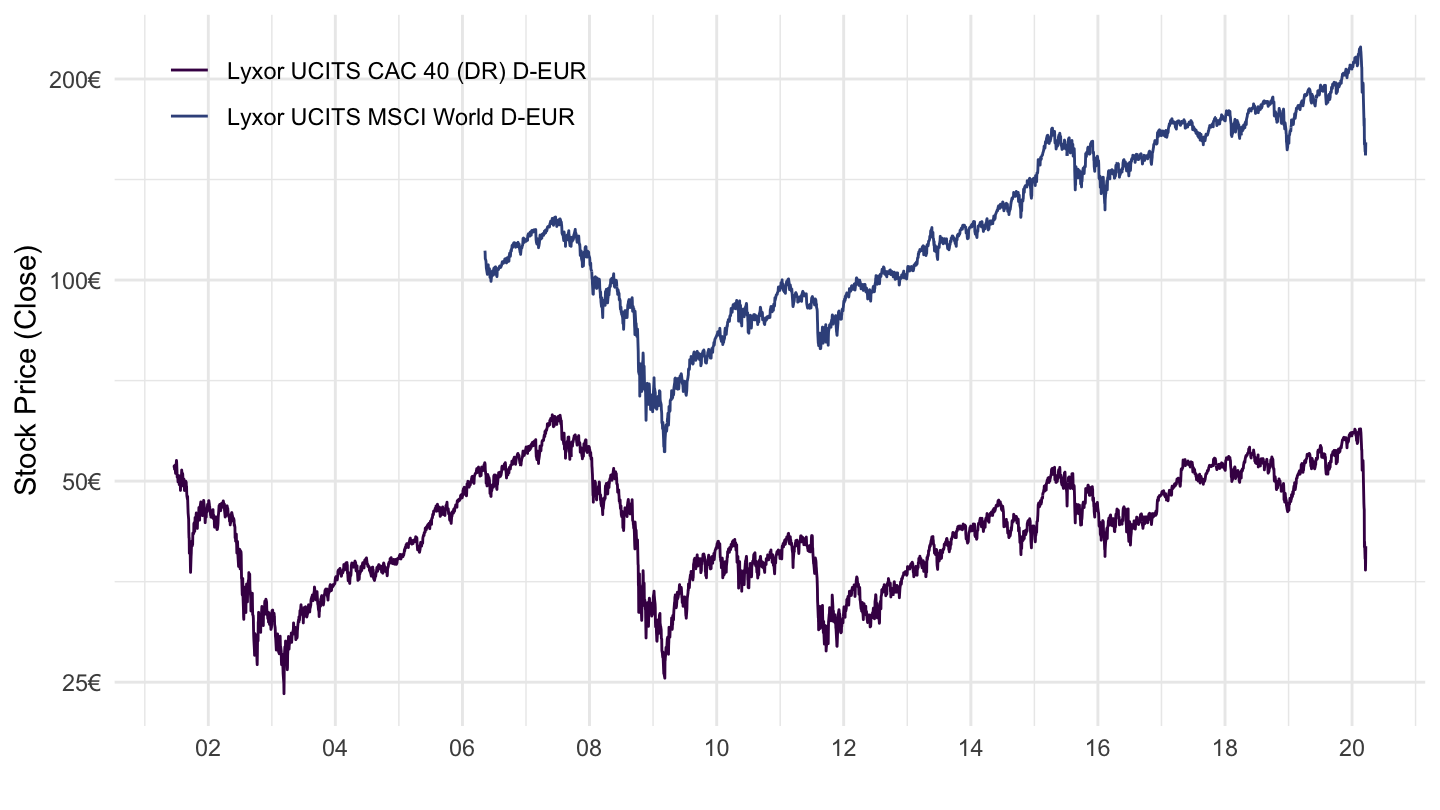
etfs_FRA %>%
  filter(symbol %in% c("CAC", "WLD")) %>%
  left_join(etfs_FRA_var, by = "symbol") %>%
  ggplot + geom_line(aes(x = Date, y = Close, color = full_name)) +
  theme_minimal() + xlab("") + ylab("Stock Price (Close)") +
  scale_x_date(breaks = seq(1960, 2020, 2) %>% paste0("-01-01") %>% as.Date,
               labels = date_format("%y")) +
  scale_y_log10(breaks = c(1, 2, 3, 5, 10, 25, 50, 100, 200, 500),
                     labels = dollar_format(prefix = "", suffix = "€", accuracy = 1)) +
  scale_color_manual(values = viridis(5)[1:4]) +
  theme(legend.position = c(0.2, 0.9),
        legend.title = element_blank())