Last data update: 04 nov. 2026, 06:34
Last compile: 04 nov. 2026, 06:39
Instantané quotidien de https://fr.investing.com/commodities/energy : contrats à terme sur l’énergie. Une ligne par instrument et par jour.
last_day <- max(energy_futures$scraped_date)

energy_futures |>
  filter(scraped_date == last_day) |>
  transmute(Instrument = name, Échéance = month, Dernier = last,
            `+ Haut` = high, `+ Bas` = low, `Var.` = chg, `Var. %` = chg_pct,
            Heure = quote_time) |>
  arrange(Instrument) |>
print_table_conditional()| Instrument | Échéance | Dernier | + Haut | + Bas | Var. | Var. % | Heure |
|---|---|---|---|---|---|---|---|
| Dutch TTF Natural Gas | Déc 2026 | 92.0700 | 98.200 | 87.2750 | -2.7910 | -2.94 | 03/11 |
| E-mini Crude Oil | Déc 2026 | 95.3800 | 97.130 | 94.9000 | -0.7300 | -0.75 | 05:25:07 |
| Emissions de carbone | Déc 2026 | 89.9300 | 91.290 | 89.7500 | -0.5900 | -0.65 | 03/11 |
| Essence RBOB | Déc 2026 | 2.9491 | 2.960 | 2.9123 | 0.0136 | 0.46 | 06:33:33 |
| Fioul | Déc 2026 | 4.5455 | 4.569 | 4.4962 | -0.0154 | -0.34 | 06:33:31 |
| Gasoil Londres | Nov 2026 | 1429.3800 | 1438.500 | 1413.6300 | -4.6200 | -0.32 | 06:30:25 |
| Gaz naturel | Déc 2026 | 2.8830 | 2.907 | 2.8400 | -0.0210 | -0.72 | 06:33:33 |
| Malaysian Crude Palm Oil c2 | 1172.5000 | 1172.500 | 1172.5000 | 7.7500 | 0.67 | 02/11 | |
| Micro Henry Hub Natural Gas | Déc 2026 | 2.8650 | 2.905 | 2.8380 | -0.0300 | -1.04 | 05:24:27 |
| Micro WTI Crude Oil | Déc 2026 | 95.3000 | 97.160 | 94.9100 | -0.7900 | -0.82 | 05:26:06 |
| Pétrole Brent | Jan 2027 | 103.8400 | 104.940 | 102.5700 | 0.2400 | 0.23 | 06:33:21 |
| Pétrole brut WTI | Déc 2026 | 96.1200 | 97.110 | 94.9300 | 0.0300 | 0.03 | 06:33:20 |
Source : investing.com, instantané du 04 novembre 2026.
earliest <- min(energy_futures$scraped_date)

energy_price_chart <- function(sel, from = earliest, ylab = "Prix") {
  d <- energy_futures |> filter(name %in% sel, scraped_date >= from)

  if (n_distinct(d$scraped_date) < 2) {
    knitr::asis_output(paste0(
      "_Série trop courte (", n_distinct(d$scraped_date),
      " relevé) — le graphique se remplira au fil des instantanés quotidiens._"))
  } else {
    d |>
      ggplot() + geom_line(aes(x = scraped_date, y = last, color = name)) +
      theme_minimal() + xlab("") + ylab(ylab) +
      scale_color_commodity() +
      theme(legend.position = "bottom", legend.title = element_blank())
  }
}energy_price_chart(c("Pétrole brut WTI", "Pétrole Brent"), ylab = "$ / baril")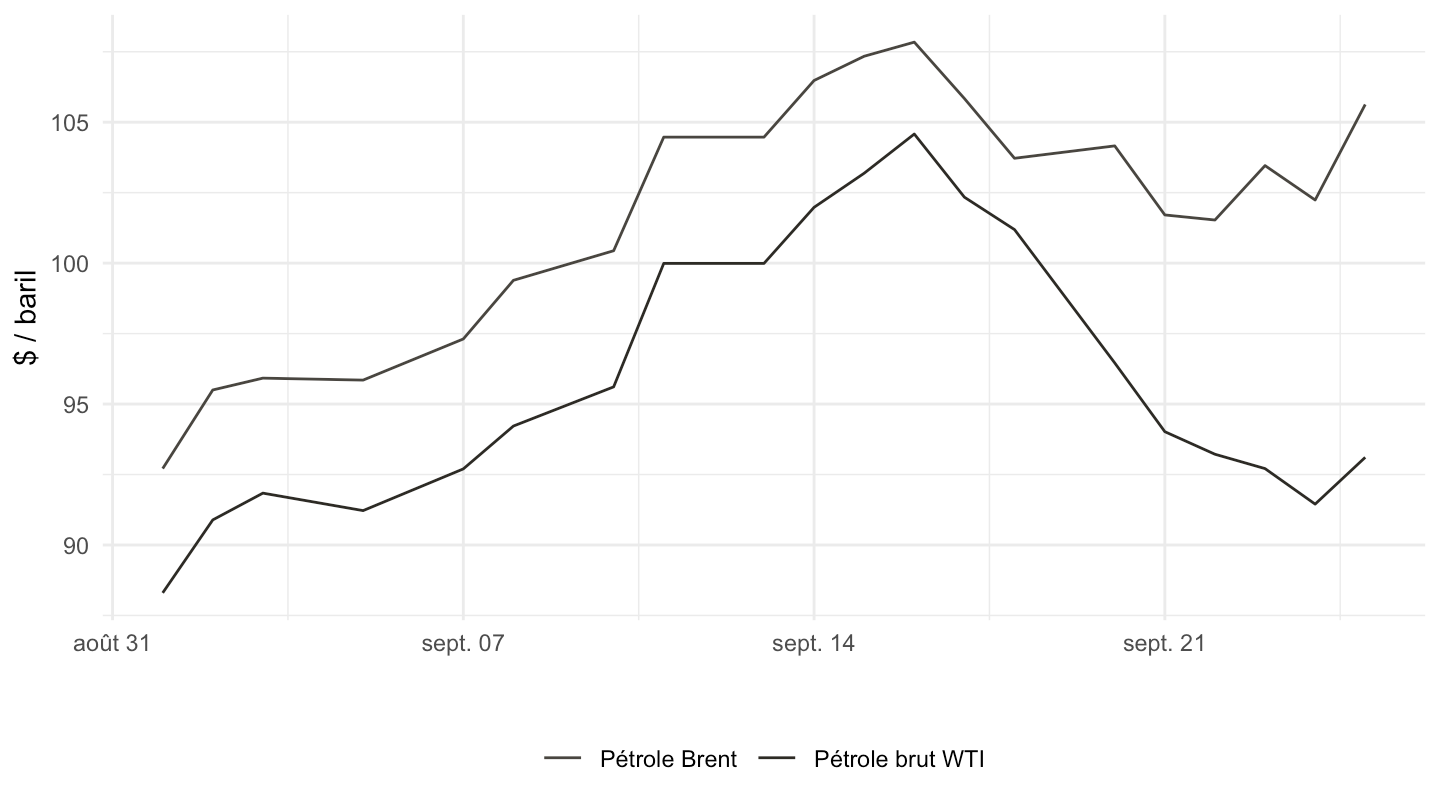
energy_price_chart(c("Pétrole brut WTI", "Pétrole Brent"),
                    from = last_day - 6, ylab = "$ / baril")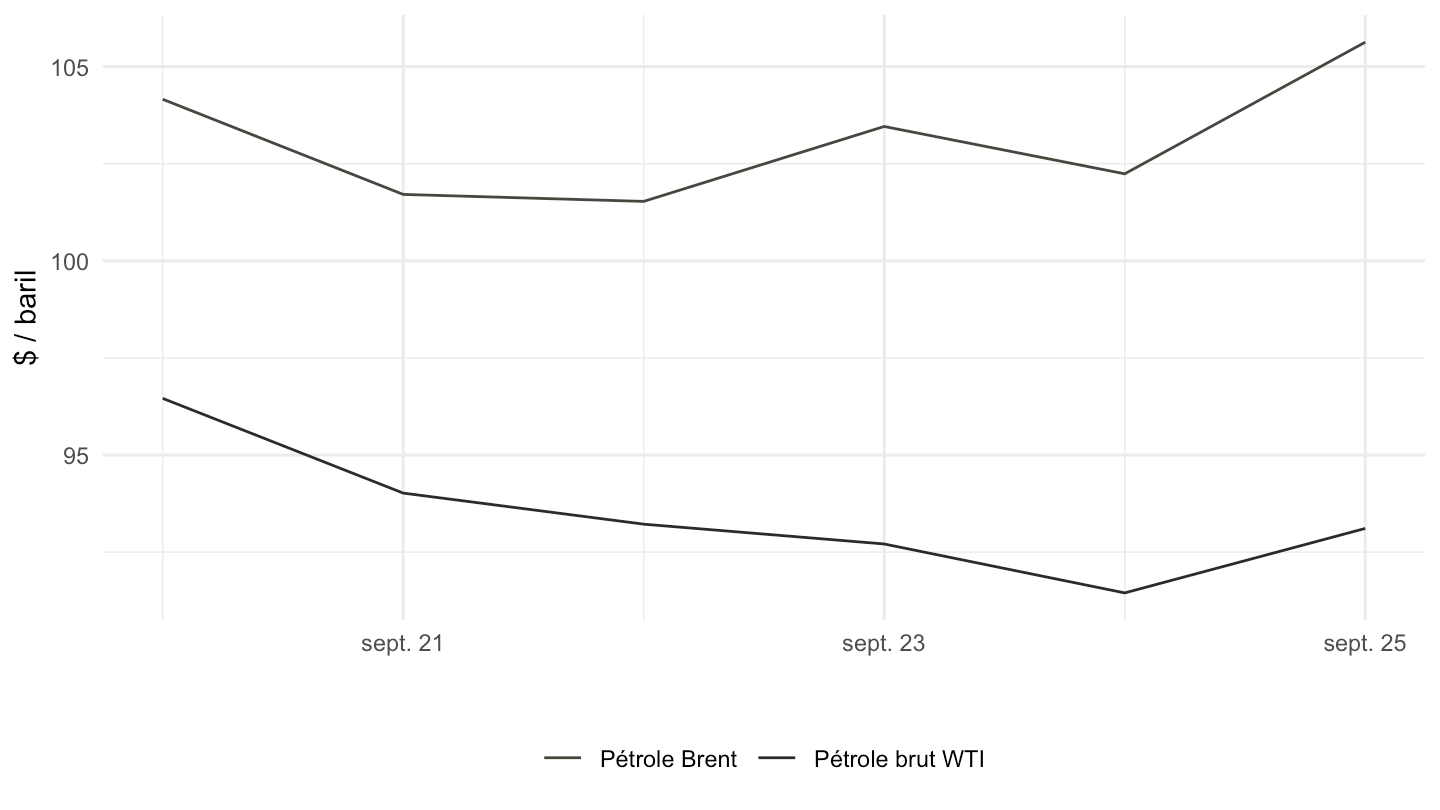
energy_price_chart(c("Essence RBOB", "Fioul"), ylab = "$ / gallon")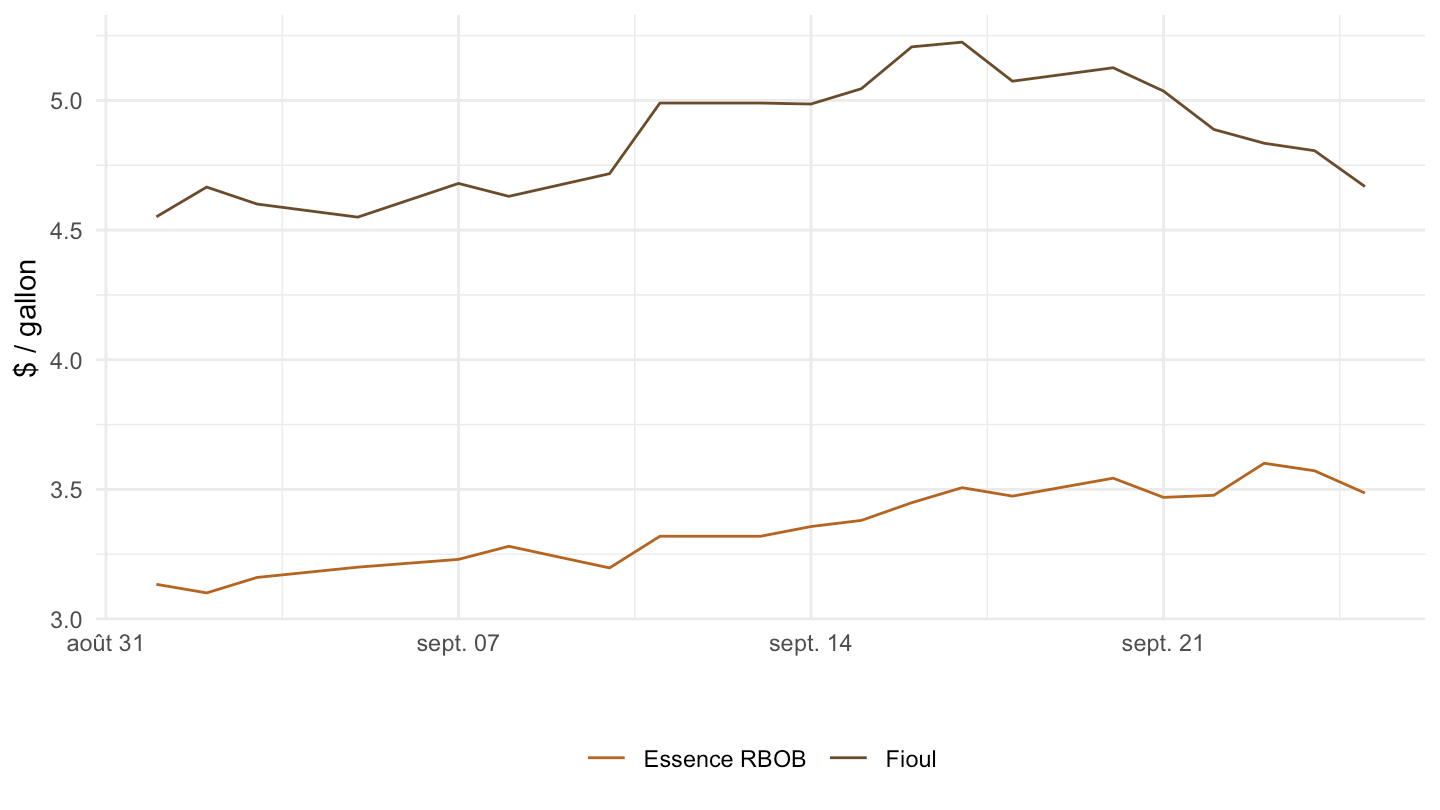
energy_price_chart(c("Essence RBOB", "Fioul"),
                    from = last_day - 6, ylab = "$ / gallon")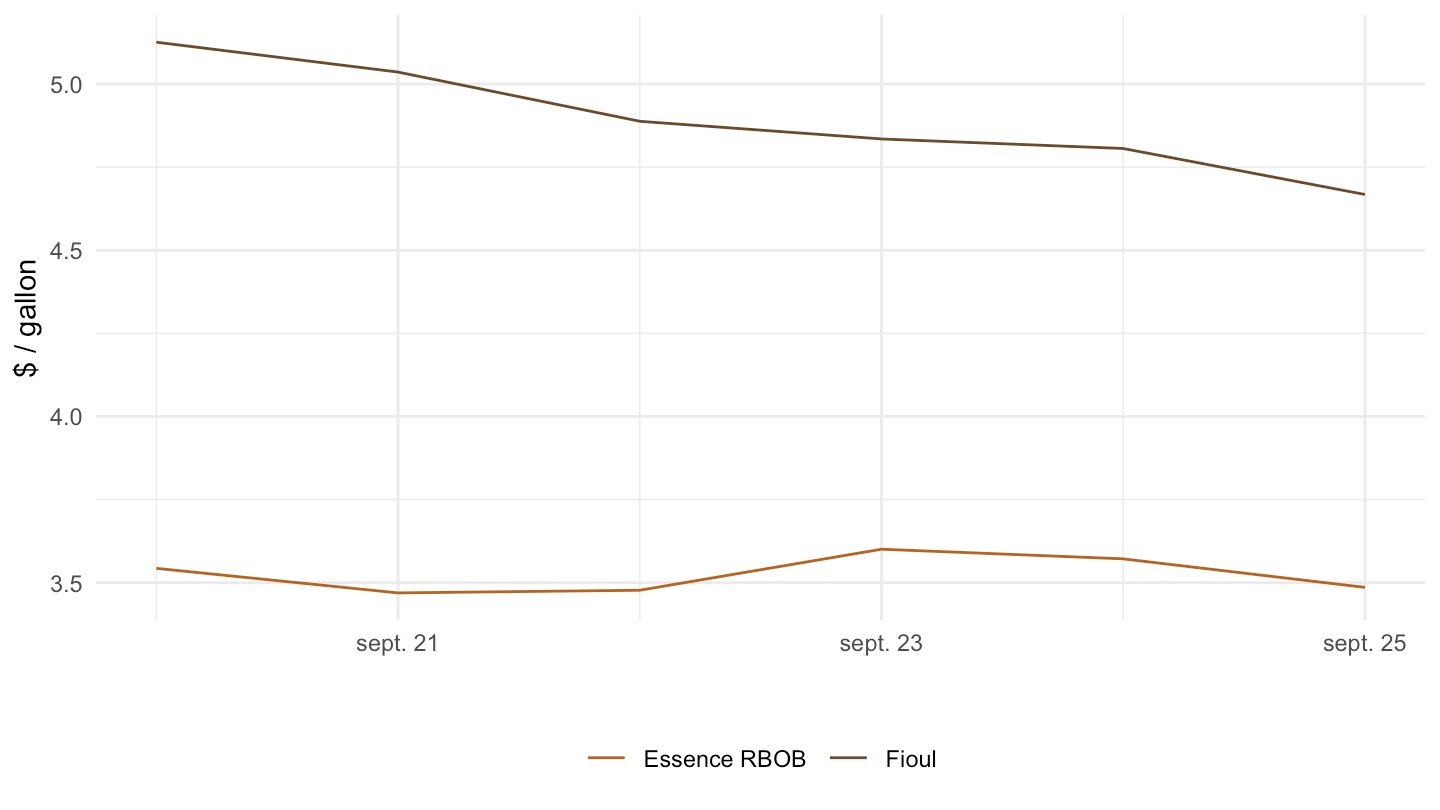
energy_futures.parquet est un instantané quotidien cumulatif : il ne remonte qu’au 1ᵉʳ septembre 2026. Les contrats génériques (toutes échéances confondues) correspondants existent en revanche depuis des décennies dans commodities.parquet (historique complet via l’API investing.com, voir commodity_futures.qmd) : WTI depuis 1983, Brent depuis 1988, gaz naturel depuis 1990, fioul depuis 1979, essence RBOB depuis 2005, gasoil de Londres depuis 2007, quotas carbone depuis 2008, TTF néerlandais depuis 2017.
hist_price_chart <- function(sel, from = NULL, ylab = "Prix", log = FALSE) {
  d <- commodities |> filter(commodity %in% sel)
  if (!is.null(from)) d <- d |> filter(Date >= as.Date(from))

  g <- d |>
    ggplot() + geom_line(aes(x = Date, y = Close, color = commodity)) +
    theme_minimal() + xlab("") + ylab(ylab) +
    scale_x_date(date_labels = "%Y") +
    scale_color_commodity() +
    theme(legend.position = "bottom", legend.title = element_blank())
  if (log) g <- g + scale_y_log10()
  g
}hist_price_chart(c("Crude Oil WTI", "Brent Oil"), ylab = "$ / baril", log = TRUE)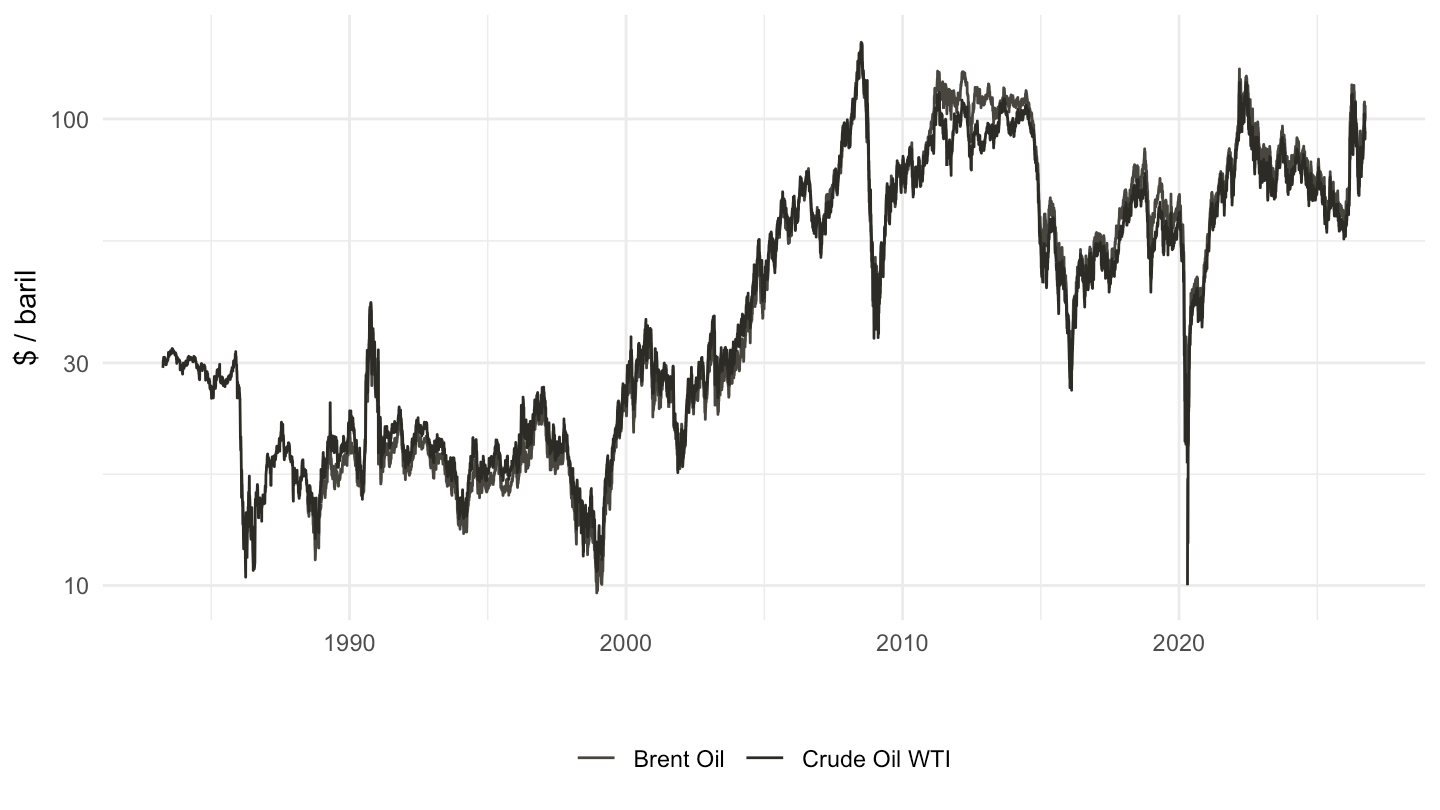
hist_price_chart(c("Crude Oil WTI", "Brent Oil"), from = "2010-01-01",
                  ylab = "$ / baril")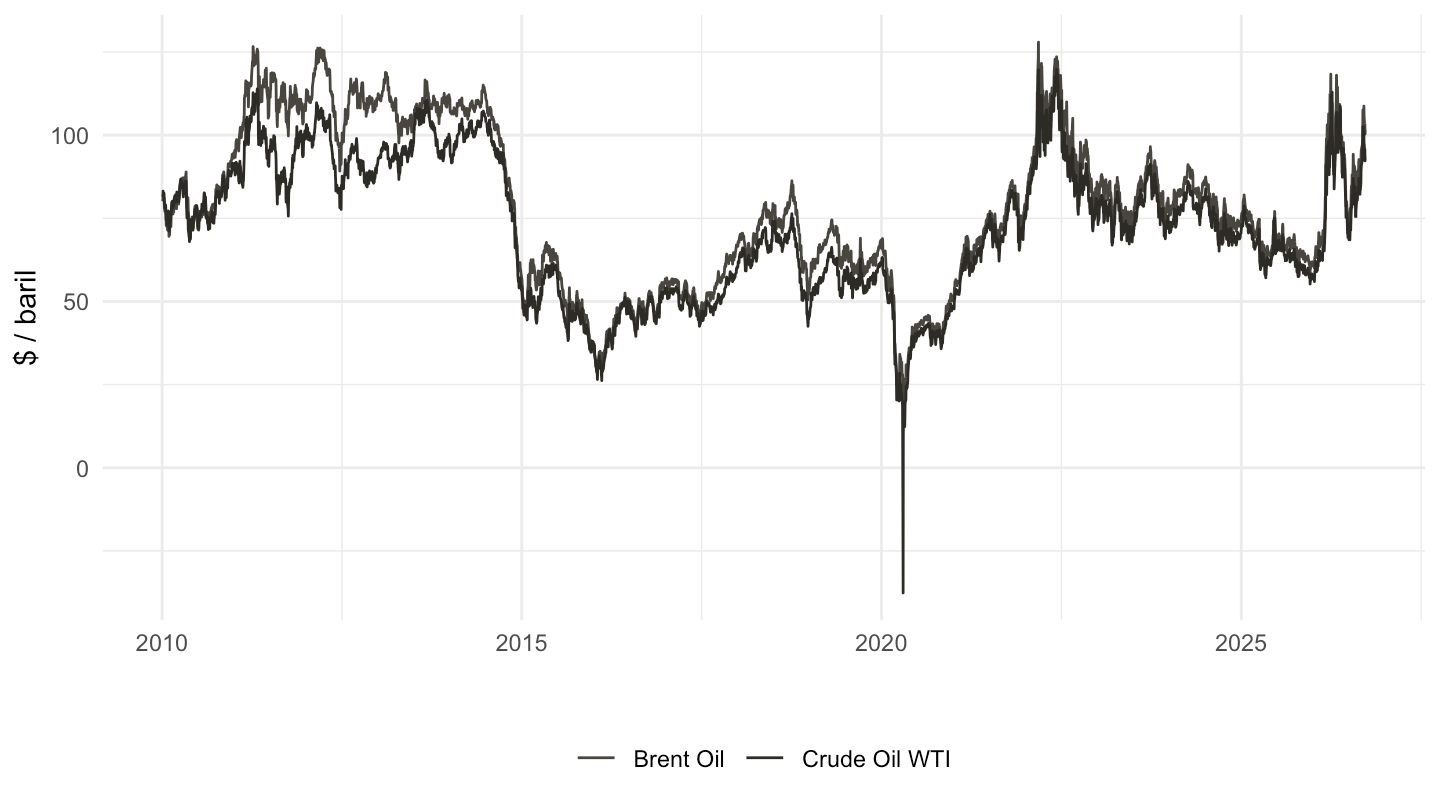
hist_price_chart(c("Gasoline RBOB", "Heating Oil"), ylab = "$ / gallon")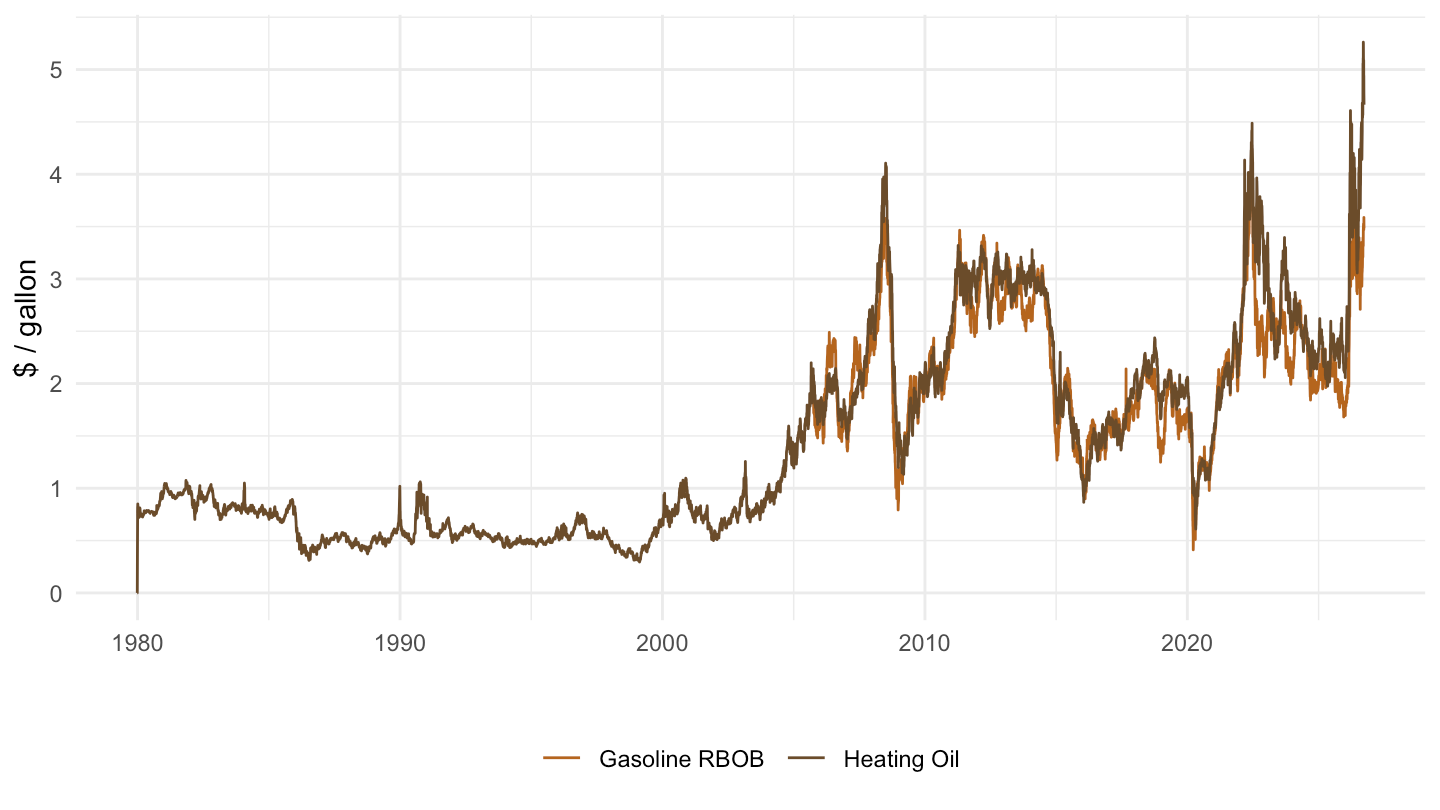
hist_price_chart(c("Gasoline RBOB", "Heating Oil"), from = "2015-01-01",
                  ylab = "$ / gallon")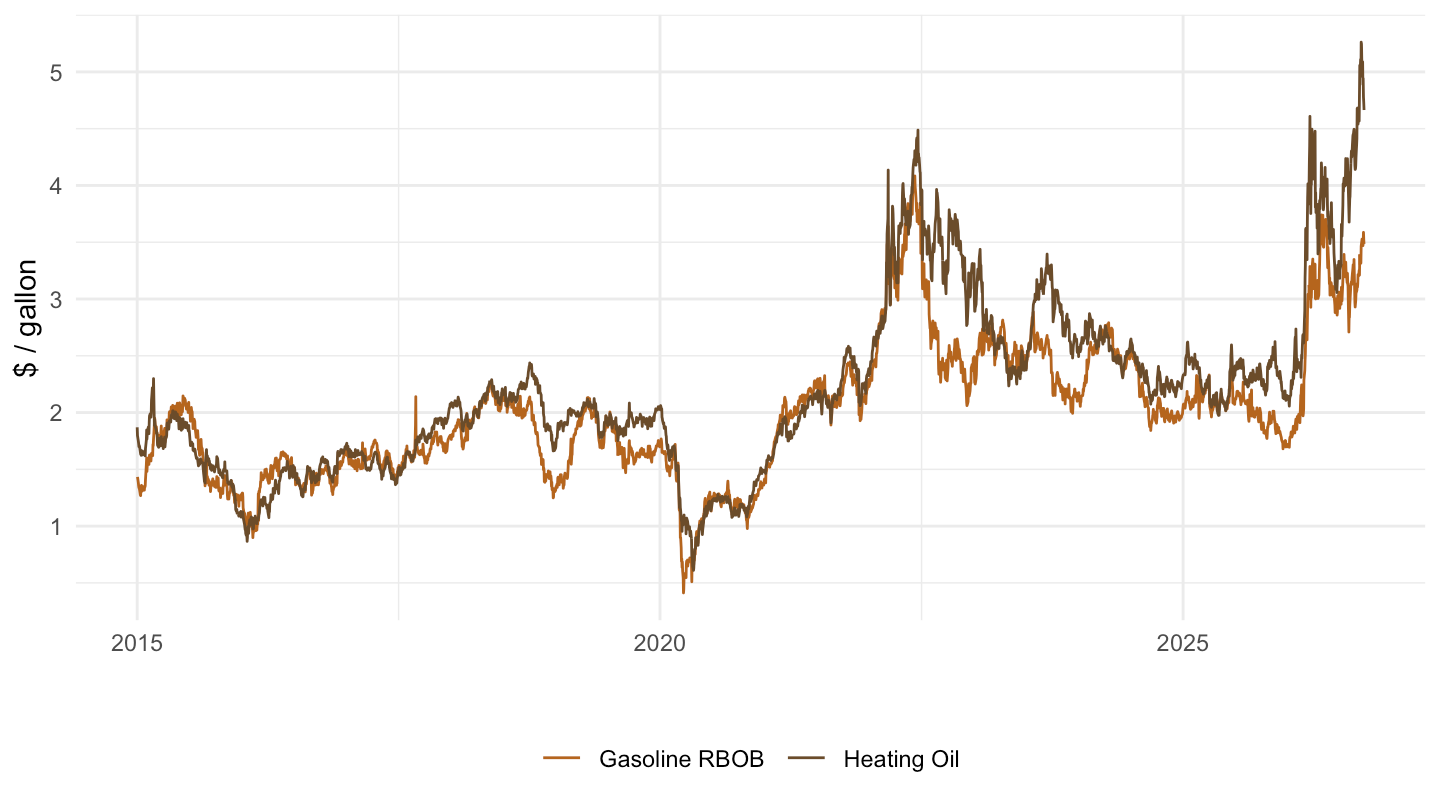
hist_price_chart("Natural Gas", ylab = "$ / MMBtu", log = TRUE)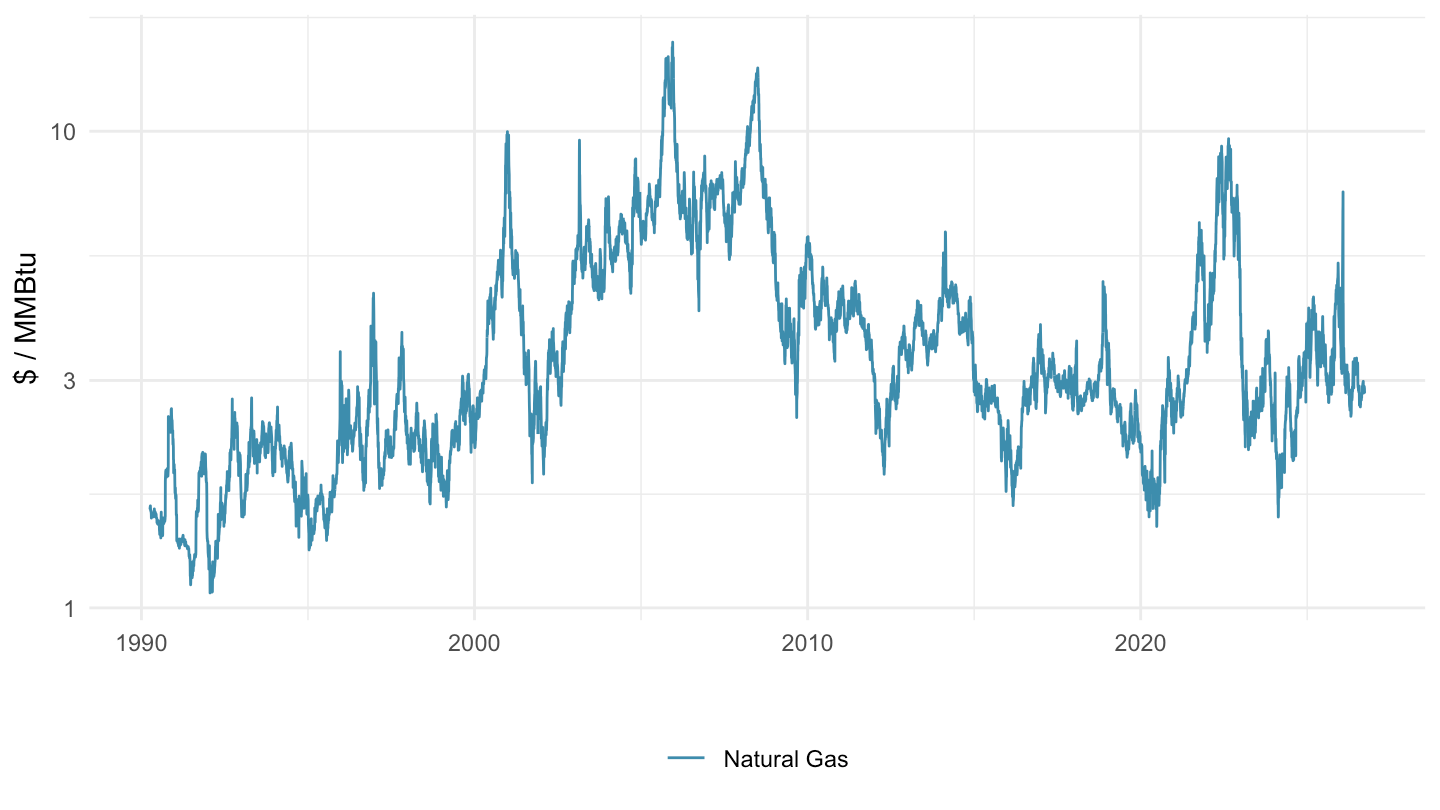
hist_price_chart("Natural Gas", from = "2010-01-01", ylab = "$ / MMBtu")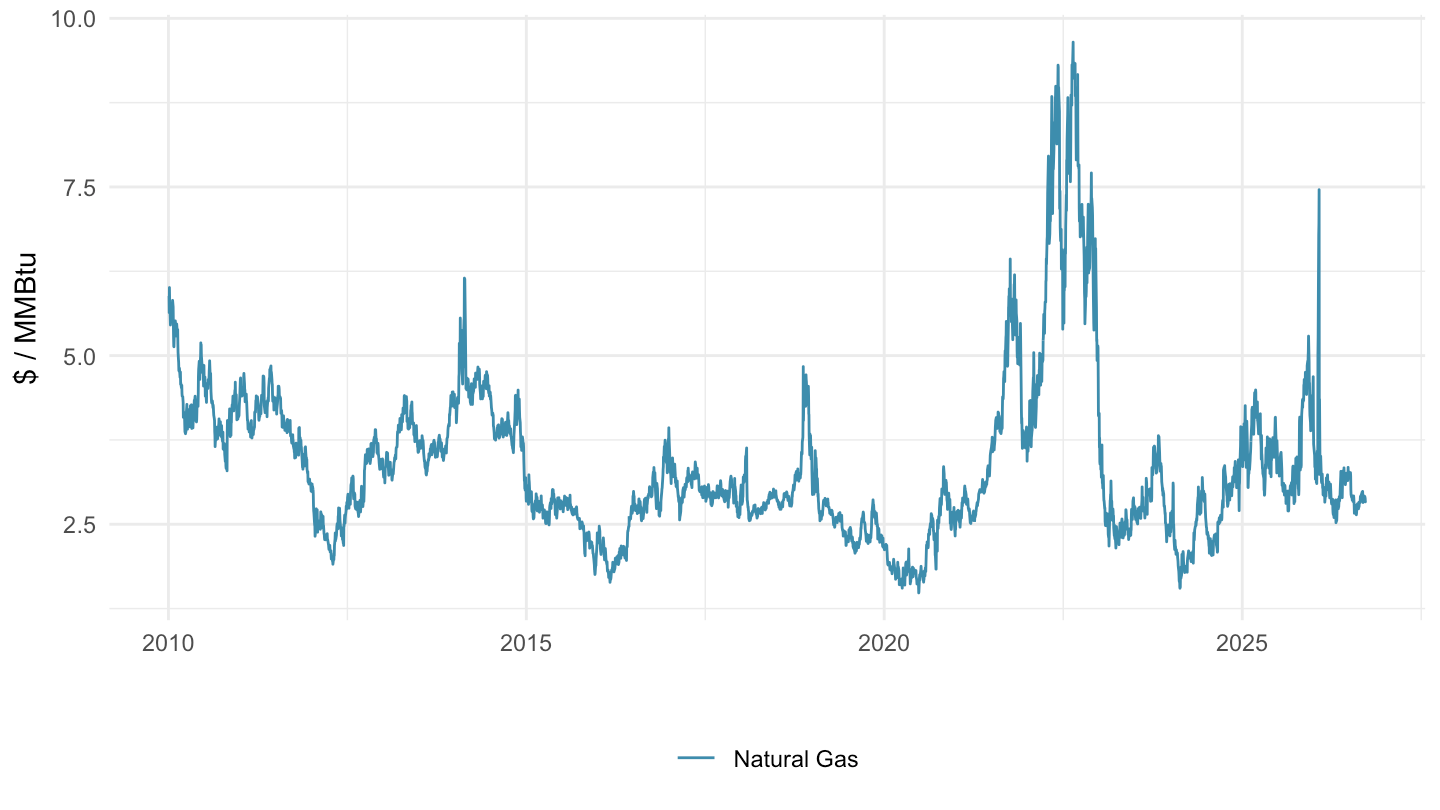
hist_price_chart(c("Natural Gas", "Dutch TTF Natural Gas"),
                  from = "2017-10-23", ylab = "$ ou € / MMBtu-MWh")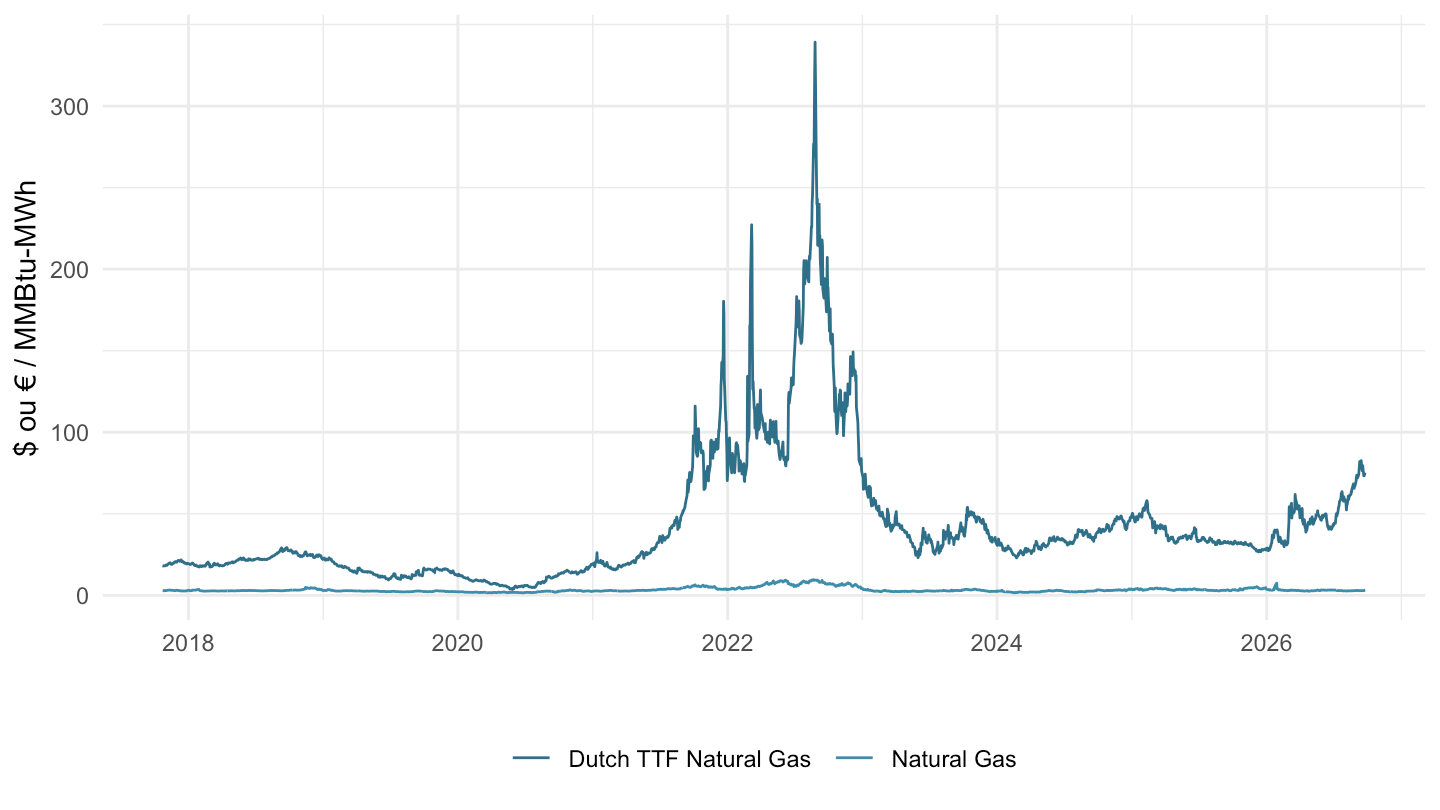
Henry Hub en $/MMBtu, TTF en €/MWh : échelles non directement comparables (unités et devises différentes), mais utile pour visualiser le découplage des prix du gaz US et européen depuis la crise énergétique de 2021-2022.
hist_price_chart("London Gas Oil", ylab = "$ / tonne")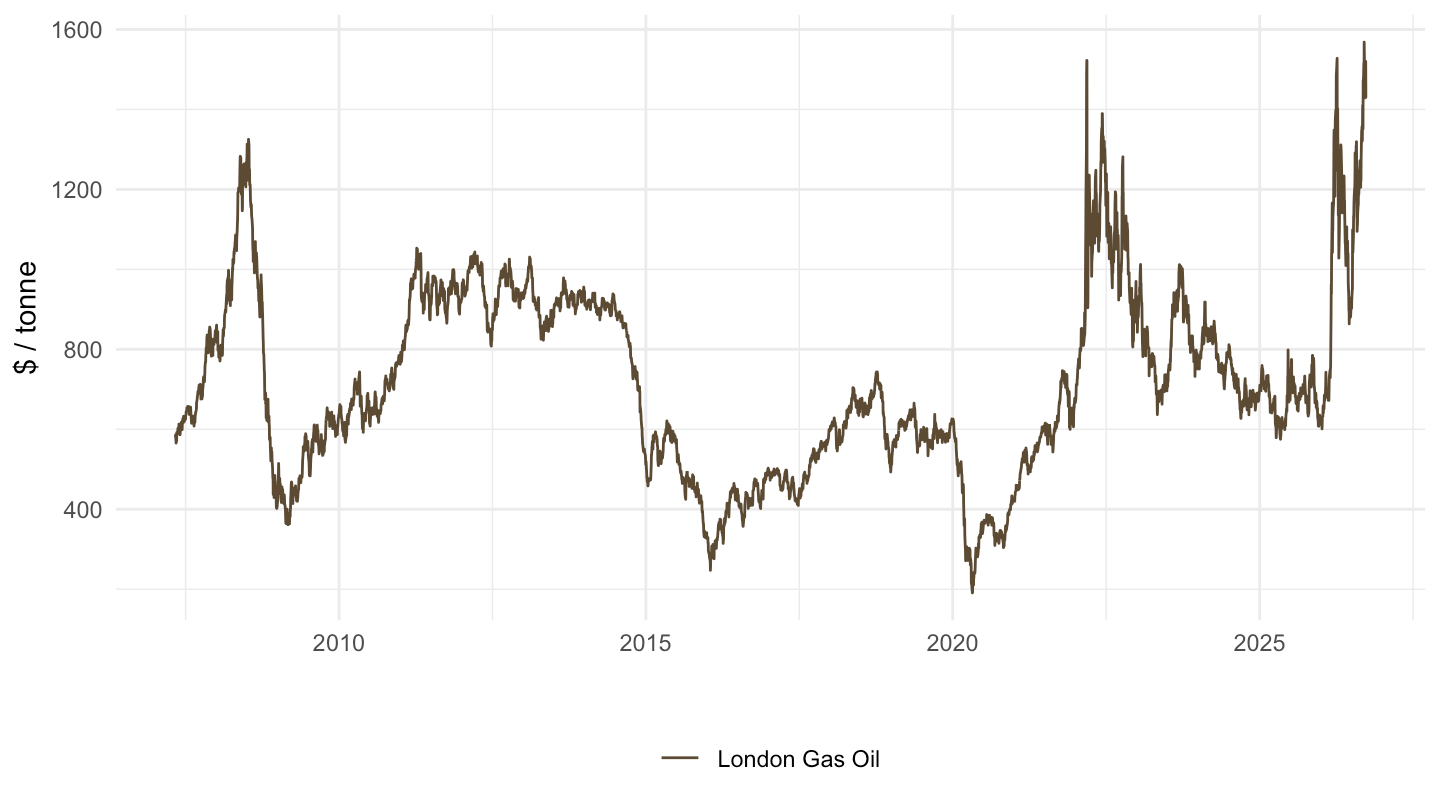
hist_price_chart("Carbon Emissions", ylab = "€ / tonne")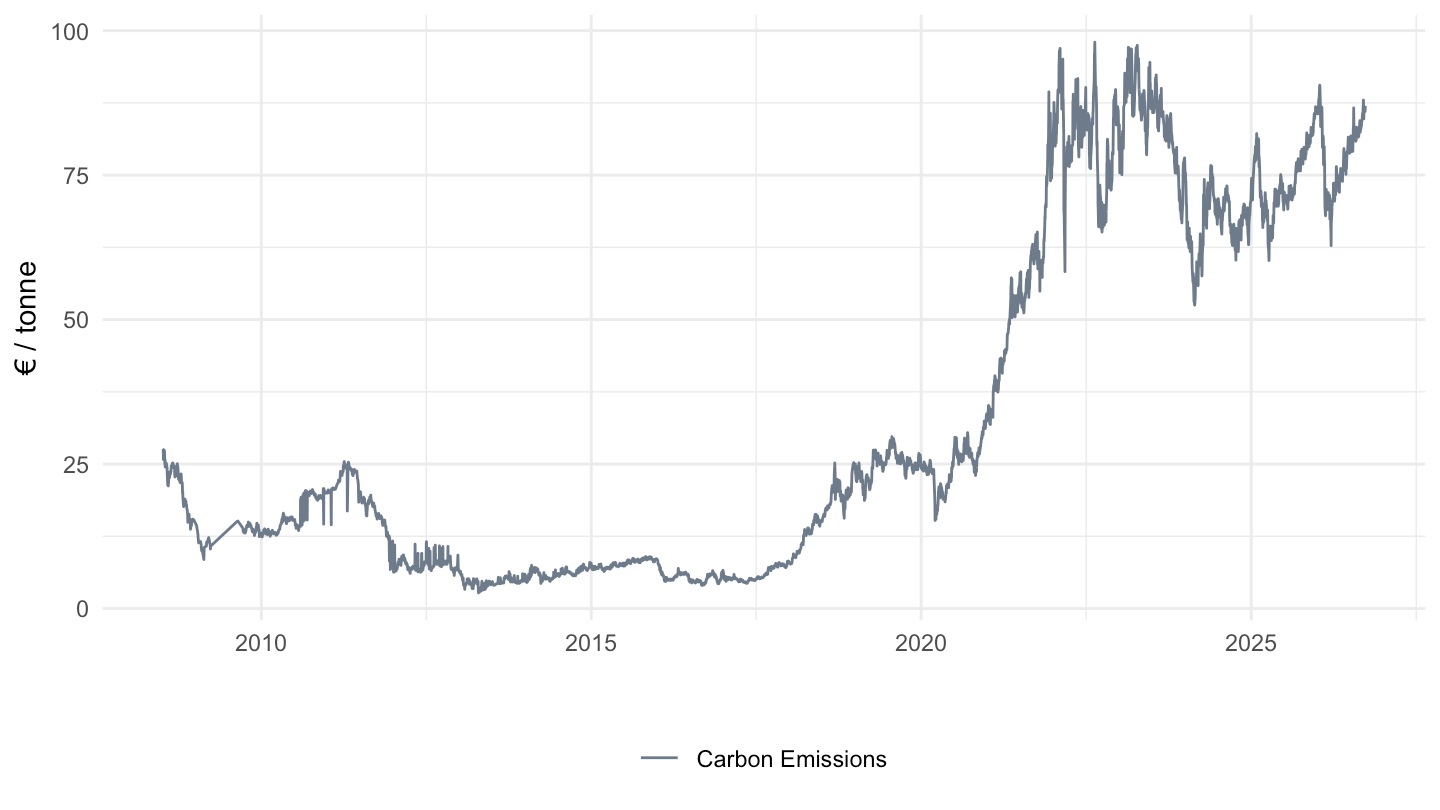
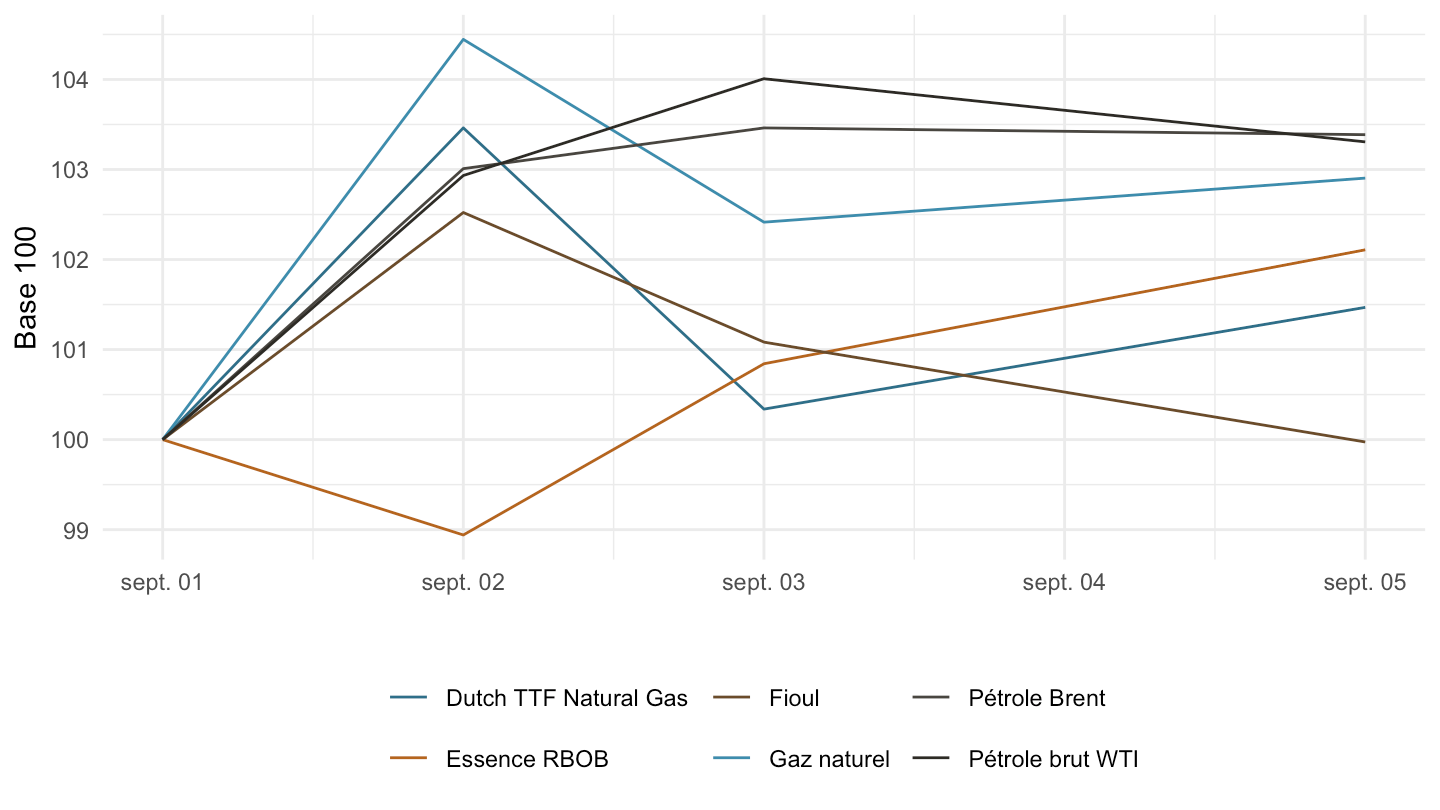
sel <- c("Pétrole brut WTI", "Pétrole Brent", "Gaz naturel",
         "Dutch TTF Natural Gas", "Fioul", "Essence RBOB")
d <- energy_futures |> filter(name %in% sel)

if (n_distinct(d$scraped_date) < 2) {
  knitr::asis_output(paste0(
    "_Série trop courte (", n_distinct(d$scraped_date),
    " relevé) — le graphique se remplira au fil des instantanés quotidiens._"))
} else {
  d |>
    group_by(name) |>
    arrange(scraped_date) |>
    mutate(idx = 100 * last / first(last)) |>
    ggplot() + geom_line(aes(x = scraped_date, y = idx, color = name)) +
    theme_minimal() + xlab("") + ylab("Base 100") +
    scale_color_commodity() +
    theme(legend.position = "bottom", legend.title = element_blank())
}