| LAST_COMPILE |
|---|
| 2024-06-20 |
Commodities
Data - Investing
Info
LAST_COMPILE
LAST_DOWNLOAD
Code
tibble(LAST_DOWNLOAD = as.Date(file.info("~/Library/Mobile\ Documents/com~apple~CloudDocs/website/data/investing/commodities.RData")$mtime)) %>%
print_table_conditional()| LAST_DOWNLOAD |
|---|
| 2020-11-14 |
Info
Code
i_g("bib/ukraine/soyuz-kourou-1.png")
Nobs
Code
commodities_var %>%
  select(name, full_name) %>%
  right_join(commodities %>%
               rename(name = commodity) %>%
               group_by(name) %>%
               summarise(Nobs = n(),
                         value1 = last(Close)), by = "name") %>%
  arrange(-Nobs) %>%
  {if (is_html_output()) datatable(., filter = 'top', rownames = F) else .}
Crude Oil WTI, Rough Rice, US Wheat
Code
commodities %>%
  filter(commodity %in% c("Rough Rice", "US Wheat", "Crude Oil WTI"),
         Date >= as.Date("2000-01-01"),
         Date <= as.Date("2016-01-01")) %>%
  group_by(commodity) %>%
  mutate(Close = 100*Close/Close[Date == as.Date("2011-01-19")]) %>%
  ggplot + geom_line(aes(x = Date, y = Close, color = commodity)) +
  theme_minimal() + xlab("") + ylab("Index (100 = 2007)") +
  scale_x_date(breaks = seq(1960, 2020, 1) %>% paste0("-01-01") %>% as.Date,
               labels = date_format("%y")) +
  scale_y_log10(breaks = seq(20, 500, 20)) +
  scale_color_manual(values = viridis(4)[1:3]) +
  theme(legend.position = c(0.15, 0.9),
        legend.title = element_blank())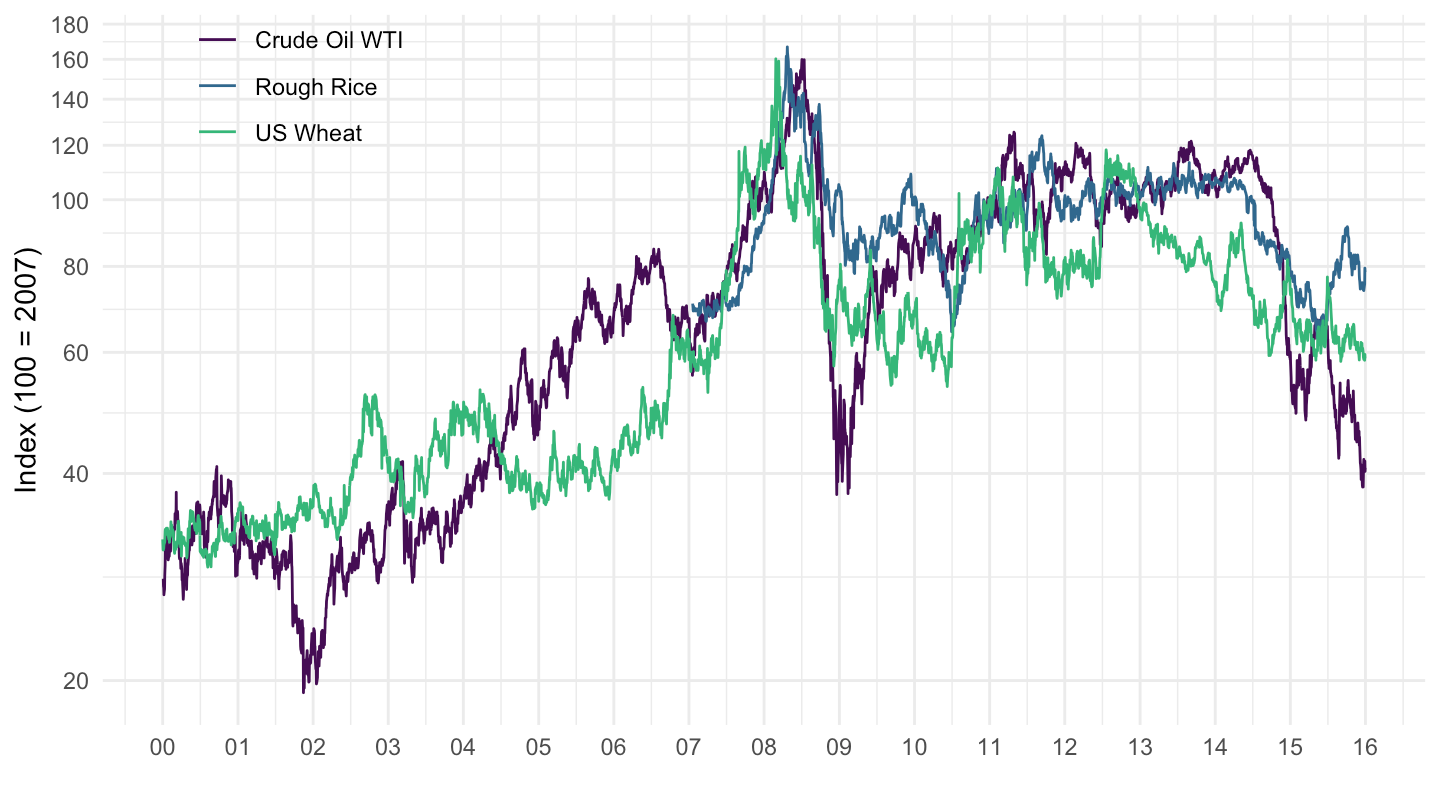
Gold, Cocoa
Code
commodities %>%
  filter(commodity %in% c("Gold", "US Cocoa")) %>%
  ggplot + geom_line(aes(x = Date, y = Close, color = commodity)) +
  theme_minimal() + xlab("") + ylab("Price") +
  scale_x_date(breaks = seq(1960, 2020, 2) %>% paste0("-01-01") %>% as.Date,
               labels = date_format("%y")) +
  scale_y_log10(breaks = seq(0, 5000, 500),
                labels = dollar_format(accuracy = 1)) +
  scale_color_manual(values = viridis(5)[1:4]) +
  theme(legend.position = c(0.25, 0.9),
        legend.title = element_blank())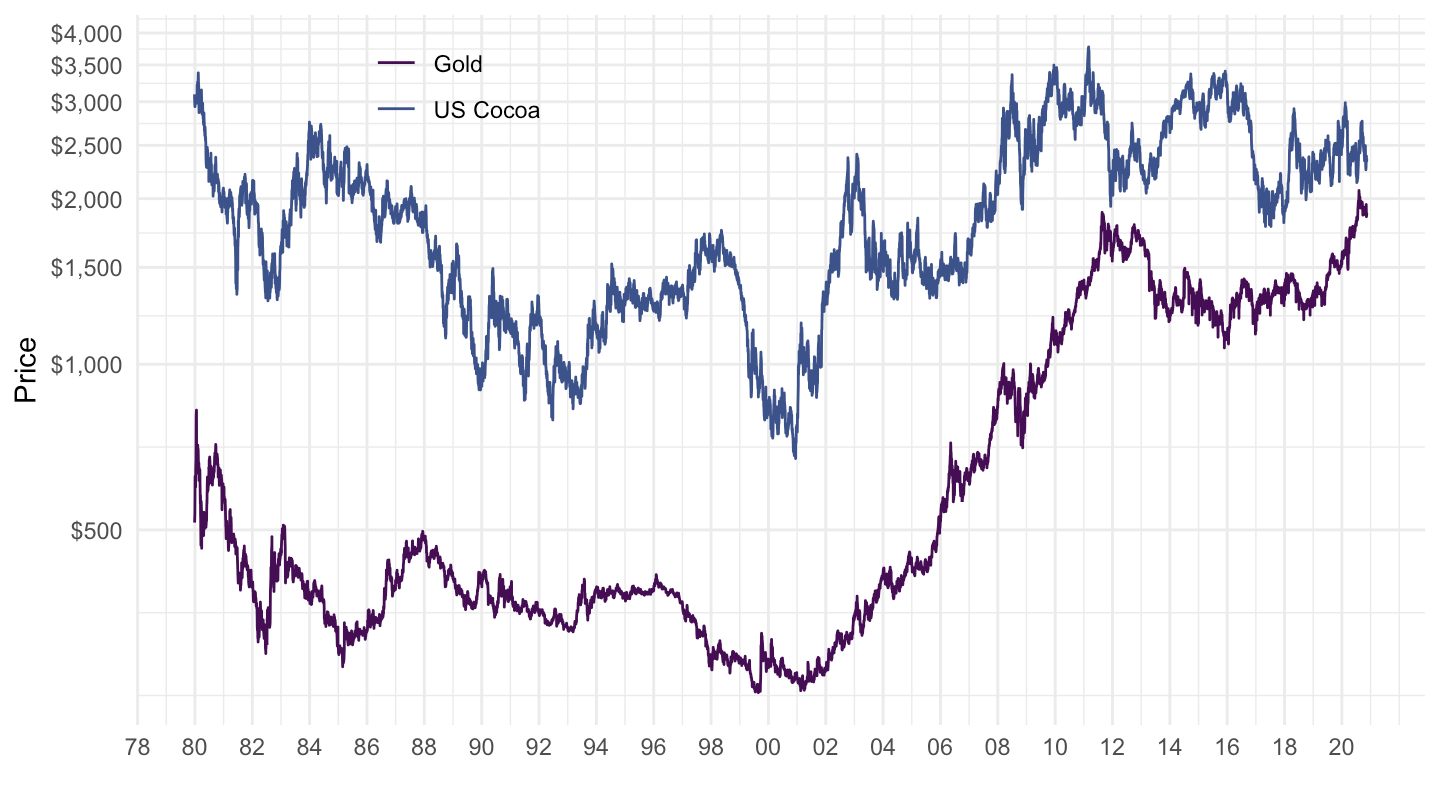
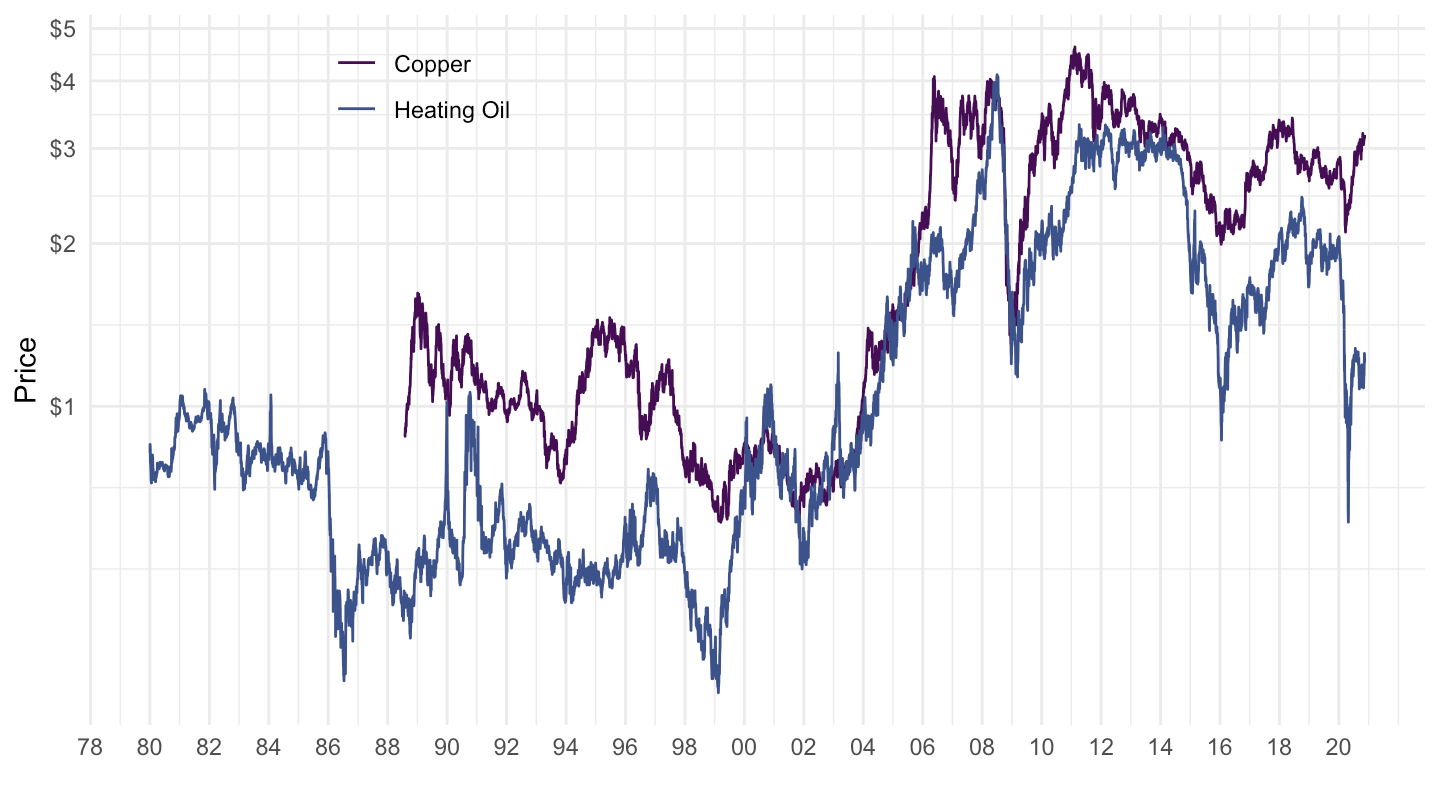
Copper, Heating Oil
Code
commodities %>%
  filter(commodity %in% c("Copper", "Heating Oil"),
         Open >= 0.001) %>%
  ggplot + geom_line(aes(x = Date, y = Close, color = commodity)) +
  theme_minimal() + xlab("") + ylab("Price") +
  scale_x_date(breaks = seq(1960, 2020, 2) %>% paste0("-01-01") %>% as.Date,
               labels = date_format("%y")) +
  scale_y_log10(breaks = seq(0, 10, 1),
                labels = dollar_format(accuracy = 1)) +
  scale_color_manual(values = viridis(5)[1:4]) +
  theme(legend.position = c(0.25, 0.9),
        legend.title = element_blank())