Code
tibble(LAST_DOWNLOAD = as.Date(file.info("~/Library/Mobile\ Documents/com~apple~CloudDocs/website/data/investing/bonds.RData")$mtime)) %>%
print_table_conditional()| LAST_DOWNLOAD |
|---|
| 2022-07-04 |
Data - Investing
tibble(LAST_DOWNLOAD = as.Date(file.info("~/Library/Mobile\ Documents/com~apple~CloudDocs/website/data/investing/bonds.RData")$mtime)) %>%
print_table_conditional()| LAST_DOWNLOAD |
|---|
| 2022-07-04 |
| LAST_COMPILE |
|---|
| 2024-06-20 |
| Date | Nobs |
|---|---|
| 2022-07-04 | 7 |
bonds %>%
  group_by(symbol) %>%
  summarise(Nobs = n()) %>%
  arrange(-Nobs) %>%
{if (is_html_output()) datatable(., filter = 'top', rownames = F) else .}bonds %>%
group_by(symbol) %>%
arrange(Date) %>%
summarise(Date = last(Date),
Close = last(Close)) %>%
arrange(desc(Date)) %>%
{if (is_html_output()) datatable(., filter = 'top', rownames = F) else .}bonds %>%
filter(Date == as.Date("2020-09-01"),
Close < 0) %>%
select(bond = symbol, Close) %>%
arrange(Close) %>%
{if (is_html_output()) datatable(., filter = 'top', rownames = F) else .}i_g("bib/investing/bonds_ex1-bind.png")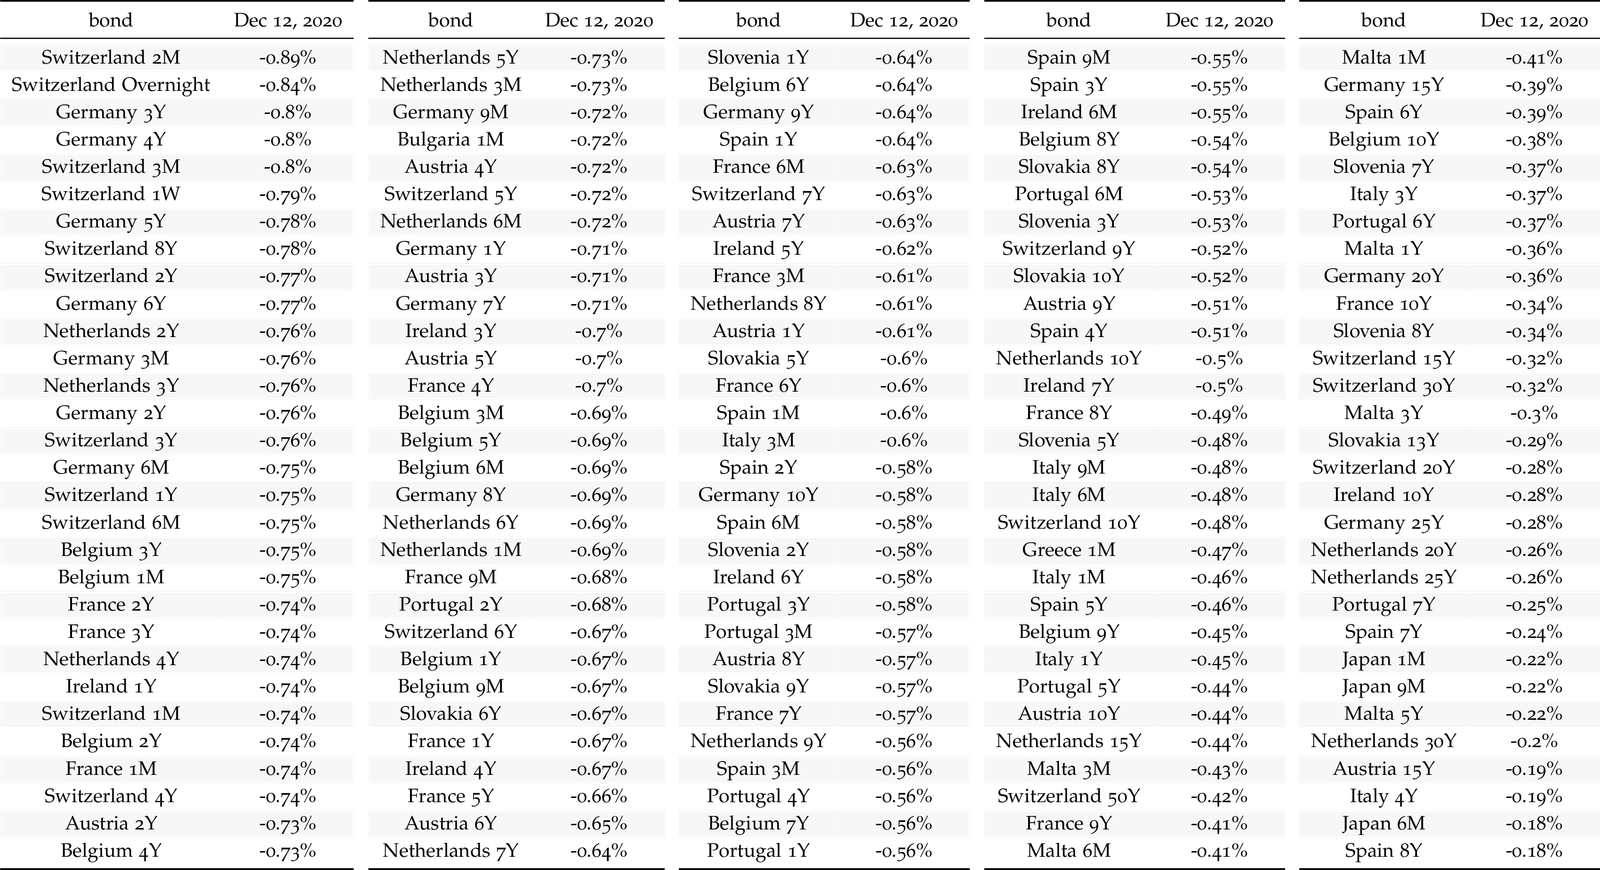
bonds %>%
  filter(Date == as.Date("2020-12-15"),
         grepl("Greece", symbol)) %>%
  select(Bond = symbol, `Dec 15, 2020` = Close) %>%
  arrange(`Dec 15, 2020`) %>%
  mutate(`Dec 15, 2020` = paste0(round(`Dec 15, 2020`, 3), "%")) %>%
{if (is_html_output()) datatable(., filter = 'top', rownames = F) else .}i_g("bib/investing/bonds_ex2.png")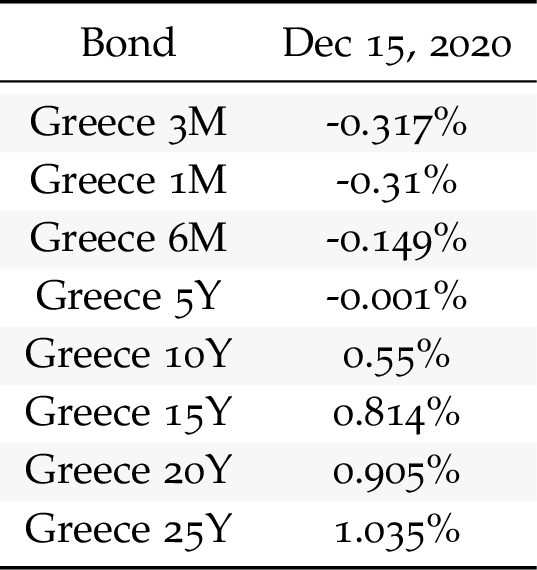
bonds %>%
  filter(symbol %in% c("Germany 30Y", "Italy 30Y", "France 30Y", "U.S. 30Y"),
         Date >= as.Date("2020-04-01")) %>%
  ggplot + geom_line(aes(x = Date, y = Close/100, color = symbol, linetype = symbol)) +
  theme_minimal() + xlab("") + ylab("30-Year Yield (%)") +
  scale_x_date(breaks ="1 week",
               labels = date_format("%b-%d")) +
  scale_y_continuous(breaks = 0.01*seq(-10, 30, 0.2),
                     labels = percent_format(accuracy = 0.1),
                     limits = c(-0.002, 0.035)) +
  scale_color_manual(values = viridis(5)[1:4]) +
  theme(legend.position = c(0.6, 0.9),
        legend.title = element_blank(),
        legend.direction = "horizontal")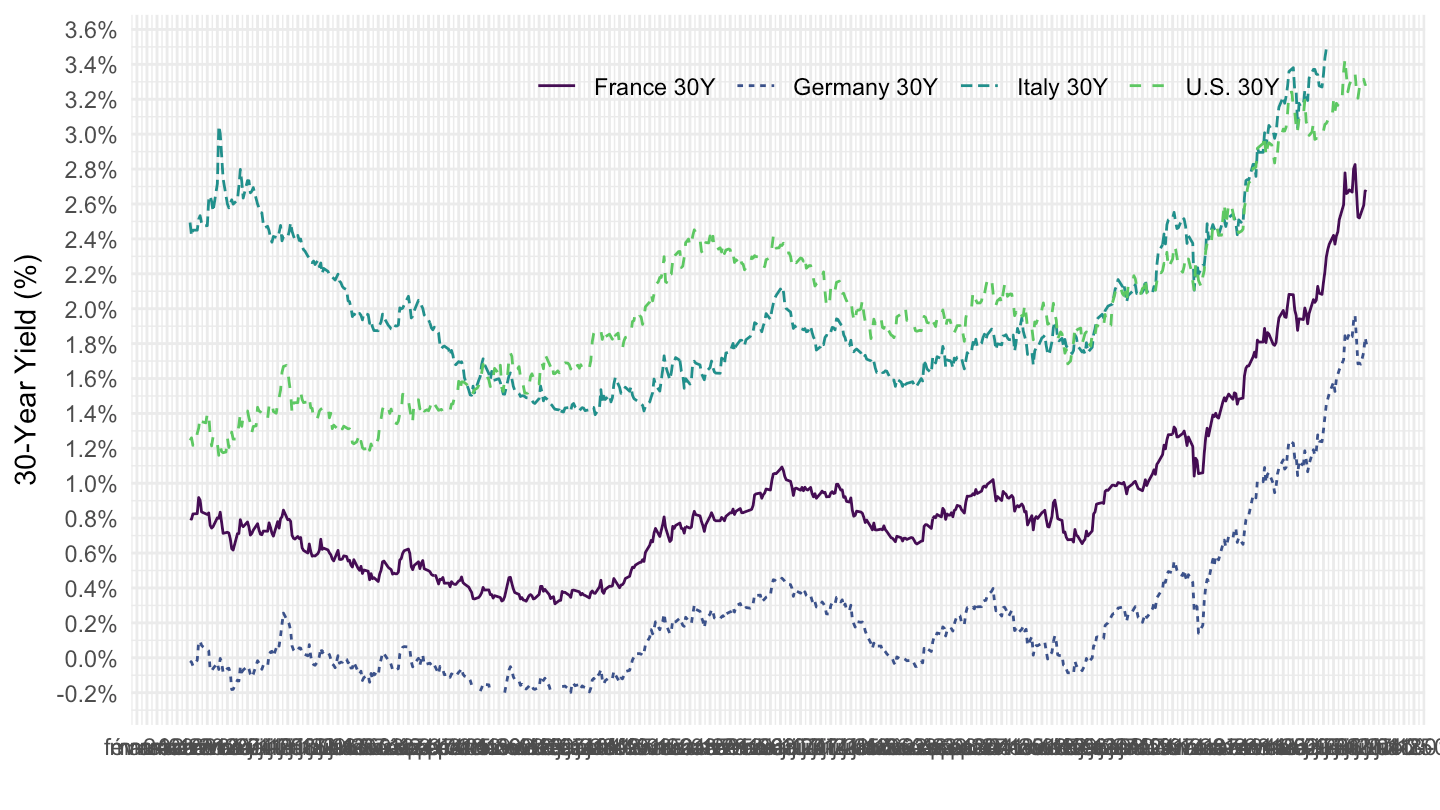
bonds %>%
  filter(symbol %in% c("Germany 10Y", "Germany 20Y", "Germany 30Y"),
         Date >= as.Date("2019-10-01")) %>%
  ggplot + geom_line(aes(x = Date, y = Close/100, color = symbol, linetype = symbol)) +
  theme_minimal() + xlab("") + ylab("Germany Government Bonds (%)") +
  scale_x_date(breaks ="3 months",
               labels = date_format("%b-%y")) +
  scale_y_continuous(breaks = 0.01*seq(-10, 30, 0.2),
                     labels = percent_format(accuracy = 0.1)) +
  scale_color_manual(values = viridis(5)[1:4]) +
  theme(legend.position = c(0.3, 0.1),
        legend.title = element_blank(),
        legend.direction = "horizontal")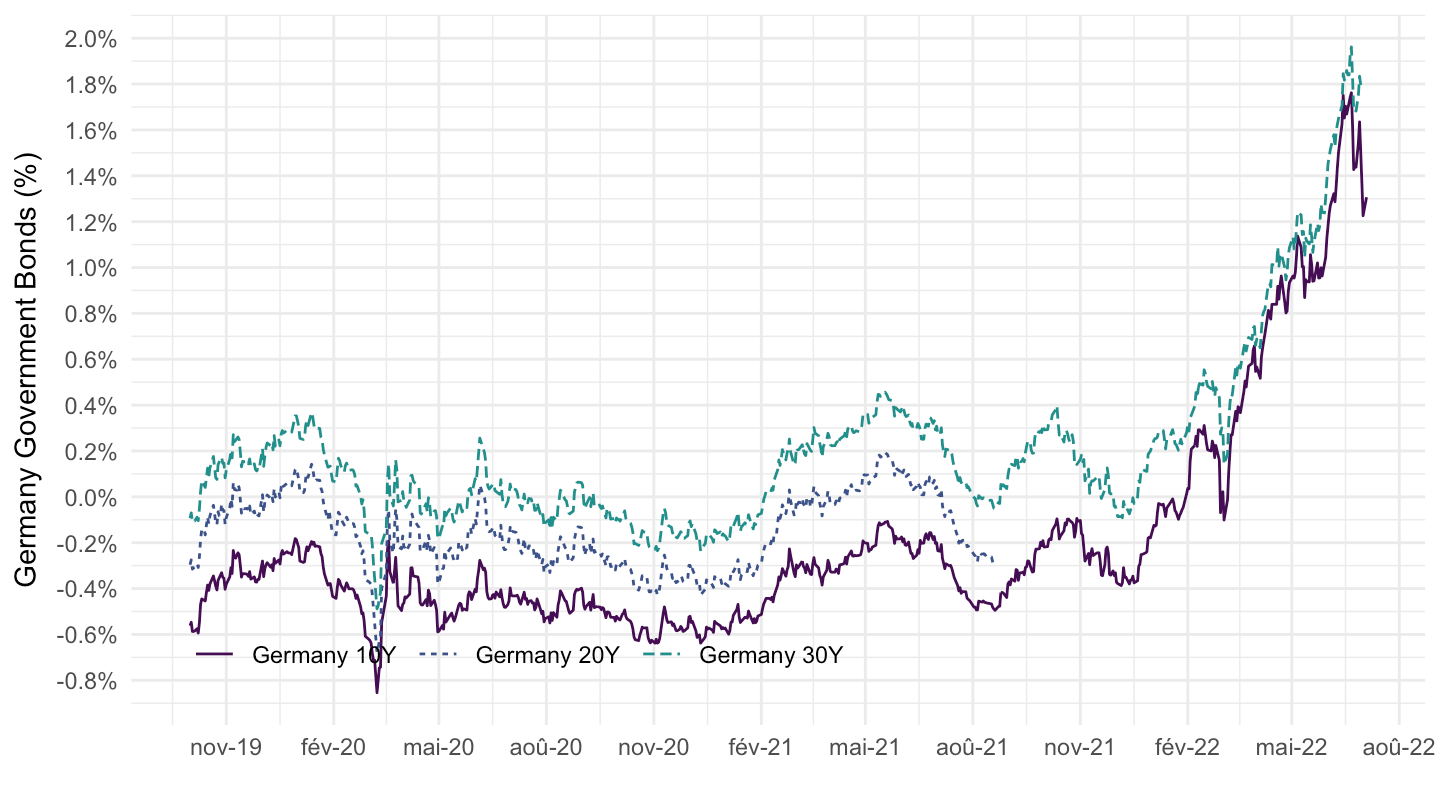
bonds %>%
  filter(symbol %in% c("Germany 10Y", "Netherlands 10Y", "France 10Y")) %>%
  select(symbol, Date, Close) %>%
  ggplot + geom_line(aes(x = Date, y = Close/100, color = symbol)) +
  theme_minimal() + xlab("") + ylab("10-Year Yield (%)") +
  scale_x_date(breaks = seq(1960, 2020, 5) %>% paste0("-01-01") %>% as.Date,
               labels = date_format("%y")) +
  scale_y_continuous(breaks = 0.01*seq(-10, 30, 1),
                     labels = percent_format(accuracy = 1)) +
  scale_color_manual(values = viridis(5)[1:4]) +
  theme(legend.position = c(0.8, 0.9),
        legend.title = element_blank())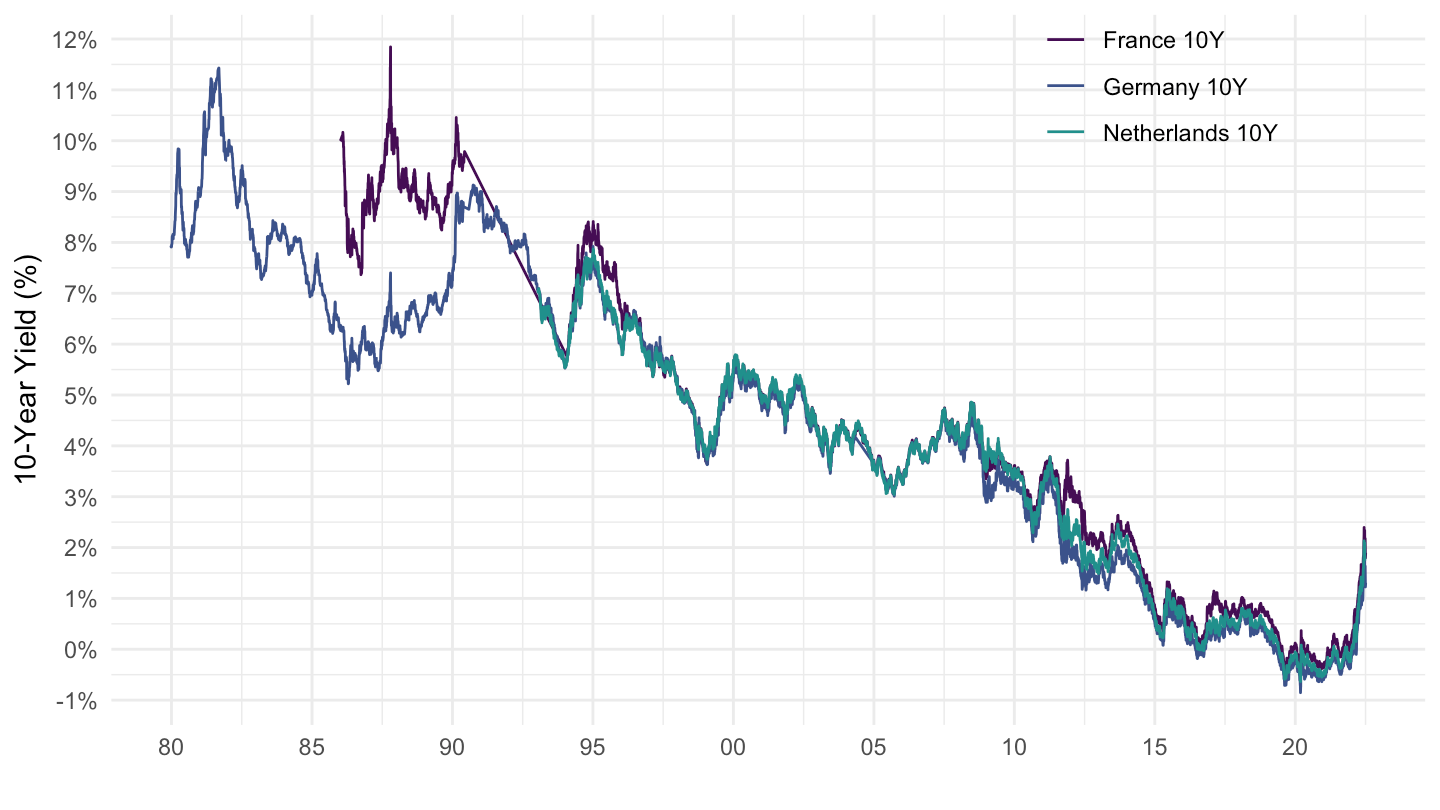
bonds %>%
  filter(symbol %in% c("Germany 10Y", "Italy 10Y")) %>%
  select(symbol, Date, Close) %>%
  spread(symbol, Close) %>%
  mutate(`Spread` = `Italy 10Y` - `Germany 10Y`) %>%
  gather(variable, value, -Date) %>%
  ggplot + geom_line(aes(x = Date, y = value/100, color = variable)) +
  theme_minimal() + xlab("") + ylab("10-Year Yield (%)") +
  scale_x_date(breaks = seq(1960, 2024, 2) %>% paste0("-01-01") %>% as.Date,
               labels = date_format("%y")) +
  scale_y_continuous(breaks = 0.01*seq(-10, 30, 1),
                     labels = percent_format(accuracy = 1)) +
  scale_color_manual(values = viridis(5)[1:4]) +
  theme(legend.position = c(0.8, 0.9),
        legend.title = element_blank())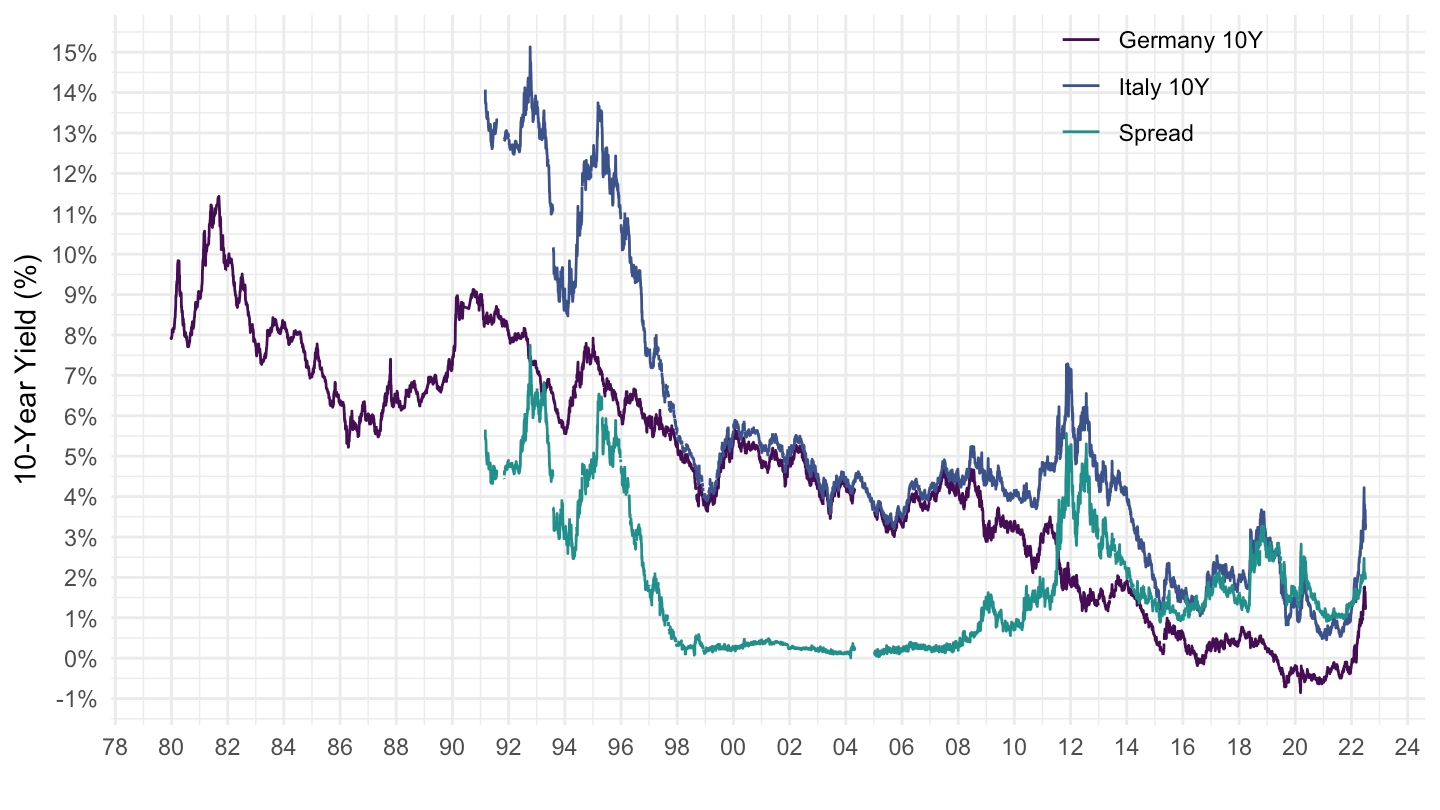
bonds %>%
  filter(symbol %in% c("Germany 10Y", "Italy 10Y"),
         Date >= as.Date("2014-01-01")) %>%
  select(symbol, Date, Close) %>%
  spread(symbol, Close) %>%
  mutate(`Spread` = `Italy 10Y` - `Germany 10Y`) %>%
  gather(variable, value, -Date) %>%
  ggplot + geom_line(aes(x = Date, y = value/100, color = variable)) +
  theme_minimal() + xlab("") + ylab("10-Year (%)") +
  scale_x_date(breaks = seq(1960, 2024, 1) %>% paste0("-01-01") %>% as.Date,
               labels = date_format("%y")) +
  scale_y_continuous(breaks = 0.01*seq(-10, 30, 1),
                     labels = percent_format(accuracy = 1)) +
  scale_color_manual(values = viridis(5)[1:4]) +
  theme(legend.position = c(0.5, 0.9),
        legend.title = element_blank())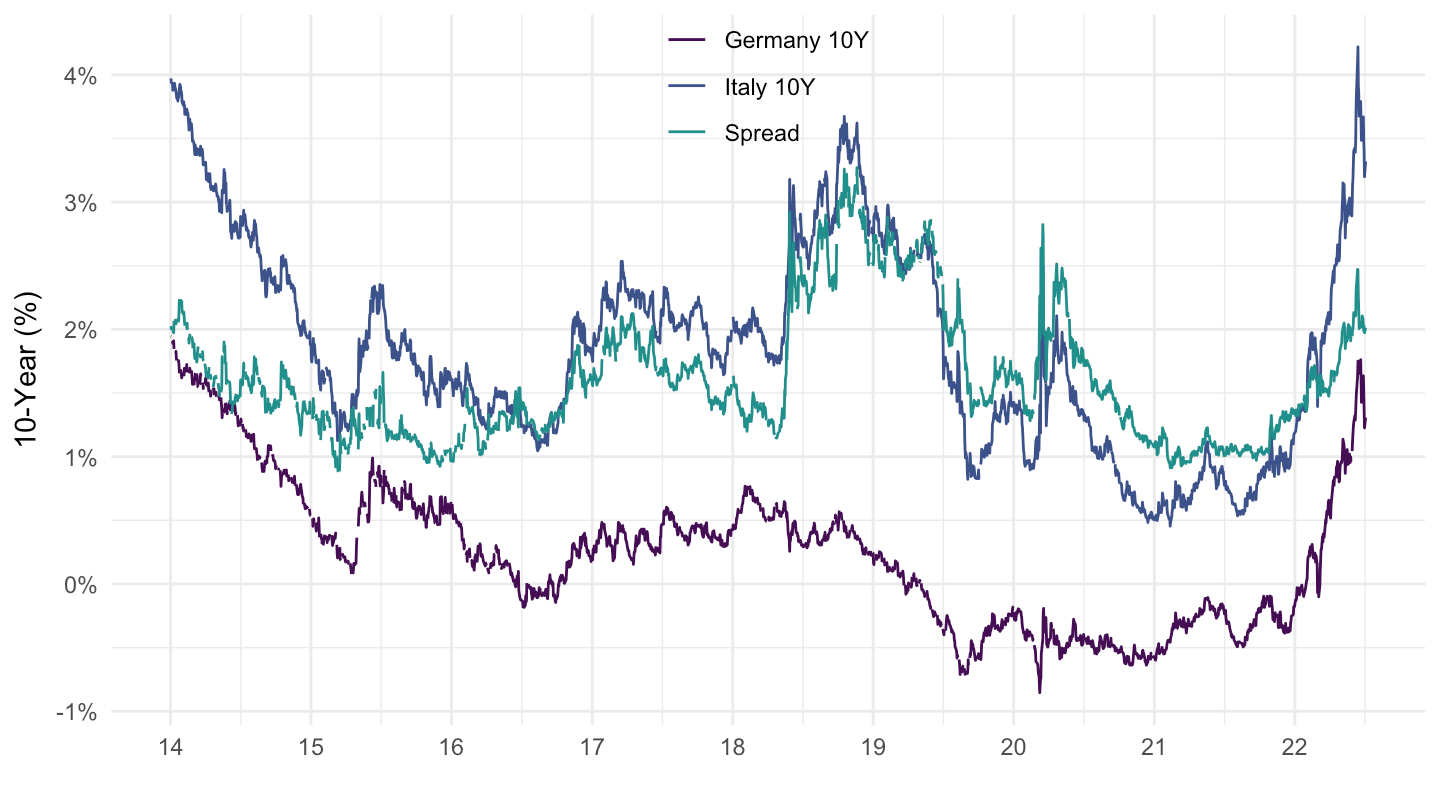
bonds %>%
  filter(symbol %in% c("Germany 10Y", "Italy 10Y"),
         Date >= as.Date("2010-09-01")) %>%
  select(symbol, Date, Close) %>%
  spread(symbol, Close) %>%
  mutate(`Spread` = `Italy 10Y` - `Germany 10Y`) %>%
  gather(variable, value, -Date) %>%
  ggplot + geom_line(aes(x = Date, y = value/100, color = variable)) +
  theme_minimal() + xlab("") + ylab("10-Year (%)") +
  scale_x_date(breaks = seq(1960, 2023, 1) %>% paste0("-01-01") %>% as.Date,
               labels = date_format("%y")) +
  scale_y_continuous(breaks = 0.01*seq(-10, 30, 1),
                     labels = percent_format(accuracy = 1)) +
  scale_color_manual(values = viridis(5)[1:4]) +
  theme(legend.position = c(0.5, 0.9),
        legend.title = element_blank()) +
  geom_vline(xintercept = as.Date("2012-07-26"), linetype = "dashed", color = "black")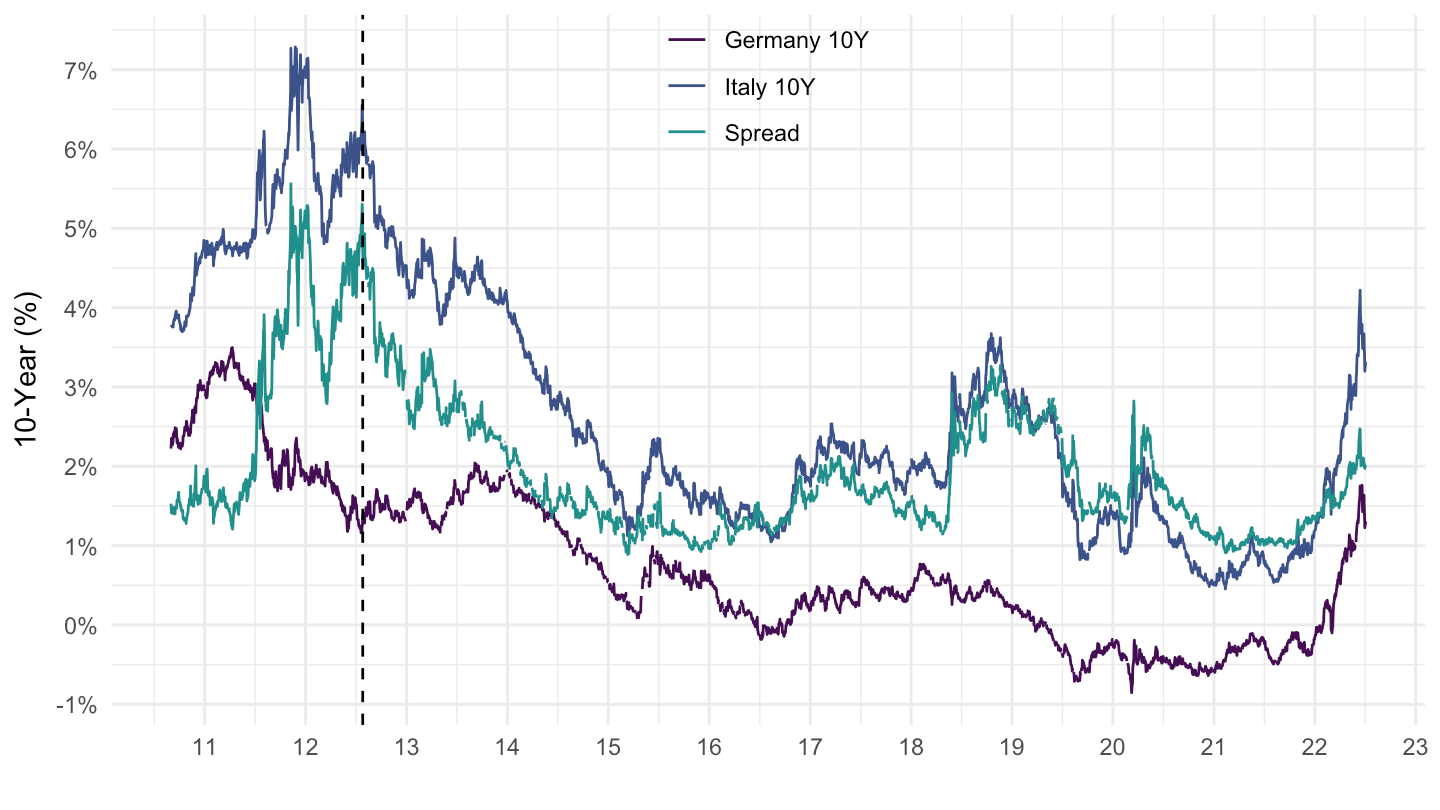
bonds %>%
  filter(symbol %in% c("Germany 10Y", "Italy 10Y"),
         Date >= as.Date("2005-01-01")) %>%
  select(symbol, Date, Close) %>%
  spread(symbol, Close) %>%
  mutate(`Spread` = `Italy 10Y` - `Germany 10Y`) %>%
  gather(variable, value, -Date) %>%
  ggplot + geom_line(aes(x = Date, y = value/100, color = variable)) +
  theme_minimal() + xlab("") + ylab("10-Year Yield (%)") +
  scale_x_date(breaks = seq(1960, 2023, 1) %>% paste0("-01-01") %>% as.Date,
               labels = date_format("%y")) +
  scale_y_continuous(breaks = 0.01*seq(-10, 30, 1),
                     labels = percent_format(accuracy = 1)) +
  scale_color_manual(values = viridis(5)[1:4]) +
  theme(legend.position = c(0.8, 0.9),
        legend.title = element_blank()) +
  geom_vline(xintercept = as.Date("2012-07-26"), linetype = "dashed", color = "grey")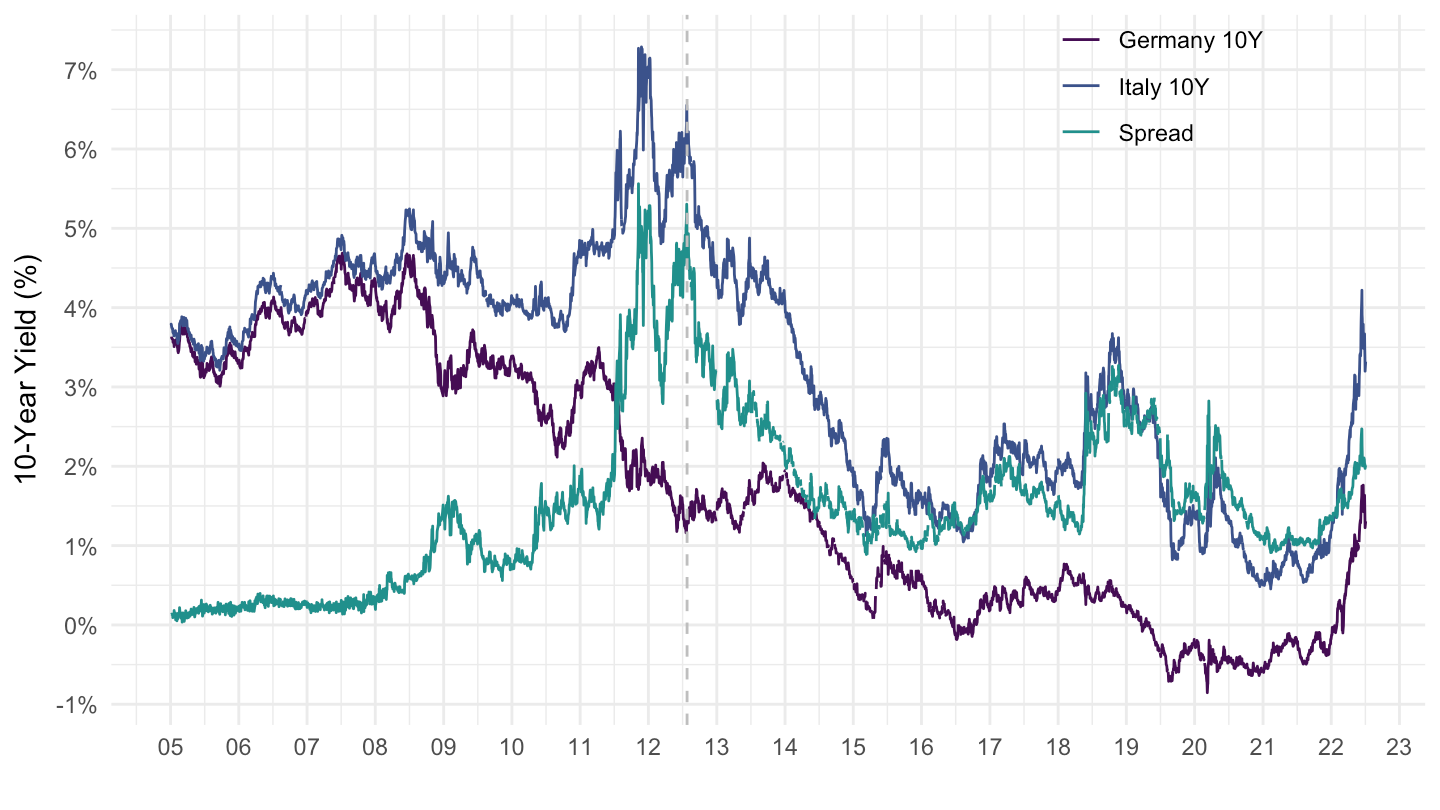
bonds %>%
  filter(symbol %in% c("Germany 10Y", "Italy 10Y"),
         Date >= as.Date("2021-01-01")) %>%
  select(symbol, Date, Close) %>%
  spread(symbol, Close) %>%
  mutate(`Spread` = `Italy 10Y` - `Germany 10Y`) %>%
  gather(variable, value, -Date) %>%
  ggplot + geom_line(aes(x = Date, y = value/100, color = variable)) +
  theme_minimal() + xlab("") + ylab("10-Year Yield (%)") +
  scale_x_date(breaks = "2 months",
               labels = date_format("%b %Y")) +
  scale_y_continuous(breaks = 0.01*seq(-10, 30, .2),
                     labels = percent_format(accuracy = .1)) +
  scale_color_manual(values = viridis(5)[1:4]) +
  theme(legend.position = c(0.2, 0.9),
        legend.title = element_blank()) +
  geom_vline(xintercept = as.Date("2012-07-26"), linetype = "dashed", color = "grey")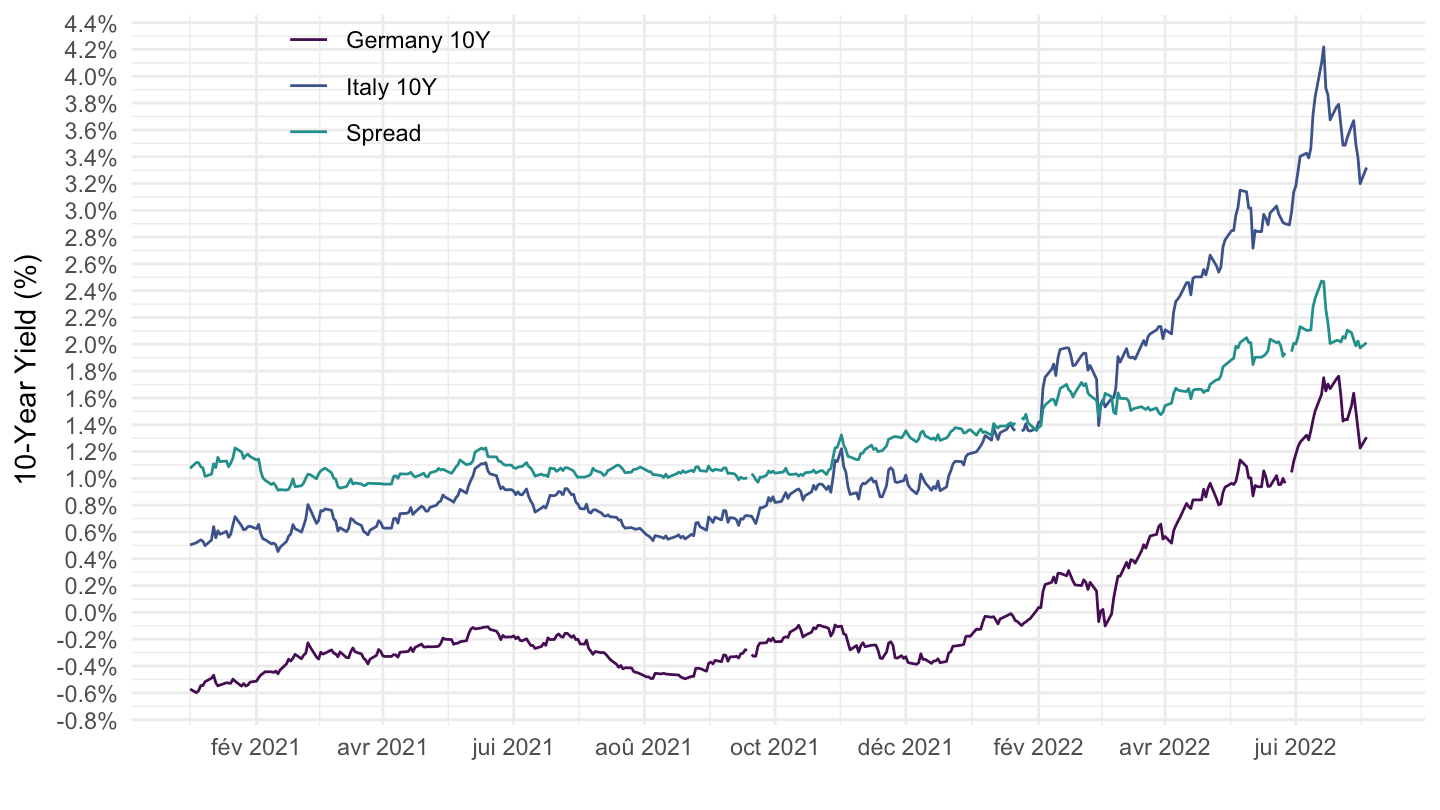
bonds %>%
  filter(symbol %in% c("Germany 10Y", "Italy 10Y", "France 10Y", "U.S. 10Y"),
         Date >= as.Date("2021-01-01")) %>%
  select(symbol, date = Date, obsValue = Close) %>%
  mutate(obsValue = obsValue/100) %>%
  mutate(Location = gsub(" 10Y", "", symbol),
         Location = ifelse(Location == "U.S.", "United States", Location)) %>%
  left_join(colors, by = c("Location" = "country")) %>%
  mutate(color = ifelse(Location == "United States", color2, color)) %>%
  ggplot + geom_line(aes(x = date, y = obsValue, color = color)) +
  theme_minimal() + xlab("") + ylab("10-Year Yield (%)") +
  scale_x_date(breaks = "2 months",
               labels = date_format("%b %Y")) +
  scale_y_continuous(breaks = 0.01*seq(-10, 30, .2),
                     labels = percent_format(accuracy = .1)) +
  scale_color_identity() + add_4flags +
  theme(legend.position = c(0.2, 0.9),
        legend.title = element_blank()) +
  geom_vline(xintercept = as.Date("2012-07-26"), linetype = "dashed", color = "grey")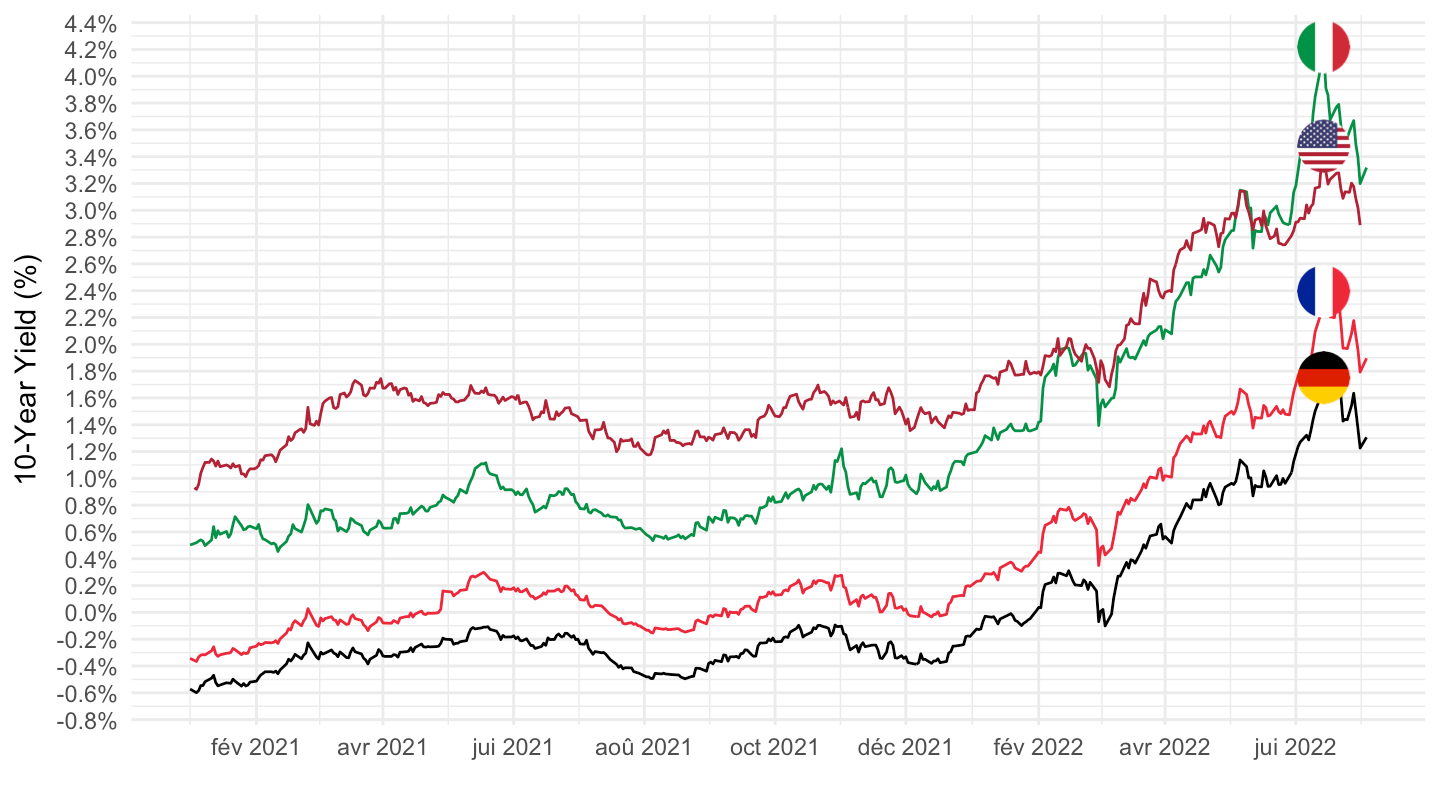
bonds %>%
  filter(symbol %in% c("Germany 10Y", "Italy 10Y", "France 10Y", "U.S. 10Y", "Spain 10Y"),
         Date >= as.Date("2022-01-01")) %>%
  select(symbol, date = Date, obsValue = Close) %>%
  mutate(obsValue = obsValue/100) %>%
  mutate(Location = gsub(" 10Y", "", symbol),
         Location = ifelse(Location == "U.S.", "United States", Location)) %>%
  left_join(colors, by = c("Location" = "country")) %>%
  mutate(color = ifelse(Location == "United States", color2, color)) %>%
  ggplot + geom_line(aes(x = date, y = obsValue, color = color)) +
  theme_minimal() + xlab("") + ylab("10-Year Yield (%)") +
  scale_x_date(breaks = "1 months",
               labels = date_format("%b %Y")) +
  scale_y_continuous(breaks = 0.01*seq(-10, 30, .2),
                     labels = percent_format(accuracy = .1)) +
  scale_color_identity() + add_5flags +
  theme(legend.position = c(0.2, 0.9),
        legend.title = element_blank()) +
  geom_vline(xintercept = as.Date("2012-07-26"), linetype = "dashed", color = "grey")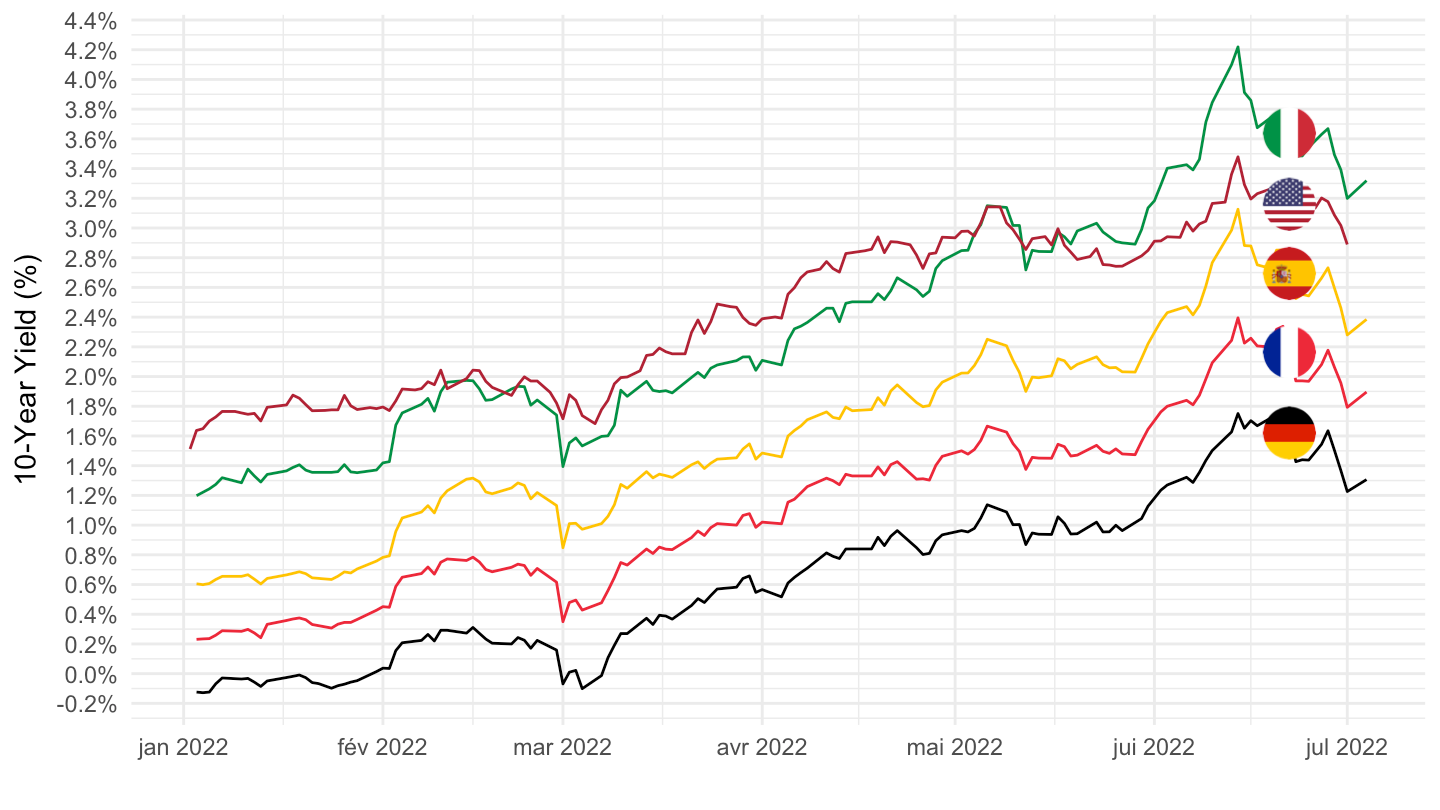
bonds %>%
  filter(symbol %in% c("Germany 10Y", "Italy 10Y", "France 10Y", "Spain 10Y", "Greece 10Y"),
         Date >= as.Date("2007-01-01")) %>%
  select(symbol, date = Date, obsValue = Close) %>%
  mutate(obsValue = obsValue/100) %>%
  mutate(Location = gsub(" 10Y", "", symbol),
         Location = ifelse(Location == "U.S.", "United States", Location)) %>%
  left_join(colors, by = c("Location" = "country")) %>%
  mutate(color = ifelse(Location == "United States", color2, color)) %>%
  ggplot + geom_line(aes(x = date, y = obsValue, color = color)) +
  theme_minimal() + xlab("") + ylab("10-Year Yield (%)") +
  scale_x_date(breaks = "1 year",
               labels = date_format("%y")) +
  scale_y_continuous(breaks = 0.01*seq(-10, 70, 2),
                     labels = percent_format(accuracy = 1)) +
  scale_color_identity() + add_5flags +
  theme(legend.position = c(0.2, 0.9),
        legend.title = element_blank()) +
  geom_vline(xintercept = as.Date("2012-07-26"), linetype = "dashed", color = "black")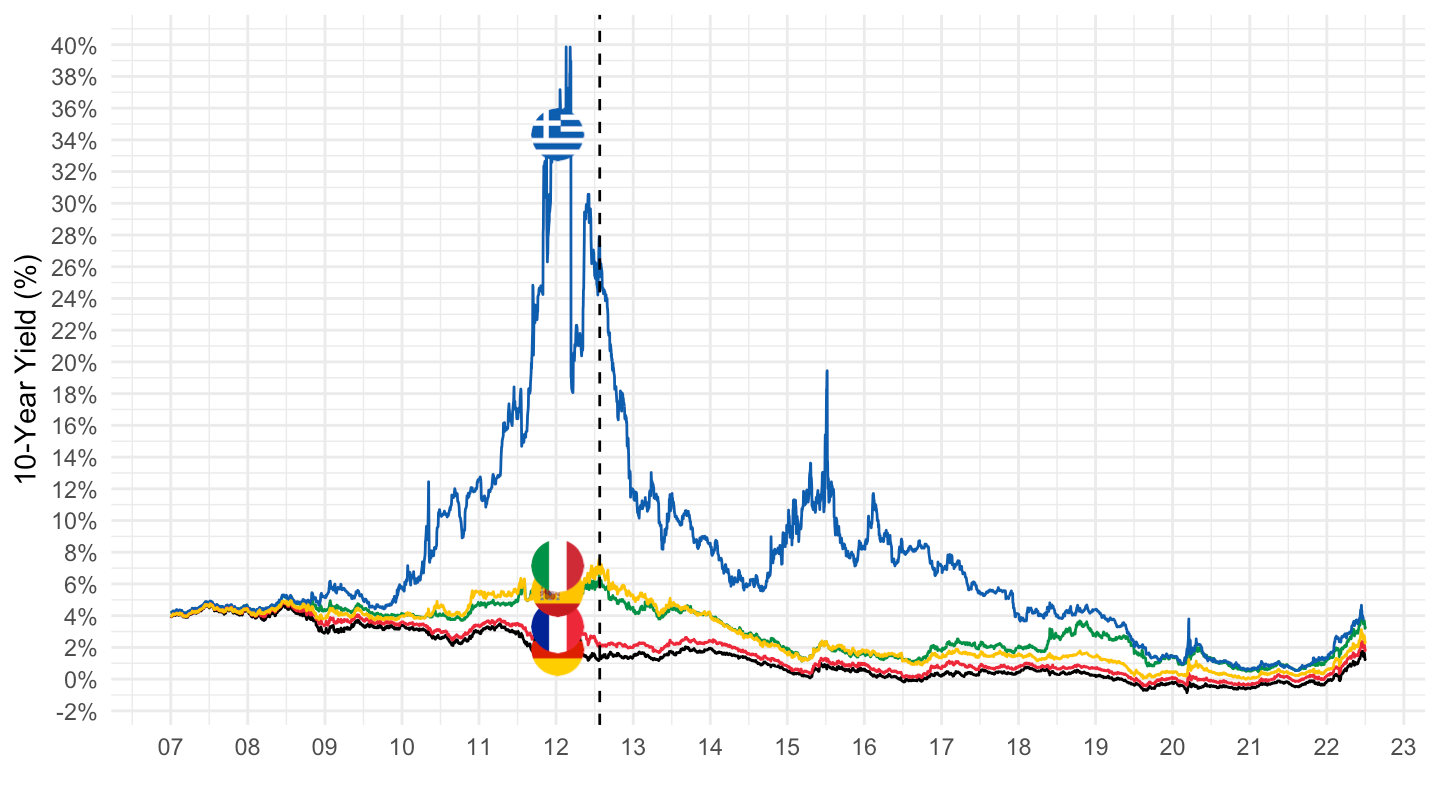
bonds %>%
  filter(symbol %in% c("Germany 10Y", "Italy 10Y", "France 10Y", "Spain 10Y", "Greece 10Y", "U.S. 10Y"),
         Date >= as.Date("2019-07-01")) %>%
  select(symbol, date = Date, obsValue = Close) %>%
  mutate(obsValue = obsValue/100) %>%
  mutate(Location = gsub(" 10Y", "", symbol),
         Location = ifelse(Location == "U.S.", "United States", Location)) %>%
  left_join(colors, by = c("Location" = "country")) %>%
  mutate(color = ifelse(Location == "United States", color2, color)) %>%
  ggplot + geom_line(aes(x = date, y = obsValue, color = color)) +
  theme_minimal() + xlab("") + ylab("10-Year Yield (%)") +
  scale_x_date(breaks = "6 months",
               labels = date_format("%b %Y")) +
  scale_y_continuous(breaks = 0.01*seq(-10, 30, .2),
                     labels = percent_format(accuracy = .1)) +
  scale_color_identity() + add_6flags +
  theme(legend.position = c(0.2, 0.9),
        legend.title = element_blank()) +
  geom_vline(xintercept = as.Date("2012-07-26"), linetype = "dashed", color = "grey")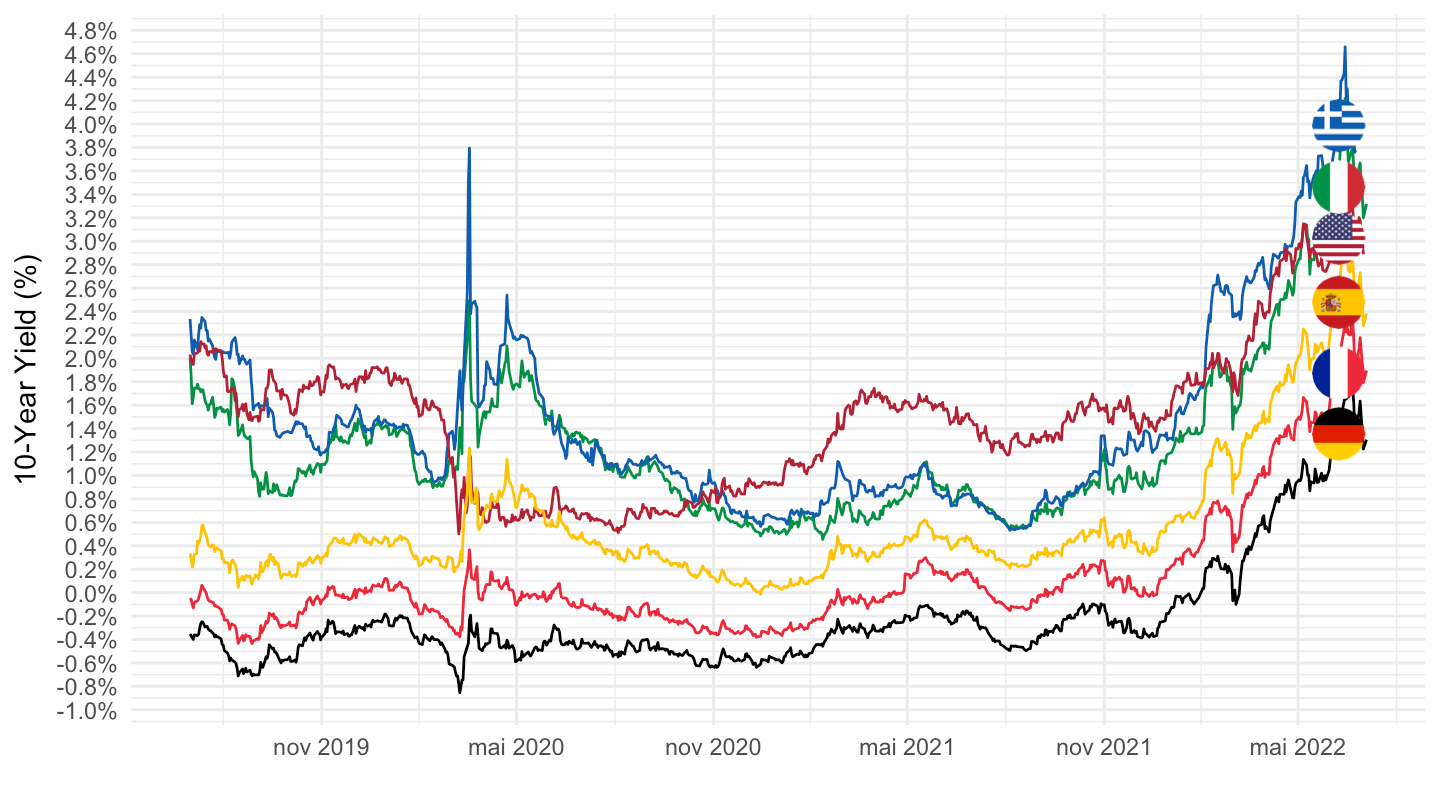
bonds %>%
  filter(symbol %in% c("Germany 10Y", "Italy 10Y", "France 10Y", "Spain 10Y", "Greece 10Y", "U.S. 10Y"),
         Date >= as.Date("2020-01-01")) %>%
  select(symbol, date = Date, obsValue = Close) %>%
  mutate(obsValue = obsValue/100) %>%
  mutate(Location = gsub(" 10Y", "", symbol),
         Location = ifelse(Location == "U.S.", "United States", Location)) %>%
  left_join(colors, by = c("Location" = "country")) %>%
  mutate(color = ifelse(Location == "United States", color2, color)) %>%
  ggplot + geom_line(aes(x = date, y = obsValue, color = color)) +
  theme_minimal() + xlab("") + ylab("10-Year Yield (%)") +
  scale_x_date(breaks = "6 months",
               labels = date_format("%b %Y")) +
  scale_y_continuous(breaks = 0.01*seq(-10, 30, .2),
                     labels = percent_format(accuracy = .1)) +
  scale_color_identity() + add_6flags +
  theme(legend.position = c(0.2, 0.9),
        legend.title = element_blank()) +
  geom_vline(xintercept = as.Date("2012-07-26"), linetype = "dashed", color = "grey")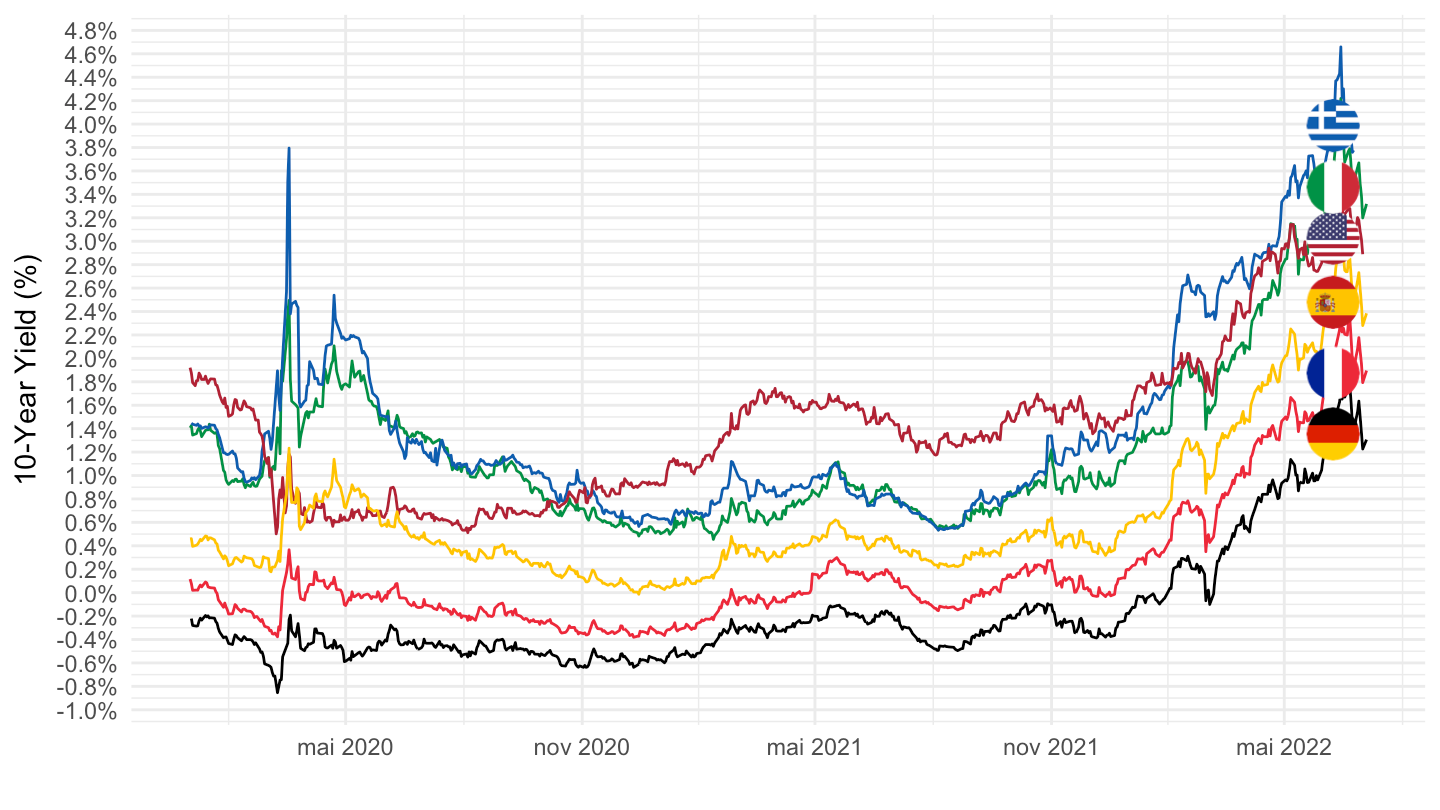
bonds %>%
  filter(symbol %in% c("Germany 10Y", "Italy 10Y", "France 10Y", "Spain 10Y", "U.S. 10Y"),
         Date >= as.Date("2021-01-01")) %>%
  select(symbol, date = Date, obsValue = Close) %>%
  mutate(obsValue = obsValue/100) %>%
  mutate(Location = gsub(" 10Y", "", symbol),
         Location = ifelse(Location == "U.S.", "United States", Location)) %>%
  left_join(colors, by = c("Location" = "country")) %>%
  mutate(color = ifelse(Location == "United States", color2, color)) %>%
  ggplot + geom_line(aes(x = date, y = obsValue, color = color)) +
  theme_minimal() + xlab("") + ylab("10-Year Yield (%)") +
  scale_x_date(breaks = "3 months",
               labels = date_format("%b %Y")) +
  scale_y_continuous(breaks = 0.01*seq(-10, 30, .2),
                     labels = percent_format(accuracy = .1)) +
  scale_color_identity() + add_5flags +
  theme(legend.position = c(0.2, 0.9),
        legend.title = element_blank()) +
  geom_vline(xintercept = as.Date("2012-07-26"), linetype = "dashed", color = "grey")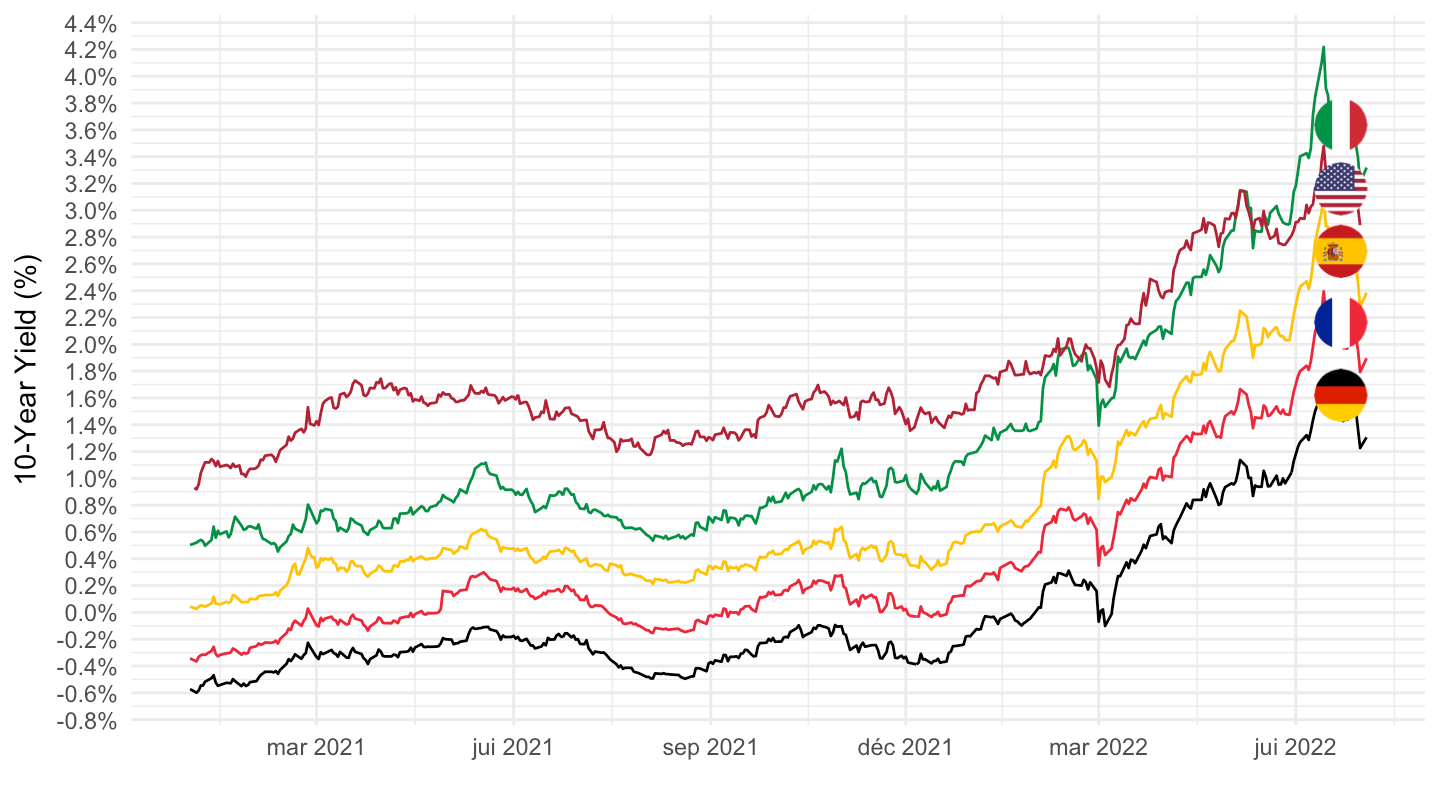
bonds %>%
  filter(symbol %in% c("Germany 10Y", "Italy 10Y", "France 10Y", "Spain 10Y", "Greece 10Y", "U.S. 10Y"),
         Date >= as.Date("2020-01-01"),
         Date <= as.Date("2021-01-01")) %>%
  select(symbol, date = Date, obsValue = Close) %>%
  mutate(obsValue = obsValue/100) %>%
  mutate(Location = gsub(" 10Y", "", symbol),
         Location = ifelse(Location == "U.S.", "United States", Location)) %>%
  left_join(colors, by = c("Location" = "country")) %>%
  mutate(color = ifelse(Location == "United States", color2, color)) %>%
  ggplot + geom_line(aes(x = date, y = obsValue, color = color)) +
  theme_minimal() + xlab("") + ylab("10-Year Yield, 2020 (%)") +
  scale_x_date(breaks = "1 month",
               labels = date_format("%b")) +
  scale_y_continuous(breaks = 0.01*seq(-10, 30, .2),
                     labels = percent_format(accuracy = .1)) +
  scale_color_identity() + add_6flags +
  theme(legend.position = c(0.2, 0.9),
        legend.title = element_blank()) +
  geom_vline(xintercept = as.Date("2012-07-26"), linetype = "dashed", color = "grey")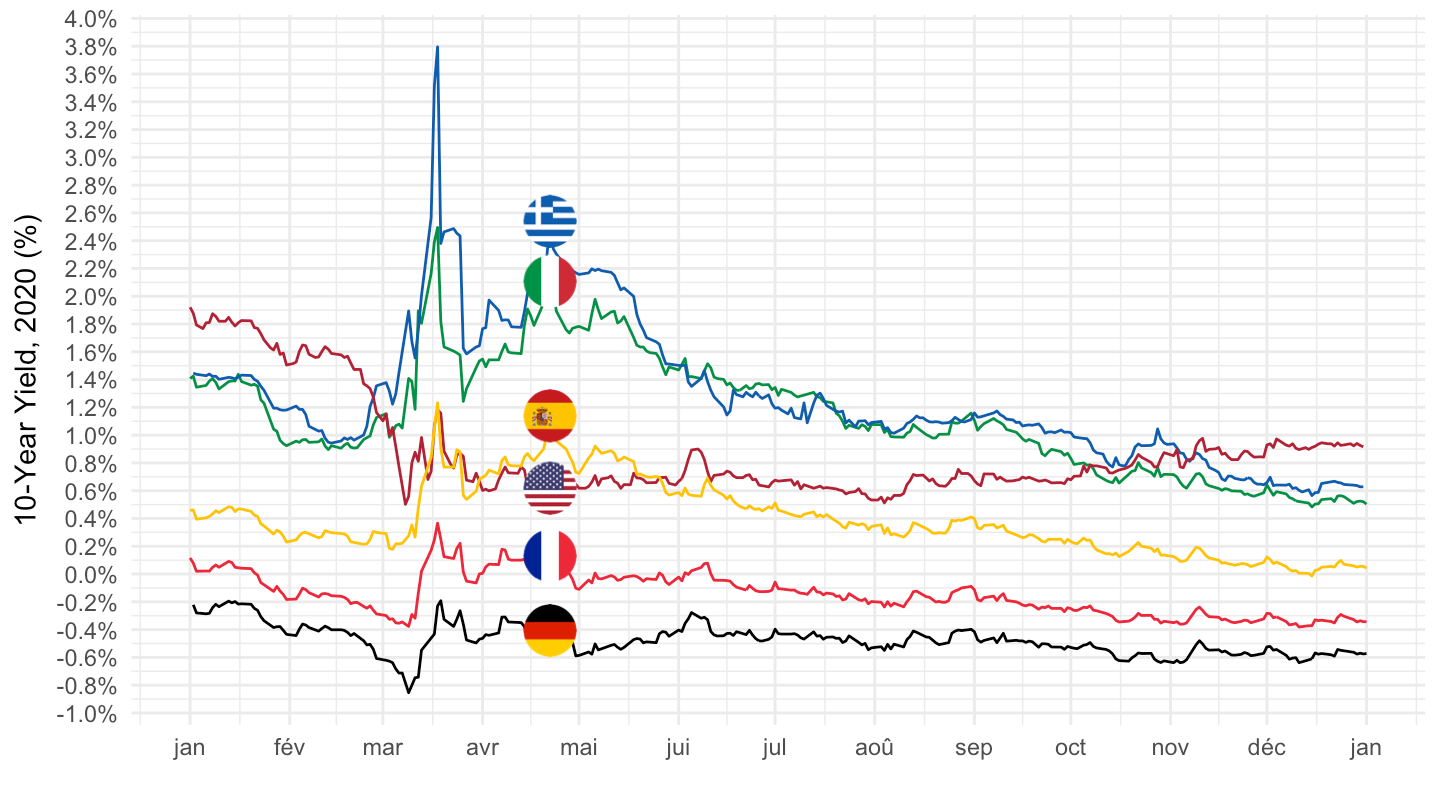
bonds %>%
  filter(symbol %in% c("Germany 10Y", "Italy 10Y", "France 10Y", "Spain 10Y", "Greece 10Y"),
         Date >= as.Date("2012-01-01")) %>%
  select(symbol, date = Date, obsValue = Close) %>%
  mutate(obsValue = obsValue/100) %>%
  mutate(Location = gsub(" 10Y", "", symbol),
         Location = ifelse(Location == "U.S.", "United States", Location)) %>%
  select(-symbol) %>%
  spread(Location, obsValue) %>%
  transmute(date,
            France = France - Germany,
            Greece = Greece - Germany,
            Italy = Italy - Germany,
            Spain = Spain - Germany) %>%
  gather(Location, obsValue, -date) %>%
  left_join(colors, by = c("Location" = "country")) %>%
  mutate(color = ifelse(Location == "United States", color2, color)) %>%
  ggplot + geom_line(aes(x = date, y = obsValue, color = color)) +
  theme_minimal() + xlab("") + ylab("Spreads (%)") +
  scale_x_date(breaks = "1 year",
               labels = date_format("%Y")) +
  scale_y_continuous(breaks = 0.01*seq(-10, 60, 2),
                     labels = percent_format(accuracy = .1)) +
  scale_color_identity() + add_4flags +
  theme(legend.position = c(0.2, 0.9),
        legend.title = element_blank()) +
  geom_vline(xintercept = as.Date("2012-07-26"), linetype = "dashed", color = "grey")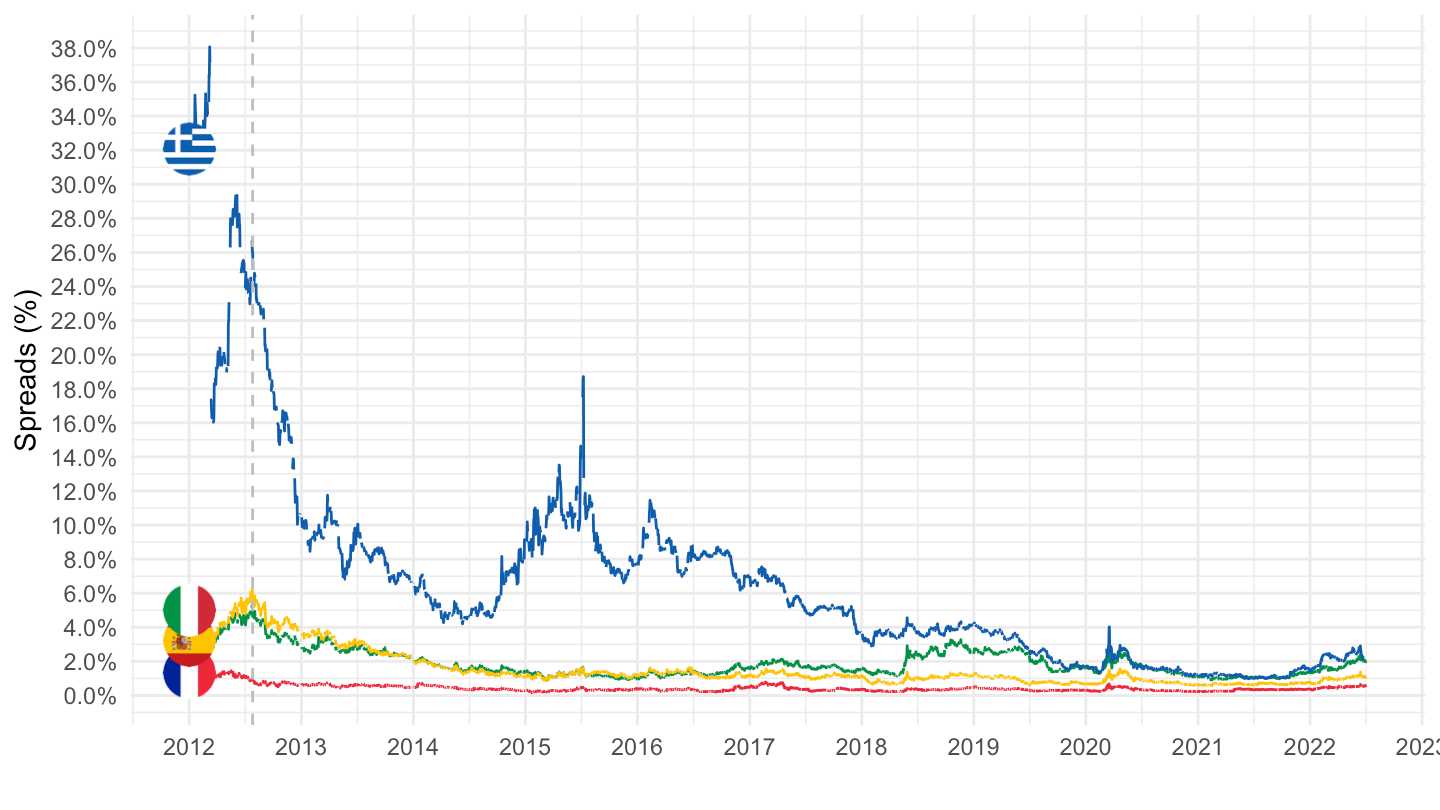
bonds %>%
  filter(symbol %in% c("Germany 10Y", "Italy 10Y", "France 10Y", "Spain 10Y", "Greece 10Y"),
         Date >= as.Date("2021-01-01")) %>%
  select(symbol, date = Date, obsValue = Close) %>%
  mutate(obsValue = obsValue/100) %>%
  mutate(Location = gsub(" 10Y", "", symbol),
         Location = ifelse(Location == "U.S.", "United States", Location)) %>%
  select(-symbol) %>%
  spread(Location, obsValue) %>%
  transmute(date,
            France = France - Germany,
            Greece = Greece - Germany,
            Italy = Italy - Germany,
            Spain = Spain - Germany) %>%
  gather(Location, obsValue, -date) %>%
  left_join(colors, by = c("Location" = "country")) %>%
  mutate(color = ifelse(Location == "United States", color2, color)) %>%
  ggplot + geom_line(aes(x = date, y = obsValue, color = color)) +
  theme_minimal() + xlab("") + ylab("Spreads (%)") +
  scale_x_date(breaks = "2 months",
               labels = date_format("%b %Y")) +
  scale_y_continuous(breaks = 0.01*seq(-10, 30, .2),
                     labels = percent_format(accuracy = .1)) +
  scale_color_identity() + add_4flags +
  theme(legend.position = c(0.2, 0.9),
        legend.title = element_blank()) +
  geom_vline(xintercept = as.Date("2012-07-26"), linetype = "dashed", color = "grey")
bonds %>%
  filter(symbol %in% c("Germany 10Y", "Italy 10Y", "France 10Y", "Spain 10Y"),
         Date >= as.Date("1995-01-01")) %>%
  select(symbol, date = Date, obsValue = Close) %>%
  mutate(obsValue = obsValue/100) %>%
  mutate(Location = gsub(" 10Y", "", symbol),
         Location = ifelse(Location == "U.S.", "United States", Location)) %>%
  left_join(colors, by = c("Location" = "country")) %>%
  mutate(color = ifelse(Location == "United States", color2, color)) %>%
  ggplot + geom_line(aes(x = date, y = obsValue, color = color)) +
  theme_minimal() + xlab("") + ylab("10-Year Yield (%)") +
  scale_x_date(breaks = "2 years",
               labels = date_format("%Y")) +
  scale_y_continuous(breaks = 0.01*seq(-10, 70, 1),
                     labels = percent_format(accuracy = 1)) +
  scale_color_identity() + add_4flags +
  geom_vline(xintercept = as.Date("2012-07-26"), linetype = "dashed", color = "black")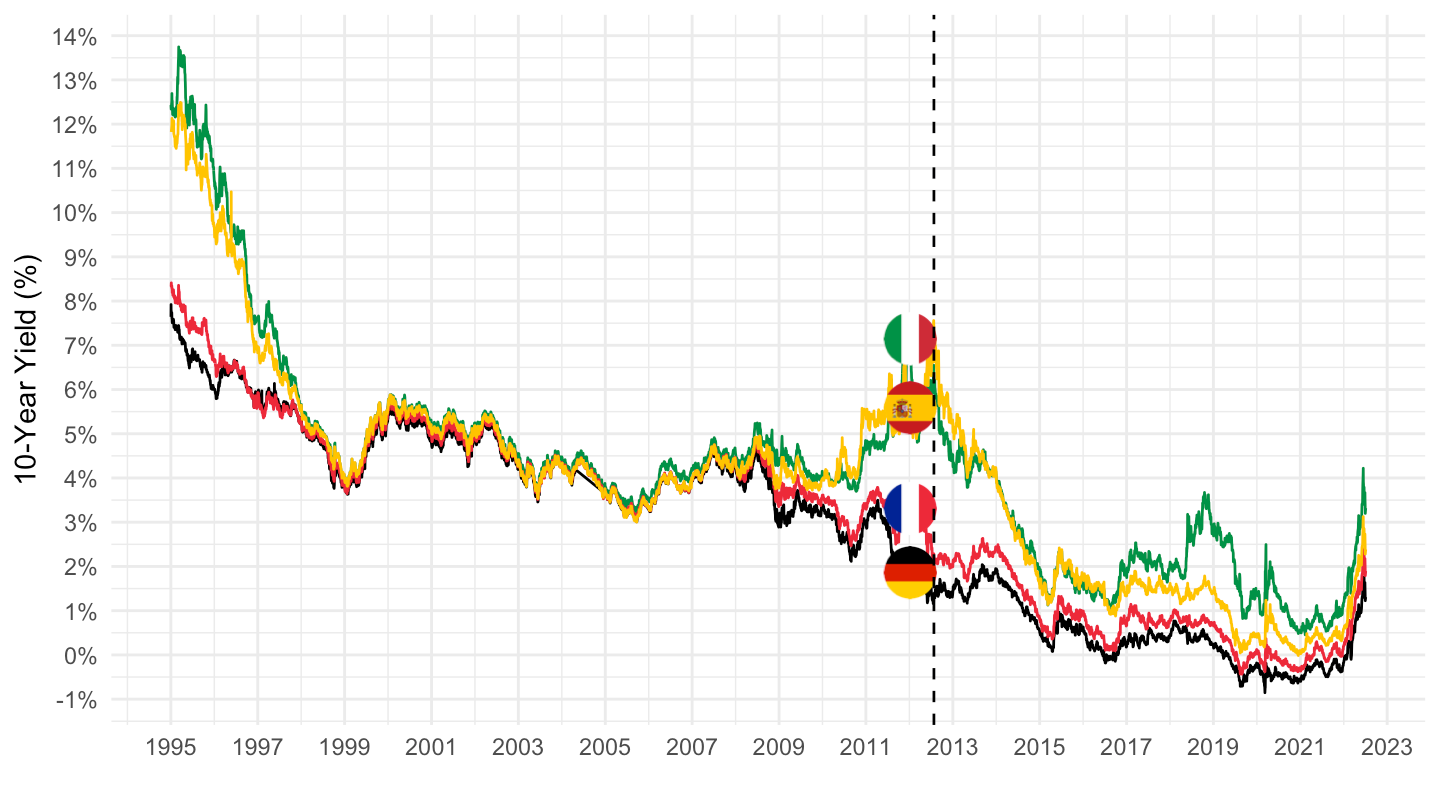
bonds %>%
  filter(symbol %in% c("Germany 10Y", "Italy 10Y", "France 10Y", "Spain 10Y"),
         Date >= as.Date("2005-01-01")) %>%
  select(symbol, date = Date, obsValue = Close) %>%
  mutate(obsValue = obsValue/100) %>%
  mutate(Location = gsub(" 10Y", "", symbol)) %>%
  left_join(colors, by = c("Location" = "country")) %>%
  ggplot + geom_line(aes(x = date, y = obsValue, color = color)) +
  theme_minimal() + xlab("") + ylab("10-Year Yield (%)") +
  scale_x_date(breaks = "2 years",
               labels = date_format("%Y")) +
  scale_y_continuous(breaks = 0.01*seq(-10, 70, 1),
                     labels = percent_format(accuracy = 1)) +
  scale_color_identity() + add_4flags +
  geom_vline(xintercept = as.Date("2012-07-26"), linetype = "dashed", color = "black")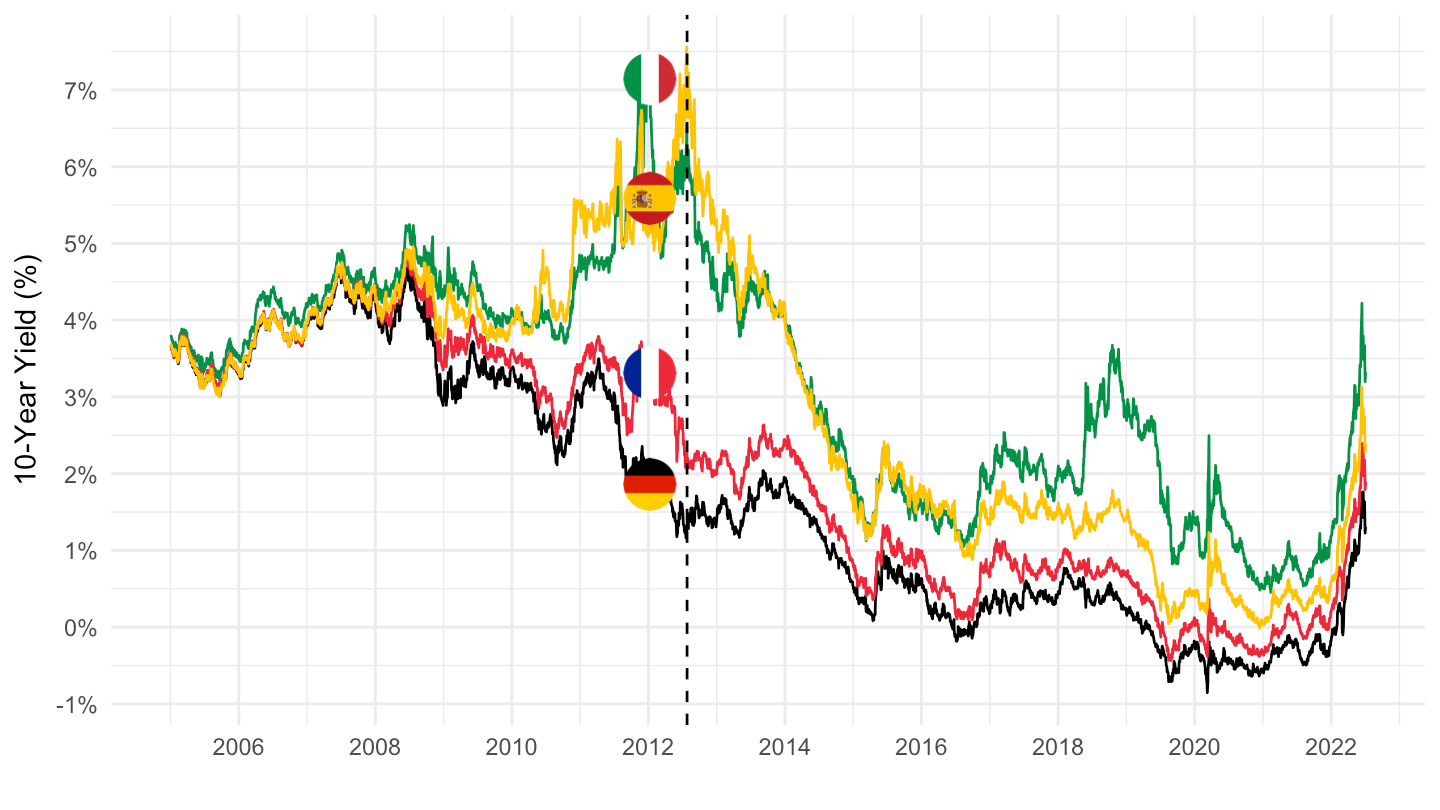
bonds %>%
  filter(symbol %in% c("Germany 10Y", "Italy 10Y", "France 10Y", "Spain 10Y"),
         Date >= as.Date("2010-01-01")) %>%
  select(symbol, date = Date, obsValue = Close) %>%
  mutate(obsValue = obsValue/100) %>%
  mutate(Location = gsub(" 10Y", "", symbol),
         Location = ifelse(Location == "U.S.", "United States", Location)) %>%
  left_join(colors, by = c("Location" = "country")) %>%
  mutate(color = ifelse(Location == "United States", color2, color)) %>%
  ggplot + geom_line(aes(x = date, y = obsValue, color = color)) +
  theme_minimal() + xlab("") + ylab("10-Year Yield (%)") +
  scale_x_date(breaks = "1 year",
               labels = date_format("%y")) +
  scale_y_continuous(breaks = 0.01*seq(-10, 70, 1),
                     labels = percent_format(accuracy = 1)) +
  scale_color_identity() + add_4flags +
  theme(legend.position = c(0.2, 0.9),
        legend.title = element_blank()) +
  geom_vline(xintercept = as.Date("2012-07-26"), linetype = "dashed", color = "black")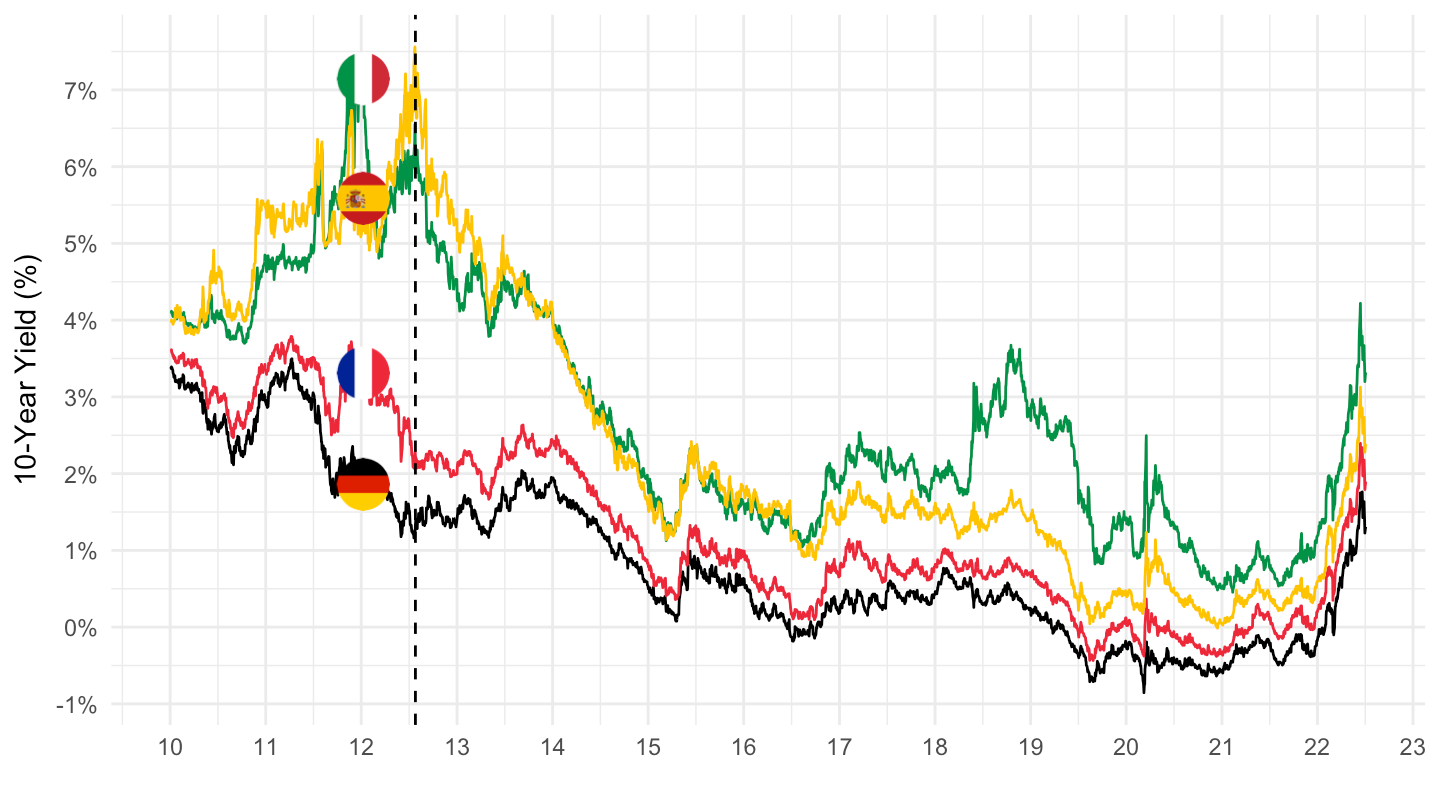
bonds %>%
  filter(symbol %in% c("Germany 10Y", "Italy 10Y", "France 10Y", "Spain 10Y", "U.S. 10Y"),
         Date >= as.Date("2019-07-01")) %>%
  select(symbol, date = Date, obsValue = Close) %>%
  mutate(obsValue = obsValue/100) %>%
  mutate(Location = gsub(" 10Y", "", symbol),
         Location = ifelse(Location == "U.S.", "United States", Location)) %>%
  left_join(colors, by = c("Location" = "country")) %>%
  mutate(color = ifelse(Location == "United States", color2, color)) %>%
  ggplot + geom_line(aes(x = date, y = obsValue, color = color)) +
  theme_minimal() + xlab("") + ylab("10-Year Yield (%)") +
  scale_x_date(breaks = "6 months",
               labels = date_format("%b %Y")) +
  scale_y_continuous(breaks = 0.01*seq(-10, 30, .5),
                     labels = percent_format(accuracy = .1)) +
  scale_color_identity() + add_5flags +
  theme(legend.position = c(0.2, 0.9),
        legend.title = element_blank()) +
  geom_vline(xintercept = as.Date("2012-07-26"), linetype = "dashed", color = "grey")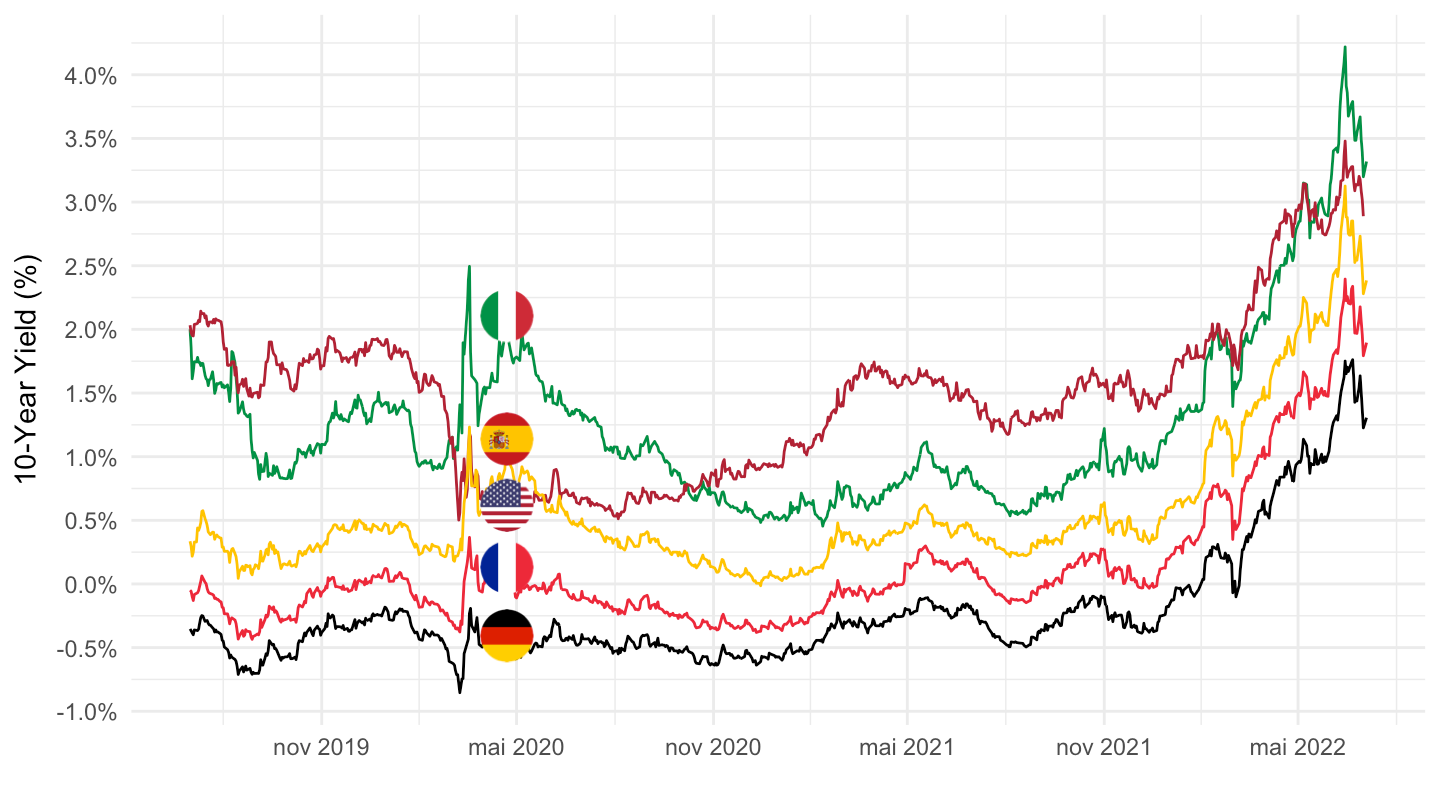
bonds %>%
  filter(symbol %in% c("Germany 10Y", "Italy 10Y", "France 10Y", "Spain 10Y", "U.S. 10Y"),
         Date >= as.Date("2021-01-01")) %>%
  select(symbol, date = Date, obsValue = Close) %>%
  mutate(obsValue = obsValue/100) %>%
  mutate(Location = gsub(" 10Y", "", symbol),
         Location = ifelse(Location == "U.S.", "United States", Location)) %>%
  left_join(colors, by = c("Location" = "country")) %>%
  mutate(color = ifelse(Location == "United States", color2, color)) %>%
  ggplot + geom_line(aes(x = date, y = obsValue, color = color)) +
  theme_minimal() + xlab("") + ylab("10-Year Yield (%)") +
  scale_x_date(breaks = "2 months",
               labels = date_format("%b %Y")) +
  scale_y_continuous(breaks = 0.01*seq(-10, 30, .2),
                     labels = percent_format(accuracy = .1)) +
  scale_color_identity() + add_5flags +
  theme(legend.position = c(0.2, 0.9),
        legend.title = element_blank()) +
  geom_vline(xintercept = as.Date("2012-07-26"), linetype = "dashed", color = "grey")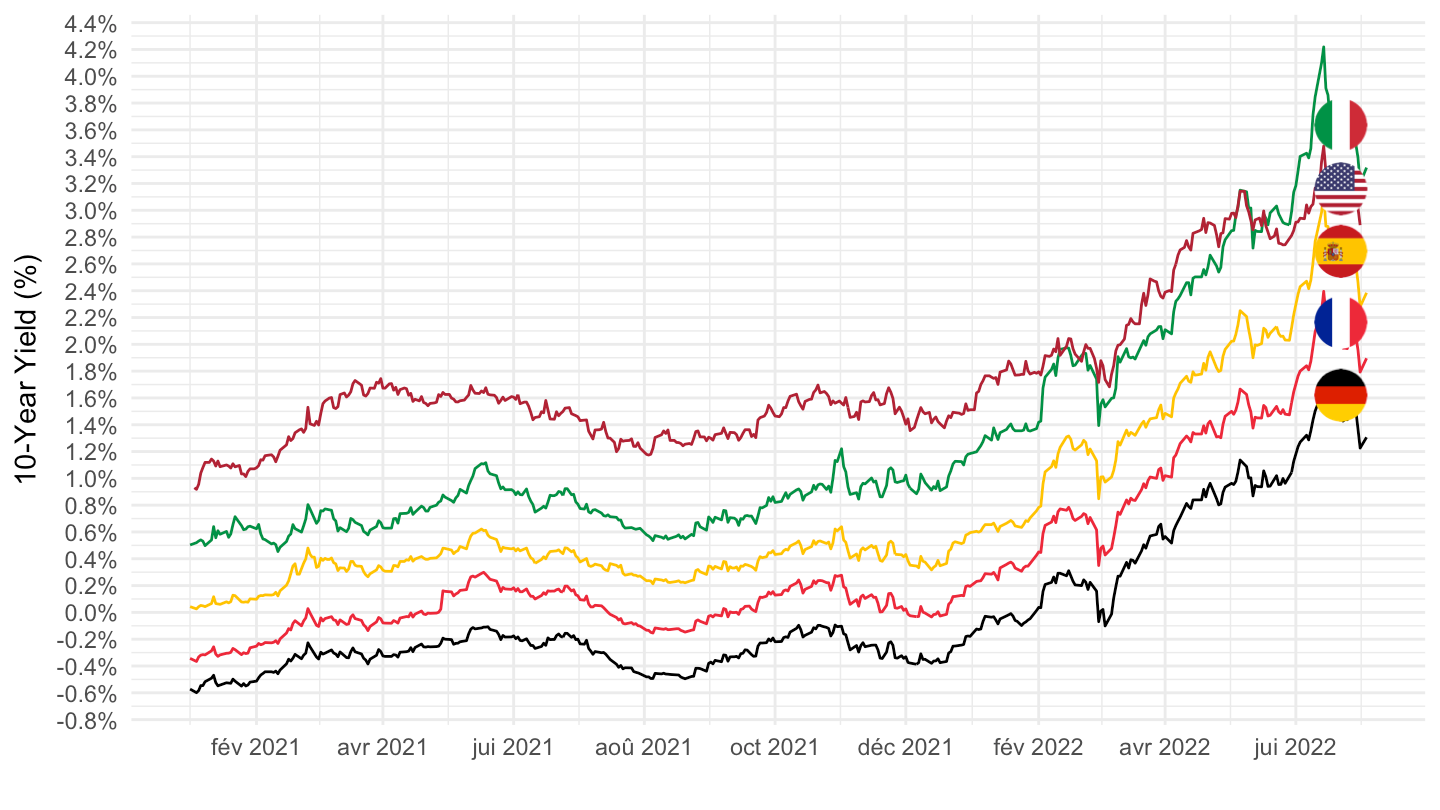
bonds %>%
  filter(symbol %in% c("Germany 10Y", "Italy 10Y", "France 10Y", "Spain 10Y"),
         Date >= as.Date("2019-01-01")) %>%
  select(symbol, date = Date, obsValue = Close) %>%
  mutate(obsValue = obsValue/100) %>%
  mutate(Location = gsub(" 10Y", "", symbol),
         Location = ifelse(Location == "U.S.", "United States", Location)) %>%
  select(-symbol) %>%
  spread(Location, obsValue) %>%
  transmute(date,
            France = France - Germany,
            Italy = Italy - Germany,
            Spain = Spain - Germany) %>%
  gather(Location, obsValue, -date) %>%
  left_join(colors, by = c("Location" = "country")) %>%
  mutate(color = ifelse(Location == "United States", color2, color)) %>%
  ggplot + geom_line(aes(x = date, y = obsValue, color = color)) +
  theme_minimal() + xlab("") + ylab("Spreads (%)") +
  scale_x_date(breaks = "1 year",
               labels = date_format("%Y")) +
  scale_y_continuous(breaks = 0.01*seq(-10, 60, .5),
                     labels = percent_format(accuracy = .1)) +
  scale_color_identity() + add_3flags +
  theme(legend.position = c(0.2, 0.9),
        legend.title = element_blank()) +
  geom_vline(xintercept = as.Date("2012-07-26"), linetype = "dashed", color = "grey")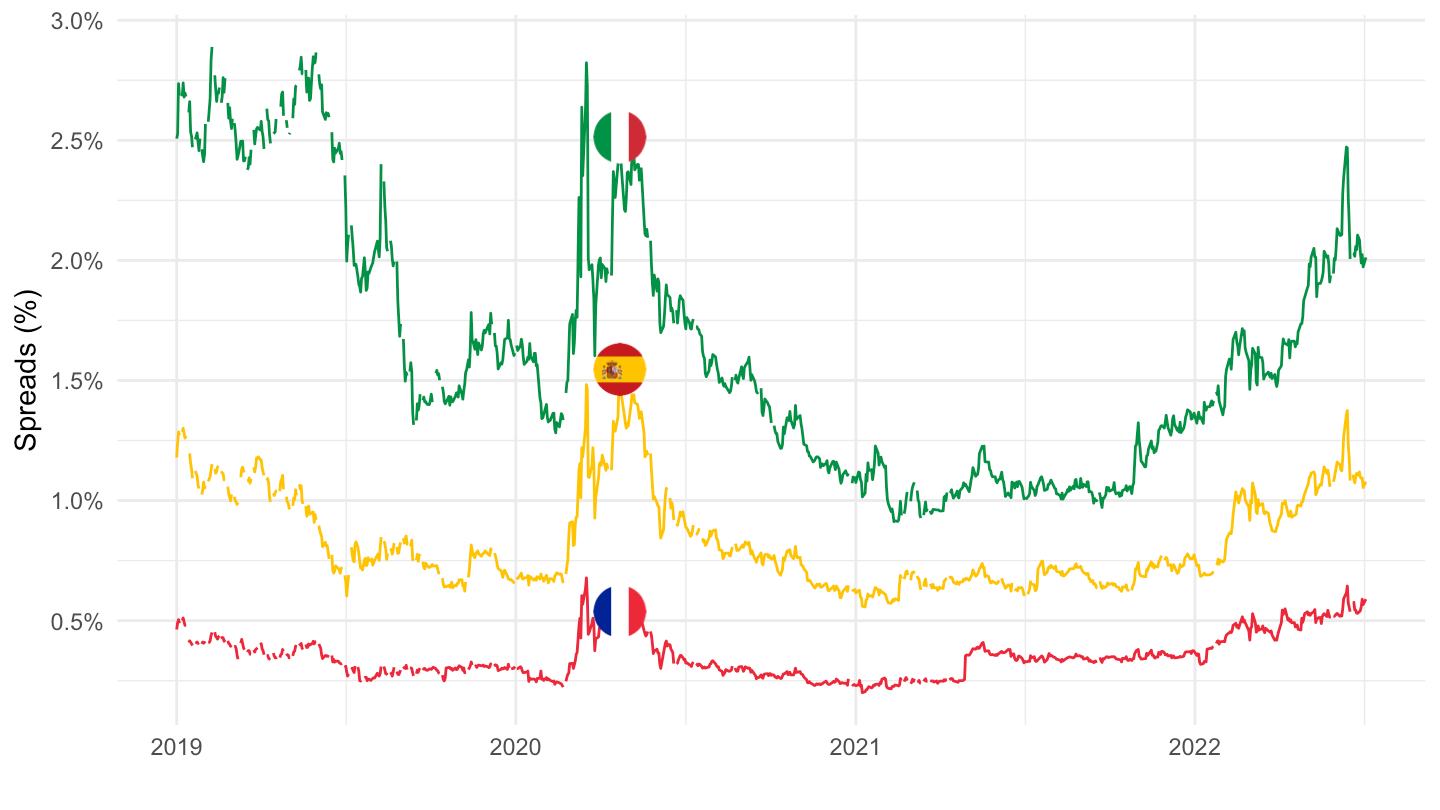
bonds %>%
  filter(symbol %in% c("Germany 10Y", "Italy 10Y", "France 10Y", "Spain 10Y"),
         Date >= as.Date("2010-01-01")) %>%
  select(symbol, date = Date, obsValue = Close) %>%
  mutate(obsValue = obsValue/100) %>%
  mutate(Location = gsub(" 10Y", "", symbol),
         Location = ifelse(Location == "U.S.", "United States", Location)) %>%
  select(-symbol) %>%
  spread(Location, obsValue) %>%
  transmute(date,
            France = France - Germany,
            Italy = Italy - Germany,
            Spain = Spain - Germany) %>%
  gather(Location, obsValue, -date) %>%
  left_join(colors, by = c("Location" = "country")) %>%
  mutate(color = ifelse(Location == "United States", color2, color)) %>%
  ggplot + geom_line(aes(x = date, y = obsValue, color = color)) +
  theme_minimal() + xlab("") + ylab("Spreads (%)") +
  scale_x_date(breaks = "1 year",
               labels = date_format("%Y")) +
  scale_y_continuous(breaks = 0.01*seq(-10, 60, 1),
                     labels = percent_format(accuracy = 1)) +
  scale_color_identity() + add_3flags +
  theme(legend.position = c(0.2, 0.9),
        legend.title = element_blank()) +
  geom_vline(xintercept = as.Date("2012-07-26"), linetype = "dashed", color = "grey")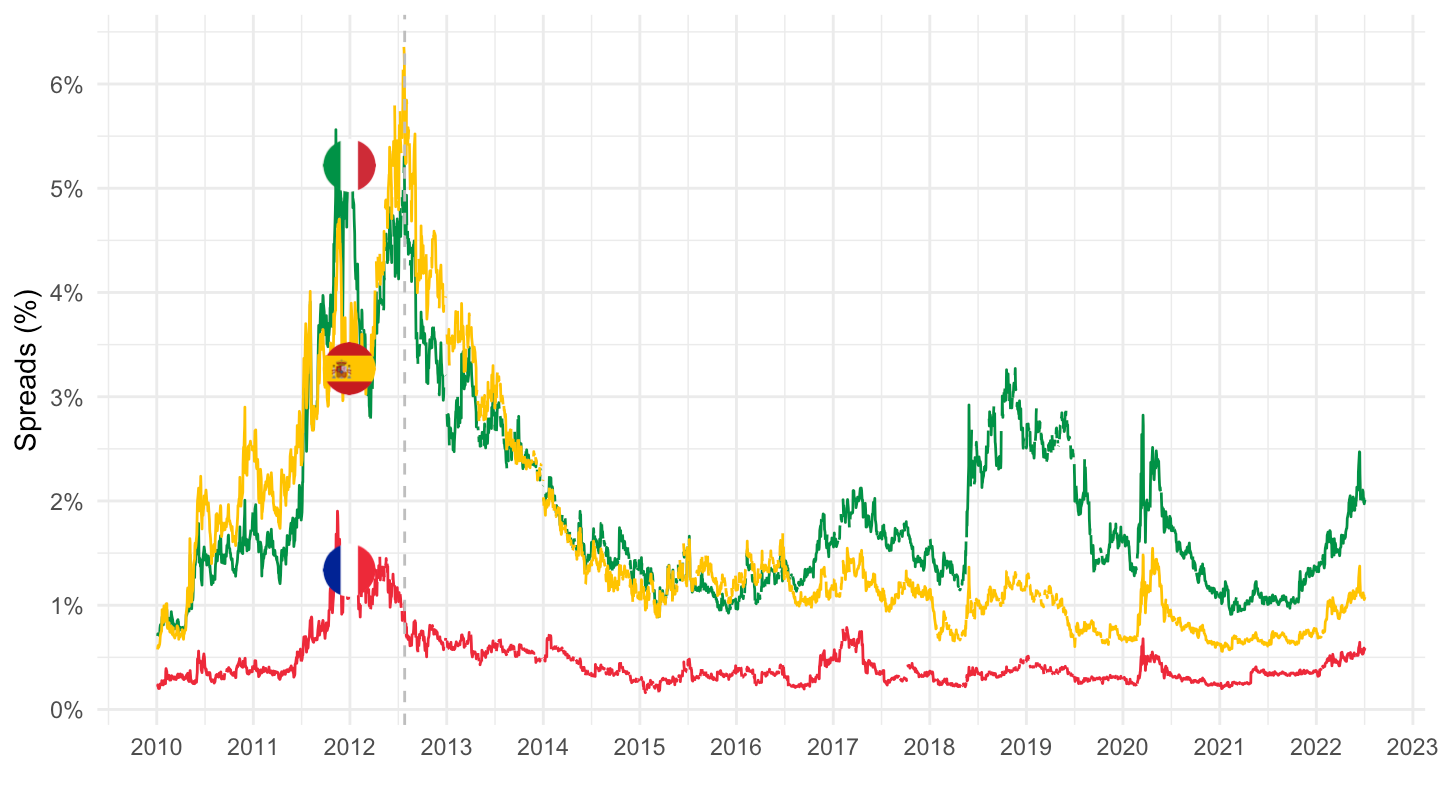
bonds %>%
  filter(symbol %in% c("Germany 10Y", "Italy 10Y", "France 10Y", "Spain 10Y", "Greece 10Y"),
         Date >= as.Date("2021-01-01")) %>%
  select(symbol, date = Date, obsValue = Close) %>%
  mutate(obsValue = obsValue/100) %>%
  mutate(Location = gsub(" 10Y", "", symbol),
         Location = ifelse(Location == "U.S.", "United States", Location)) %>%
  select(-symbol) %>%
  spread(Location, obsValue) %>%
  transmute(date,
            France = France - Germany,
            Greece = Greece - Germany,
            Italy = Italy - Germany,
            Spain = Spain - Germany) %>%
  gather(Location, obsValue, -date) %>%
  left_join(colors, by = c("Location" = "country")) %>%
  mutate(color = ifelse(Location == "United States", color2, color)) %>%
  ggplot + geom_line(aes(x = date, y = obsValue, color = color)) +
  theme_minimal() + xlab("") + ylab("Spreads (%)") +
  scale_x_date(breaks = "2 months",
               labels = date_format("%b %Y")) +
  scale_y_continuous(breaks = 0.01*seq(-10, 30, .2),
                     labels = percent_format(accuracy = .1)) +
  scale_color_identity() + add_4flags +
  theme(legend.position = c(0.2, 0.9),
        legend.title = element_blank()) +
  geom_vline(xintercept = as.Date("2012-07-26"), linetype = "dashed", color = "grey")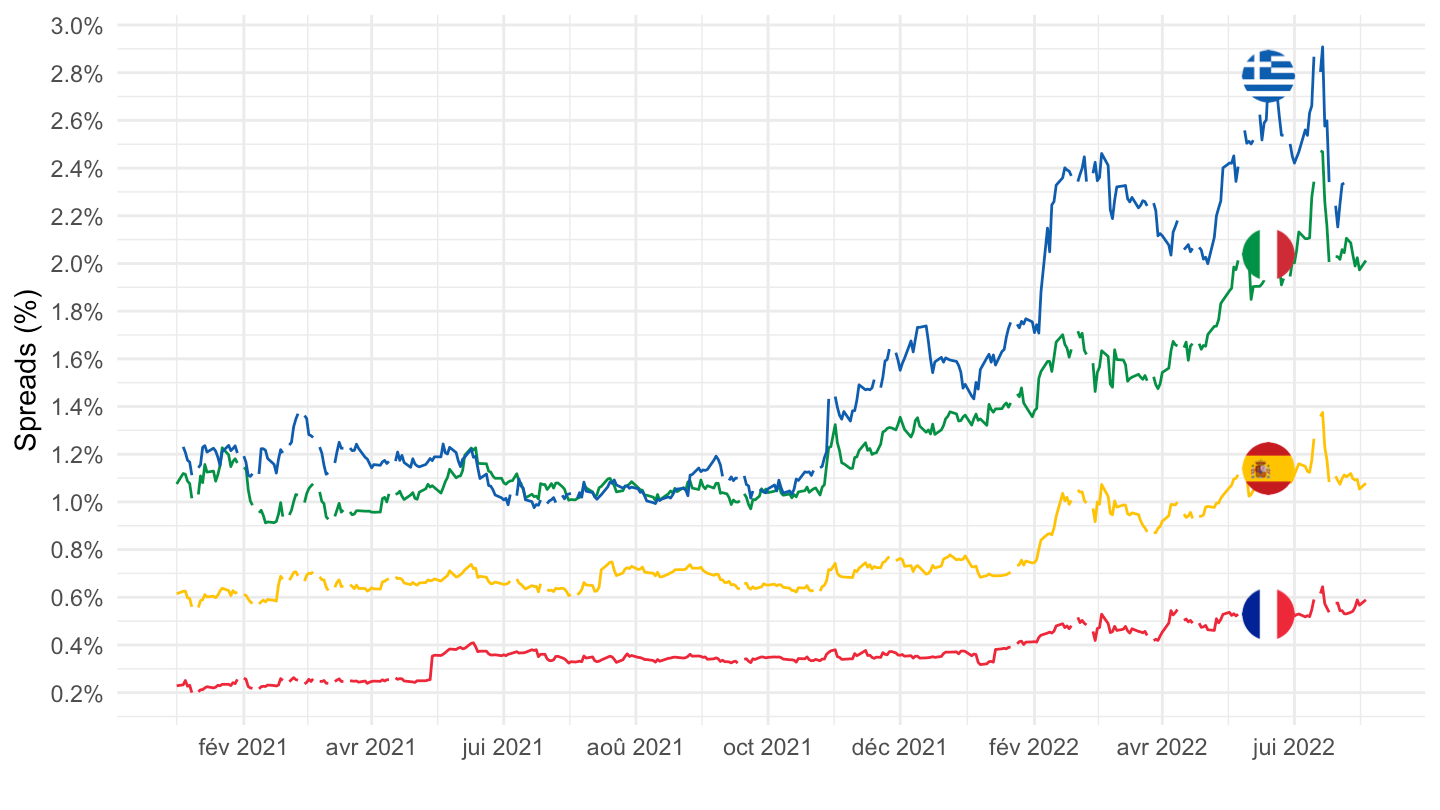
bonds %>%
  filter(symbol %in% c("Germany 10Y", "Italy 10Y"),
         Date >= as.Date("2012-01-01"),
         Date <= as.Date("2014-01-01")) %>%
  select(symbol, Date, Close) %>%
  spread(symbol, Close) %>%
  mutate(`Spread` = `Italy 10Y` - `Germany 10Y`) %>%
  gather(variable, value, -Date) %>%
  ggplot + geom_line(aes(x = Date, y = value/100, color = variable)) +
  theme_minimal() + xlab("") + ylab("10-Year Yield (%)") +
  scale_x_date(breaks ="3 months",
               labels = date_format("%b %y")) +
  scale_y_continuous(breaks = 0.01*seq(-10, 30, 1),
                     labels = percent_format(accuracy = 1)) +
  scale_color_manual(values = viridis(5)[1:4]) +
  theme(legend.position = c(0.8, 0.9),
        legend.title = element_blank()) +
  geom_vline(xintercept = as.Date("2012-07-26"), linetype = "dashed", color = "grey")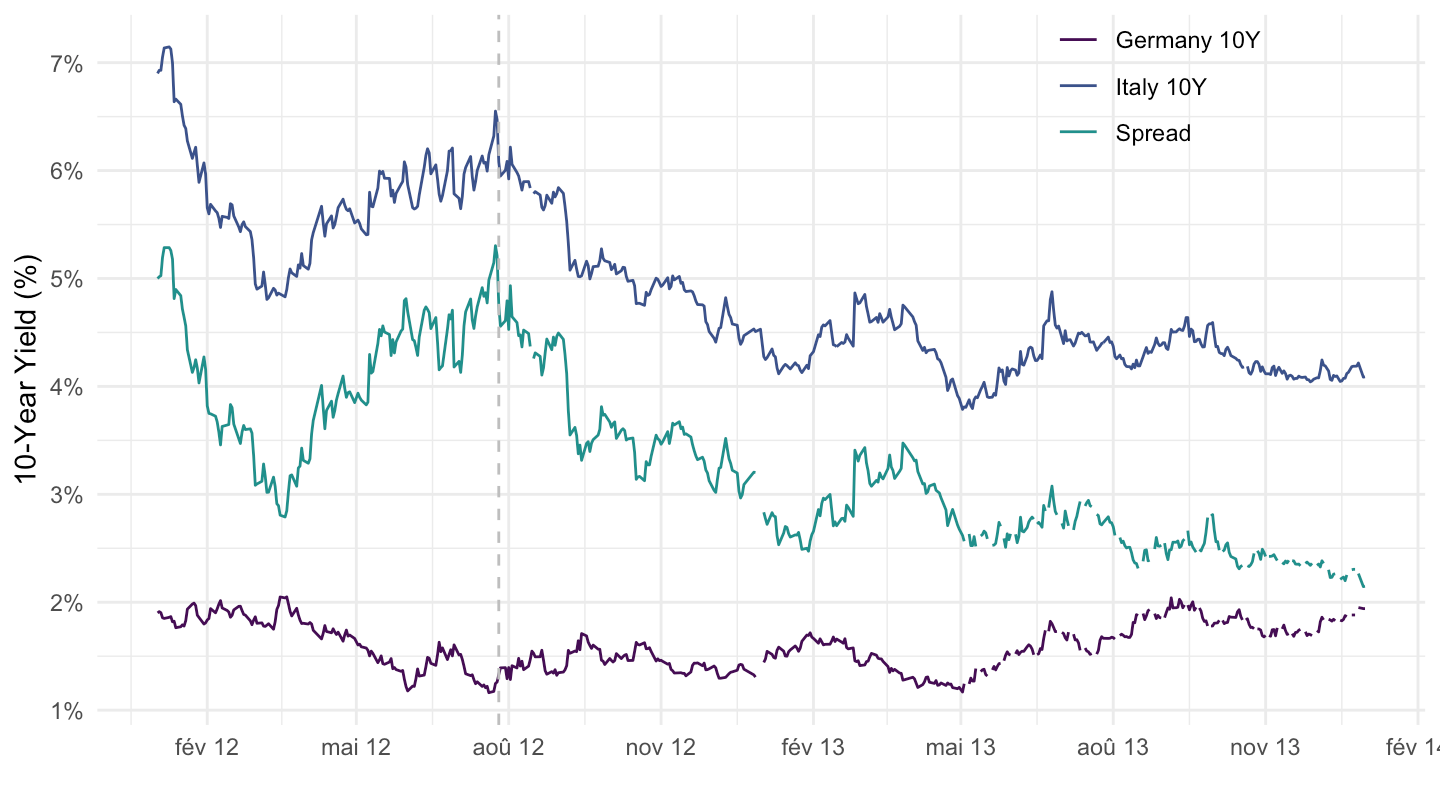
bonds %>%
  filter(symbol %in% c("Germany 10Y", "Italy 10Y"),
         Date >= as.Date("2020-02-26"),
         Date <= as.Date("2020-03-30")) %>%
  select(symbol, Date, Close) %>%
  spread(symbol, Close) %>%
  mutate(`Spread` = `Italy 10Y` - `Germany 10Y`) %>%
  gather(variable, value, -Date) %>%
  ggplot + geom_line(aes(x = Date, y = value/100, color = variable)) +
  theme_minimal() + xlab("") + ylab("10-Year Yield (%)") +
  scale_x_date(breaks ="6 days",
               labels = date_format("%b %d")) +
  scale_y_continuous(breaks = 0.01*seq(-10, 30, 1),
                     labels = percent_format(accuracy = 1)) +
  scale_color_manual(values = viridis(5)[1:4]) +
  theme(legend.position = c(0.15, 0.9),
        legend.title = element_blank()) +
  geom_vline(xintercept = as.Date("2020-03-12"), linetype = "dashed", color = "black")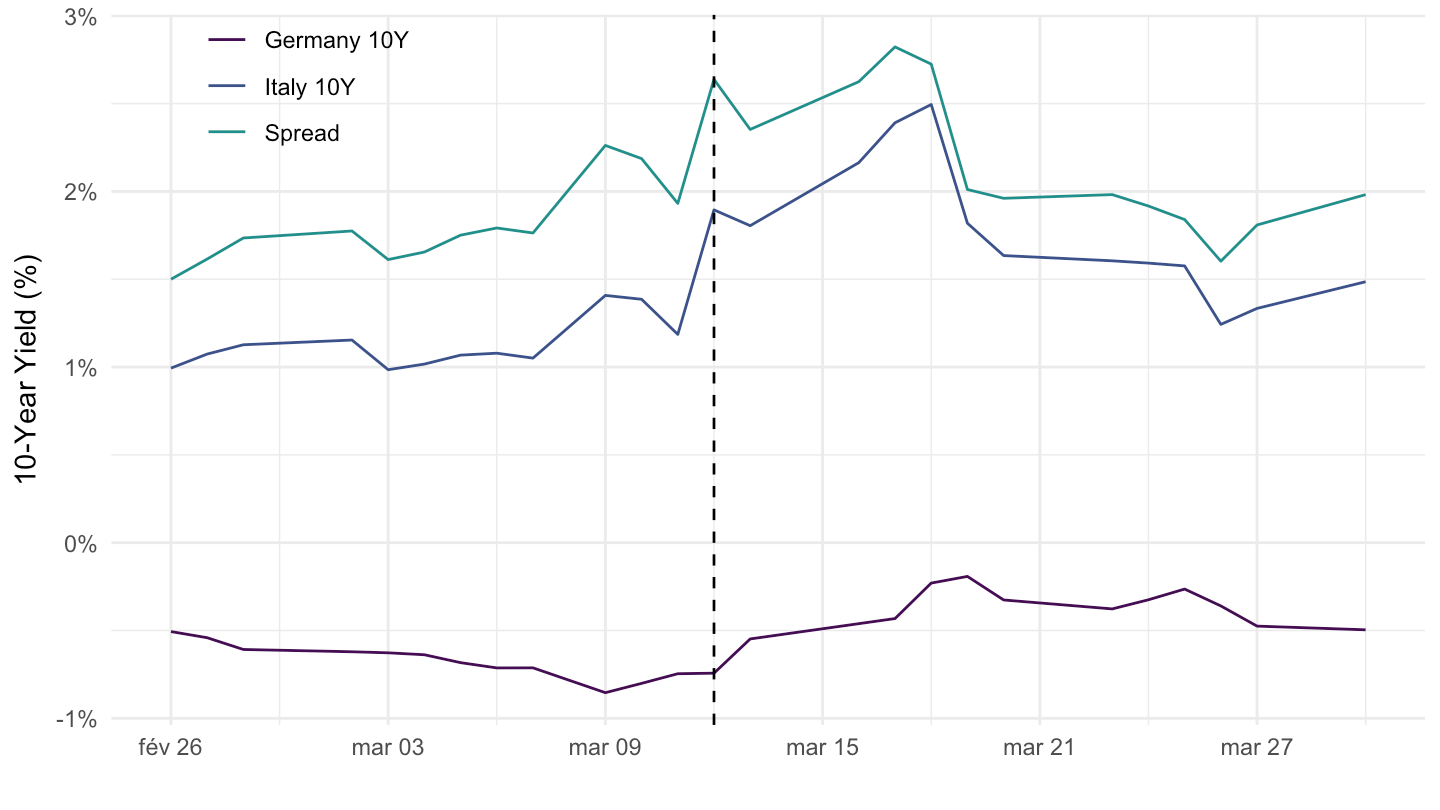
bonds %>%
  filter(symbol %in% c("Germany 10Y", "Italy 10Y"),
         Date >= as.Date("2020-02-24")) %>%
  select(symbol, Date, Close) %>%
  spread(symbol, Close) %>%
  mutate(`Spread` = `Italy 10Y` - `Germany 10Y`) %>%
  gather(variable, value, -Date) %>%
  ggplot + geom_line(aes(x = Date, y = value/100, color = variable)) +
  theme_minimal() + xlab("") + ylab("10-Year Yield (%)") +
  scale_x_date(breaks ="3 months",
               labels = date_format("%b %y")) +
  scale_y_continuous(breaks = 0.01*seq(-10, 30, 1),
                     labels = percent_format(accuracy = 1)) +
  scale_color_manual(values = viridis(5)[1:4]) +
  theme(legend.position = c(0.8, 0.9),
        legend.title = element_blank()) +
  geom_vline(xintercept = as.Date("2012-07-26"), linetype = "dashed", color = "grey")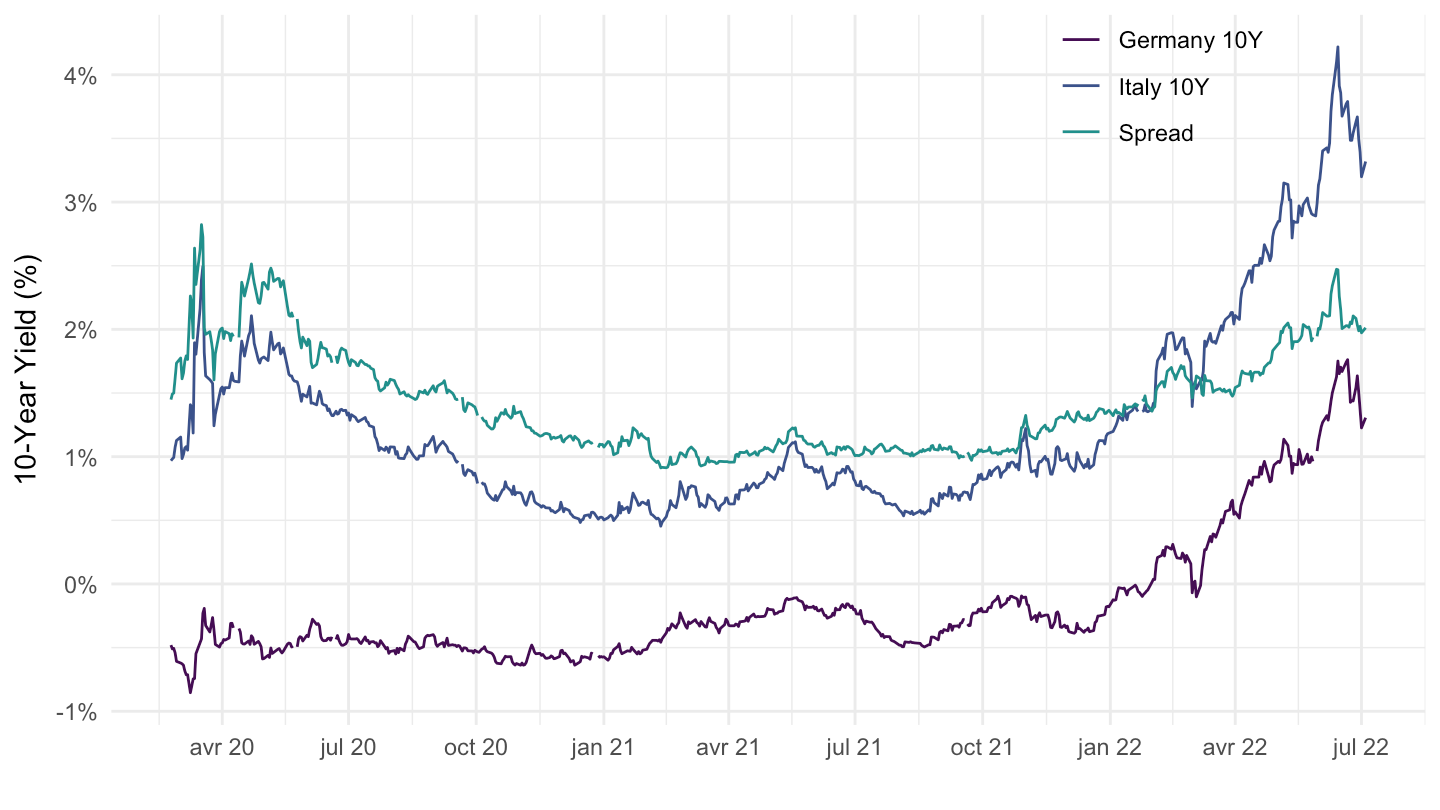
bonds %>%
  filter(symbol %in% c("Germany 10Y", "France 10Y"),
         Date >= as.Date("2017-03-01"),
         Date <= as.Date("2017-05-15")) %>%
  select(symbol, Date, Close) %>%
  spread(symbol, Close) %>%
  mutate(`Spread` = `France 10Y` - `Germany 10Y`) %>%
  gather(variable, value, -Date) %>%
  ggplot + geom_line(aes(x = Date, y = value/100, color = variable)) +
  theme_minimal() + xlab("") + ylab("10-Year Yield (%)") +
  scale_x_date(breaks ="10 days",
               labels = date_format("%b %d")) +
  scale_y_continuous(breaks = 0.01*seq(-10, 30, 0.1),
                     labels = percent_format(accuracy = .1)) +
  scale_color_manual(values = viridis(4)[1:3]) +
  theme(legend.position = c(0.85, 0.9),
        legend.title = element_blank())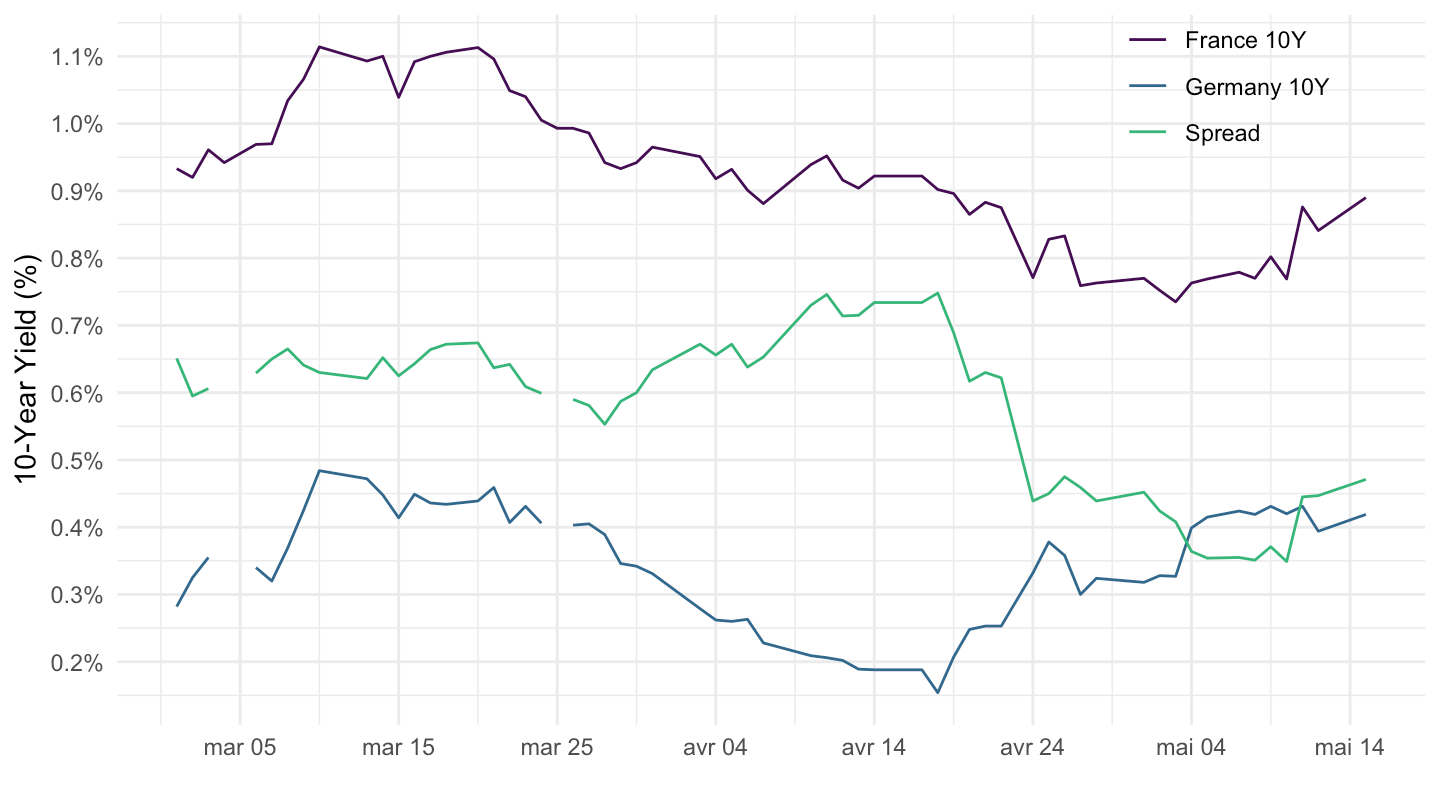
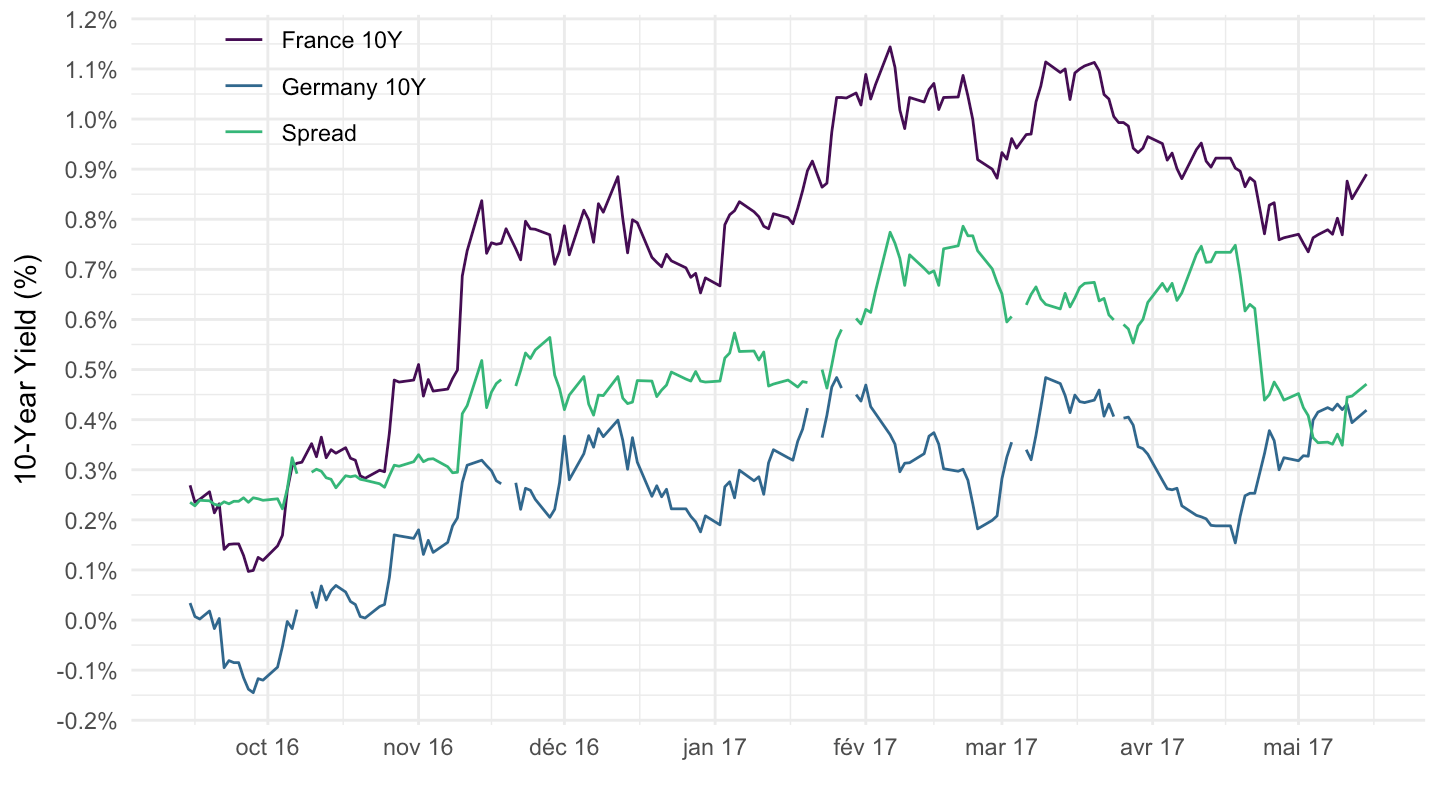
bonds %>%
  filter(symbol %in% c("Germany 10Y", "France 10Y"),
         Date >= as.Date("2016-09-15"),
         Date <= as.Date("2017-05-15")) %>%
  select(symbol, Date, Close) %>%
  spread(symbol, Close) %>%
  mutate(`Spread` = `France 10Y` - `Germany 10Y`) %>%
  gather(variable, value, -Date) %>%
  ggplot + geom_line(aes(x = Date, y = value/100, color = variable)) +
  theme_minimal() + xlab("") + ylab("10-Year Yield (%)") +
  scale_x_date(breaks ="1 month",
               labels = date_format("%b %y")) +
  scale_y_continuous(breaks = 0.01*seq(-10, 30, 0.1),
                     labels = percent_format(accuracy = .1)) +
  scale_color_manual(values = viridis(4)[1:3]) +
  theme(legend.position = c(0.15, 0.9),
        legend.title = element_blank())