| DOWNLOAD_TIME |
|---|
| 2023-05-13 |
7.101 – Compte des sociétés non financières (S11) (En milliards d’euros)
Données - INSEE
Info
DOWNLOAD_TIME
Last
Code
t_7101 %>%
  group_by(year) %>%
  summarise(Nobs = n()) %>%
  arrange(desc(year)) %>%
  head(1) %>%
print_table_conditional()| year | Nobs |
|---|---|
| 2021 | 64 |
Sources
7.101 – Compte des sociétés non financières (S11) (En milliards d’euros):
year
Code
t_7101 %>%
  group_by(year) %>%
  summarise(Nobs = n()) %>%
  {if (is_html_output()) datatable(., filter = 'top', rownames = F) else .}
gdp
Code
gdp <- `CNA-2014-PIB` %>%
  year_to_date %>%
  filter(OPERATION == "PIB",
         UNIT_MEASURE %in% c("EUR2014", "EUROS_COURANTS")) %>%
  select(date, UNIT_MEASURE, OBS_VALUE) %>%
  mutate(OBS_VALUE = OBS_VALUE / 1000,
         UNIT_MEASURE = paste0("PIB_", UNIT_MEASURE)) %>%
  spread(UNIT_MEASURE, OBS_VALUE) %>%
  arrange(desc(date)) %>%
  transmute(year = paste0(year(date)),
            gdp = PIB_EUROS_COURANTS)

gdp %>%
  print_table_conditional()
Table en 2019
Code
t_7101 %>%
  filter(year == "2020") %>%
  select(-year) %>%
  mutate(value = round(value) %>% paste0(" Mds€")) %>%
  {if (is_html_output()) datatable(., filter = 'top', rownames = F) else .}
Rémunération des salariés, salaires et traitements
Code
t_7101 %>%
  filter(variable %in% c("D11", "D1", "D12")) %>%
  left_join(gdp, by = "year") %>%
  year_to_date2 %>%
  ggplot(.) + theme_minimal() + ylab("Sociétés Non Financières (% du PIB)") + xlab("") +
  geom_line(aes(x = date, y = value/gdp, color = paste0(Variable, " - Line ", line))) +
  theme(legend.title = element_blank(),
        legend.position = c(0.3, 0.4)) +
  scale_x_date(breaks = seq(1950, 2020, 5) %>% paste0("-01-01") %>% as.Date,
               labels = date_format("%Y")) +
  scale_y_continuous(breaks = 0.01*seq(0, 100, 2),
                     labels = scales::percent_format(accuracy = 1))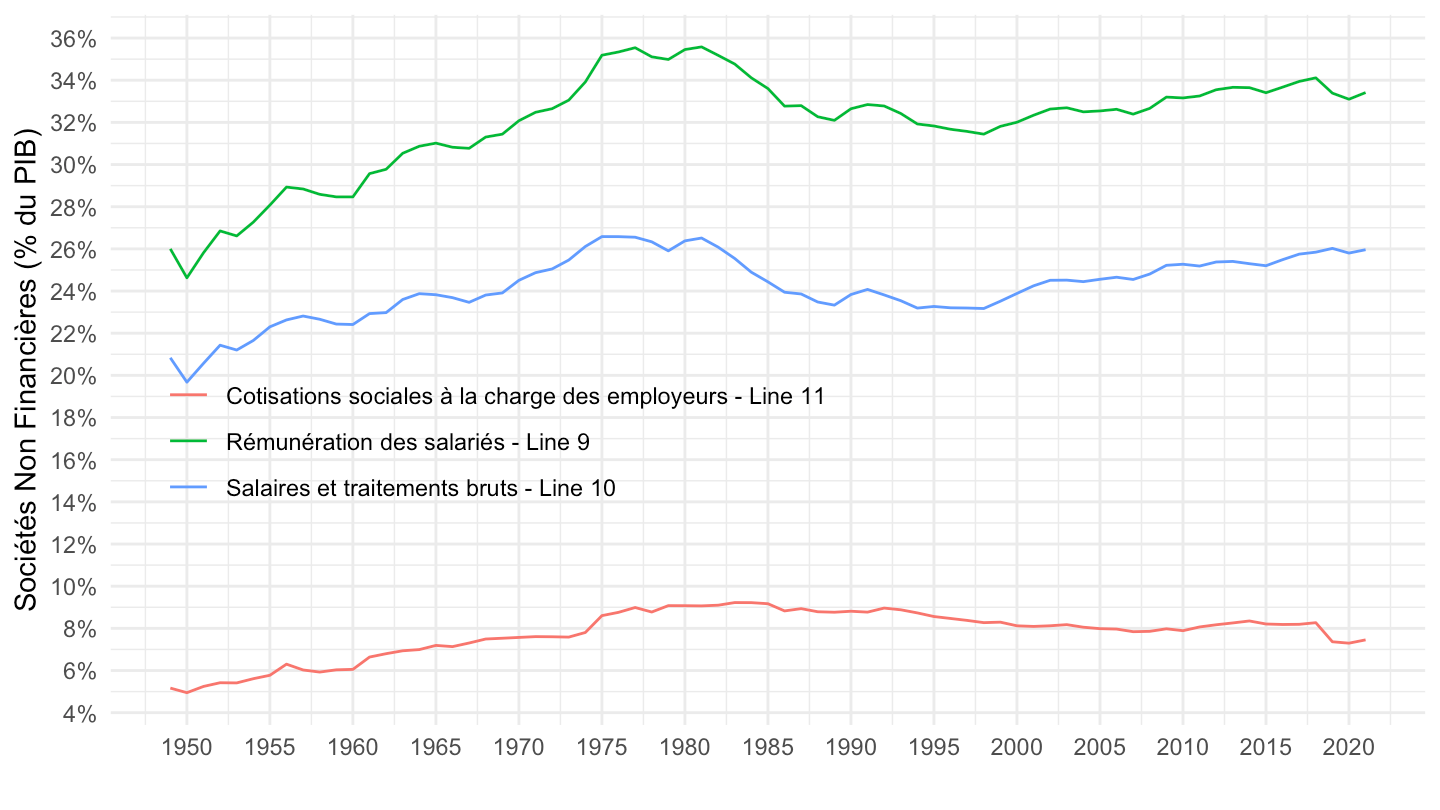
Revenus Mixes des Entreprises
Code
t_7101 %>%
  filter(variable %in% c("B2g", "B2n")) %>%
  left_join(gdp, by = "year") %>%
  year_to_date2 %>%
  ggplot(.) + theme_minimal() + ylab("% du PIB") + xlab("") +
  geom_line(aes(x = date, y = value/gdp, color = paste0(Variable, " - Line ", line), linetype = Variable)) +
  theme(legend.title = element_blank(),
        legend.position = c(0.2, 0.9)) +
  scale_x_date(breaks = seq(1950, 2020, 5) %>% paste0("-01-01") %>% as.Date,
               labels = date_format("%Y")) +
  scale_y_continuous(breaks = 0.01*seq(0, 100, 1),
                     labels = scales::percent_format(accuracy = 1))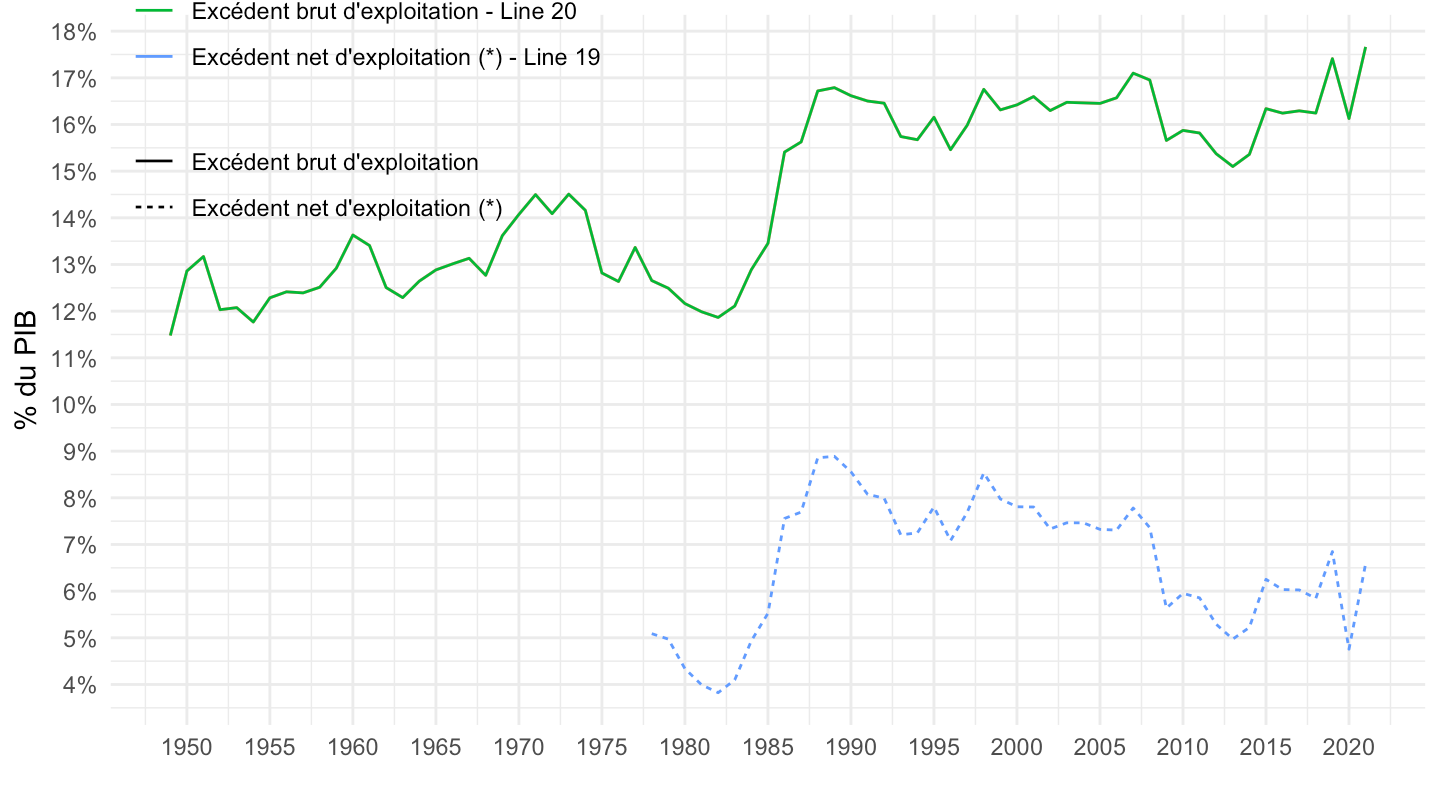
Dividendes
Code
t_7101 %>%
  filter(variable %in% c("D42", "D421")) %>%
  left_join(gdp, by = "year") %>%
  year_to_date2 %>%
  ggplot(.) + theme_minimal() +
  geom_line(aes(x = date, y = value/gdp, color = paste0(Variable, " - Line ", line), linetype = Variable)) +
  theme(legend.title = element_blank(),
        legend.position = c(0.3, 0.6)) +
  scale_x_date(breaks = seq(1950, 2020, 5) %>% paste0("-01-01") %>% as.Date,
               labels = date_format("%Y")) +
  ylab("% du PIB") + xlab("") +
  scale_y_continuous(breaks = 0.01*seq(0, 100, 1),
                     labels = scales::percent_format(accuracy = 1))
Tous
1950-
Code
t_7101 %>%
  filter(line %in% c(23, 30, 19)) %>%
  left_join(gdp, by = "year") %>%
  year_to_date2 %>%
  ggplot(.) + theme_minimal() +
  geom_line(aes(x = date, y = value/gdp, color = paste0(Variable, " - Ligne ", line), linetype = Variable)) +
  theme(legend.title = element_blank(),
        legend.position = c(0.3, 0.6)) +
  scale_x_date(breaks = seq(1950, 2020, 5) %>% paste0("-01-01") %>% as.Date,
               labels = date_format("%Y")) +
  ylab("% du PIB") + xlab("") +
  scale_y_continuous(breaks = 0.01*seq(0, 100, 1),
                     labels = scales::percent_format(accuracy = 1))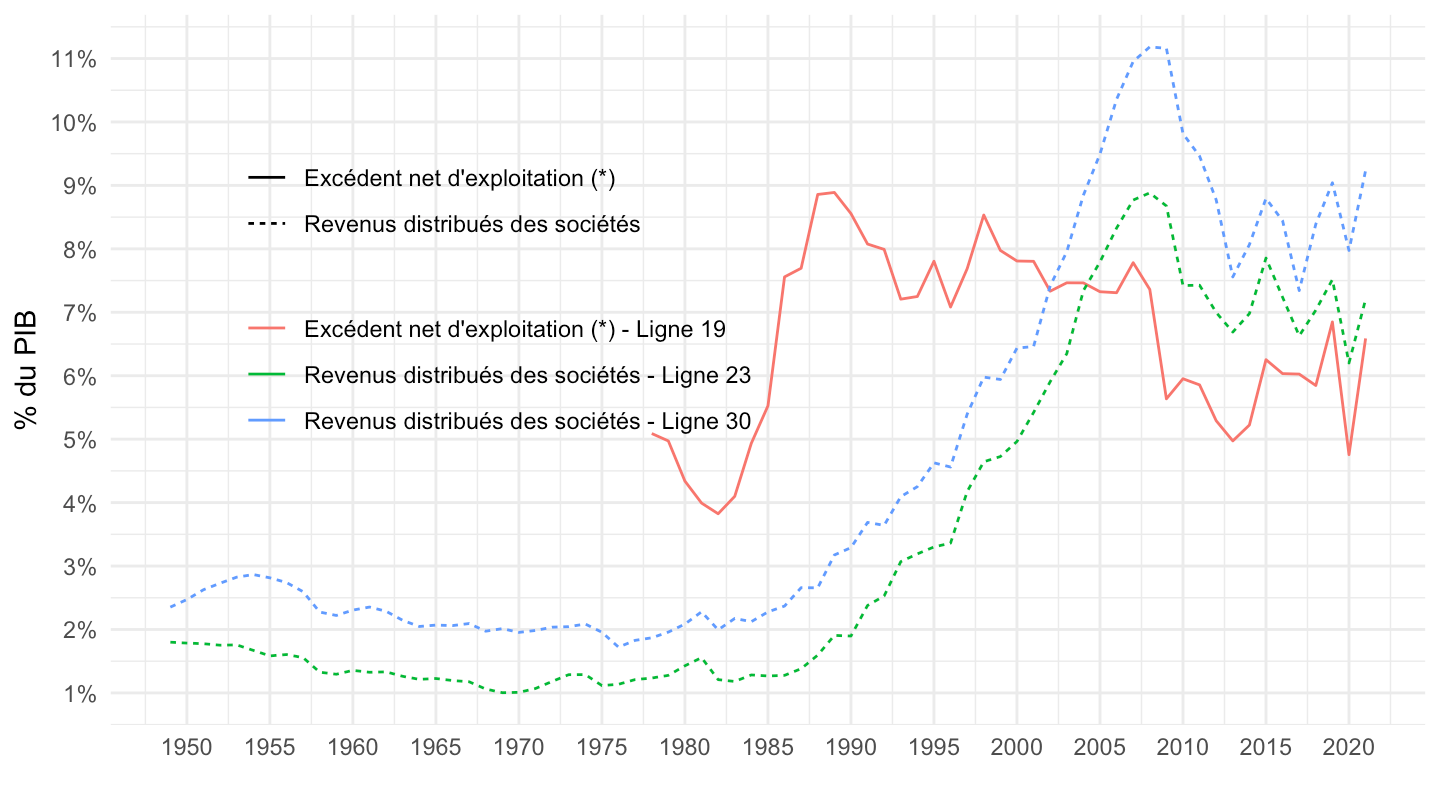
1975-
Code
t_7101 %>%
  filter(line %in% c(23, 30, 19)) %>%
  left_join(gdp, by = "year") %>%
  year_to_date2 %>%
  group_by(date) %>%
  filter(n() == 3) %>%
  mutate(Variable = case_when(line == 23 ~ "Revenus reçus des sociétés (Ressources)",
                              line == 30 ~ "Revenus versés des sociétés (Emplois)",
                              T ~ Variable)) %>%
  ggplot(.) + theme_minimal() +
  geom_line(aes(x = date, y = value/gdp, color = paste0(Variable, " - Ligne ", line))) +
  theme(legend.title = element_blank(),
        legend.position = c(0.3, 0.9)) +
  scale_x_date(breaks = seq(1950, 2020, 5) %>% paste0("-01-01") %>% as.Date,
               labels = date_format("%Y")) +
  ylab("% du PIB") + xlab("") +
  scale_y_continuous(breaks = 0.01*seq(0, 100, 1),
                     labels = scales::percent_format(accuracy = 1))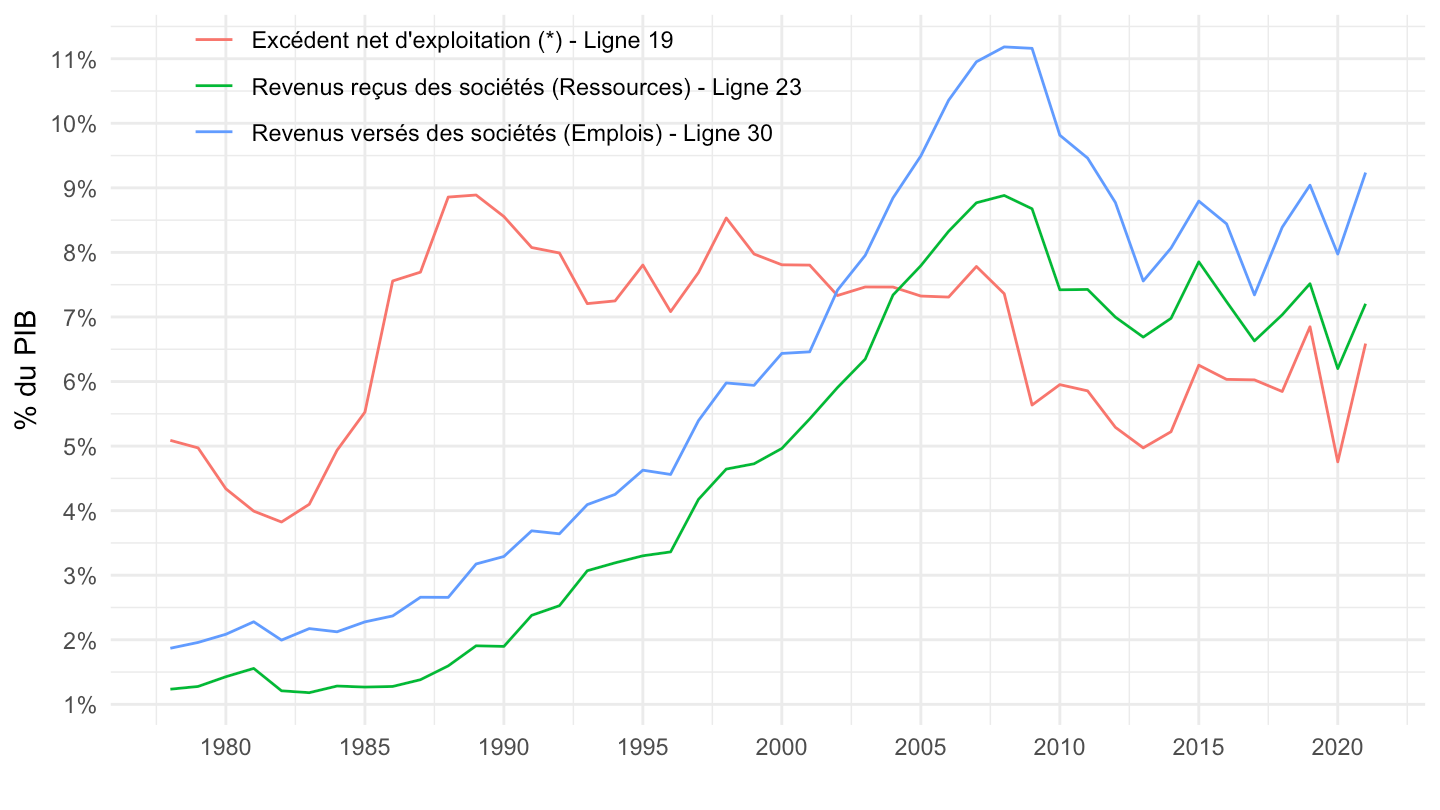
Replication
Exemple 1
Code
t_7101 %>%
  filter(line %in% c(23, 30, 19)) %>%
  select(line, year, value) %>%
  year_to_date2 %>%
  spread(line, value) %>%
  transmute(date,
            `Revenus versés/(Revenus reçus + ENE)` = `30`/(`23` + `19`),
            `(Revenus versés - Revenus reçus)/ENE` = (`30` - `23`)/`19`) %>%
  gather(variable, value, -date) %>%
  ggplot(.) + theme_minimal() + ylab("") + xlab("") +
  geom_line(aes(x = date, y = value, color = variable)) +
  theme(legend.title = element_blank(),
        legend.position = c(0.3, 0.9)) +
  scale_x_date(breaks = seq(1950, 2020, 5) %>% paste0("-01-01") %>% as.Date,
               labels = date_format("%Y")) +
  scale_y_continuous(breaks = 0.01*seq(0, 100, 5),
                     labels = scales::percent_format(accuracy = 1),
                     limits = c(0, 0.8))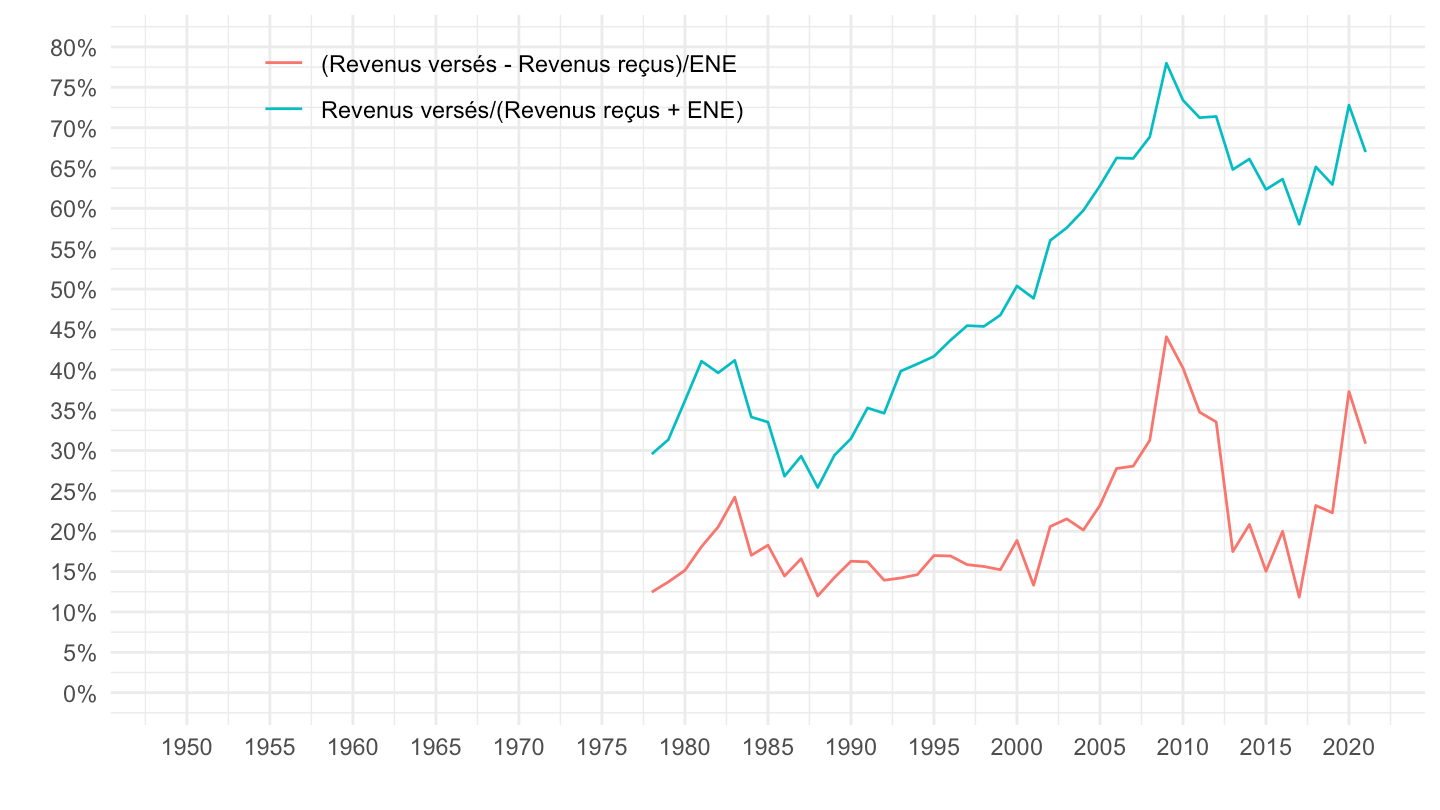
Exemple 2
Code
t_7101 %>%
  filter(line %in% c(24, 31, 19)) %>%
  select(line, year, value) %>%
  year_to_date2 %>%
  spread(line, value) %>%
  na.omit %>%
  ggplot(.) + theme_minimal() +
  geom_line(aes(x = date, y = `31`/(`24` + `19`))) +
  theme(legend.title = element_blank(),
        legend.position = c(0.3, 0.6)) +
  scale_x_date(breaks = seq(1950, 2020, 5) %>% paste0("-01-01") %>% as.Date,
               labels = date_format("%Y")) +
  ylab("%") + xlab("") +
  scale_y_continuous(breaks = 0.01*seq(0, 100, 5),
                     labels = scales::percent_format(accuracy = 1))
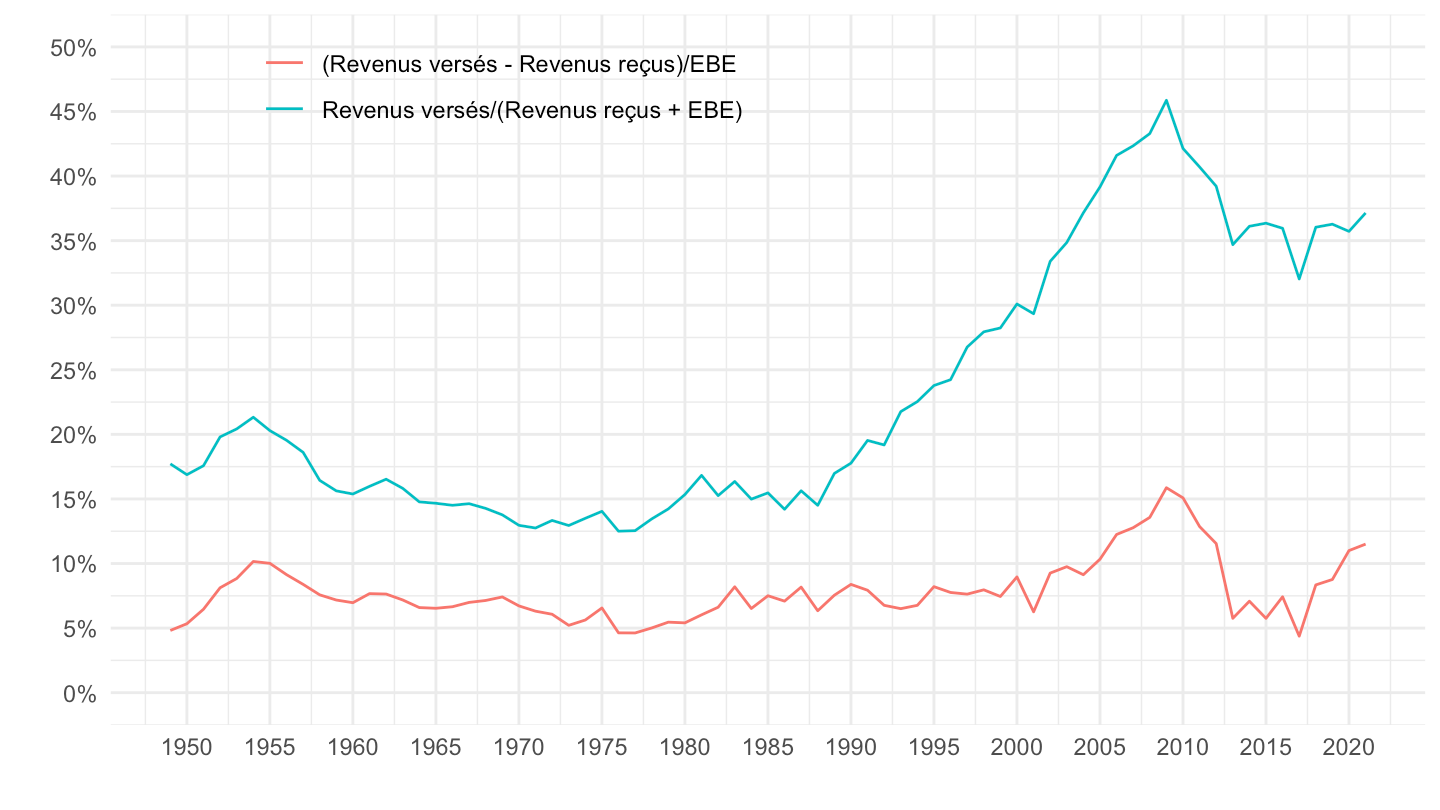
Exemple 3
Code
t_7101 %>%
  filter(line %in% c(23, 30, 20)) %>%
  select(line, year, value) %>%
  year_to_date2 %>%
  spread(line, value) %>%
  transmute(date,
            `Revenus versés/(Revenus reçus + EBE)` = `30`/(`23` + `20`),
            `(Revenus versés - Revenus reçus)/EBE` = (`30` - `23`)/`20`) %>%
  na.omit %>%
  gather(variable, value, -date) %>%
  ggplot(.) + theme_minimal() + ylab("") + xlab("") +
  geom_line(aes(x = date, y = value, color = variable)) +
  theme(legend.title = element_blank(),
        legend.position = c(0.3, 0.9)) +
  scale_x_date(breaks = seq(1950, 2020, 5) %>% paste0("-01-01") %>% as.Date,
               labels = date_format("%Y")) +
  scale_y_continuous(breaks = 0.01*seq(0, 100, 5),
                     labels = scales::percent_format(accuracy = 1),
                     limits = c(0, 0.5))