Code
t_6201 %>%
  group_by(year) %>%
  summarise(Nobs = n()) %>%
print_table_conditional()Données - INSEE
t_6201 %>%
group_by(year) %>%
summarise(Nobs = n()) %>%
print_table_conditional()t_6201d %>%
group_by(year) %>%
summarise(Nobs = n()) %>%
print_table_conditional()| year | Nobs |
|---|---|
| 1999 | 112 |
| 2000 | 112 |
| 2001 | 112 |
| 2002 | 112 |
| 2003 | 112 |
| 2004 | 112 |
| 2005 | 112 |
| 2006 | 112 |
| 2007 | 112 |
| 2008 | 112 |
| 2009 | 112 |
| 2010 | 112 |
| 2011 | 112 |
| 2012 | 112 |
| 2013 | 112 |
| 2014 | 112 |
| 2015 | 112 |
| 2016 | 112 |
| 2017 | 112 |
| 2018 | 112 |
| 2019 | 112 |
t_6201 %>%
  filter(year == "2020") %>%
  select(-year) %>%
  mutate(share = round(100*value/ value[sector == "TOTAL"], 1)) %>%
  mutate(value = round(value) %>% paste0(" Mds€")) %>%
  arrange(-share) %>%
{if (is_html_output()) datatable(., filter = 'top', rownames = F) else .}t_6201d %>%
filter(year == "2019") %>%
mutate(share = round(100*value/ value[sector == "TOTAL"], 1)) %>%
mutate(value = round(value) %>% paste0(" Mds€")) %>%
arrange(-share) %>%
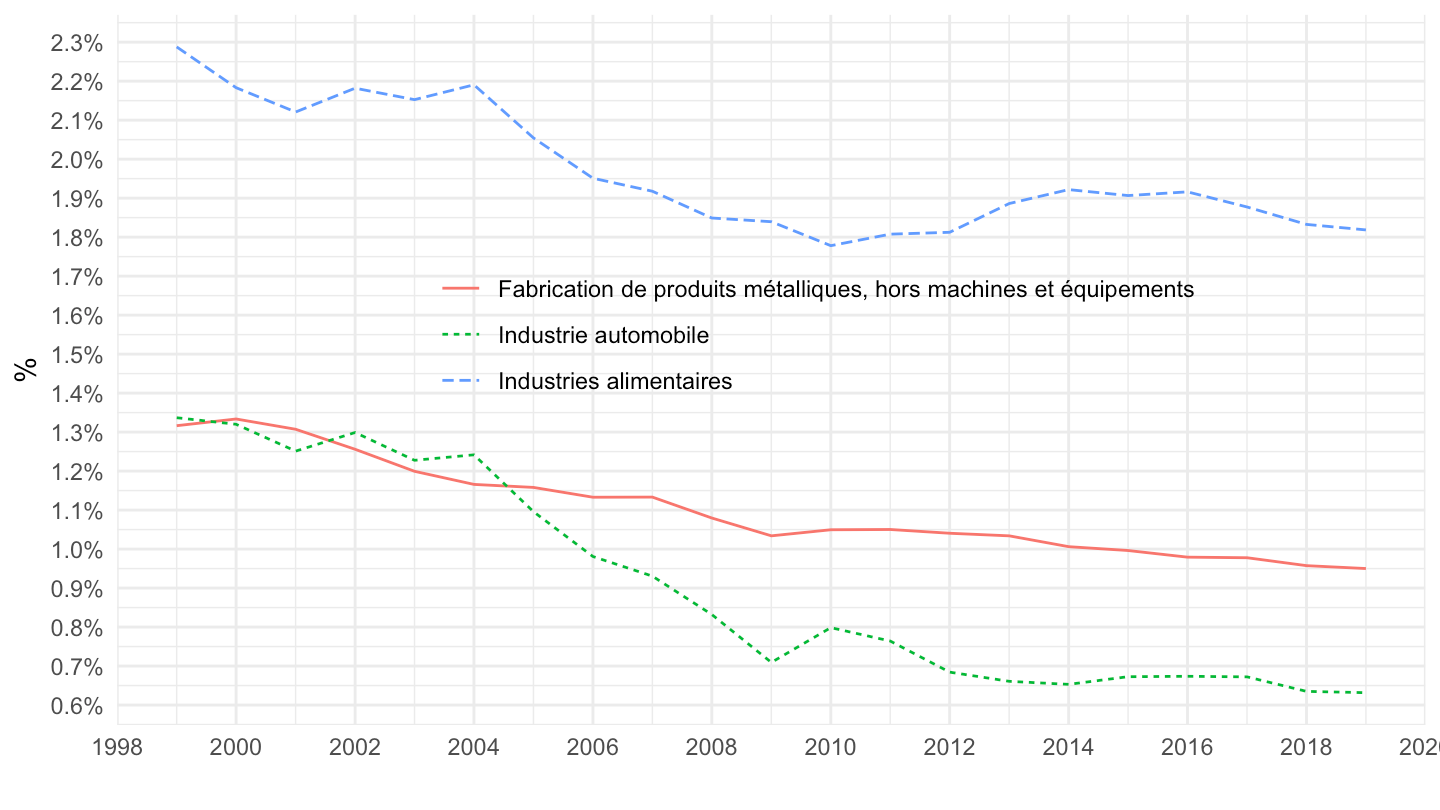
{if (is_html_output()) datatable(., filter = 'top', rownames = F) else .}t_6201d %>%
filter(sector %in% c("A88.10", "A88.25", "A88.29", "TOTAL")) %>%
year_to_date2() %>%
group_by(date) %>%
mutate(value = value/value[sector == "TOTAL"]) %>%
filter(!(sector == "TOTAL")) %>%
ggplot() + theme_minimal() + ylab("%") + xlab("") +
geom_line(aes(x = date, y = value, color = Sector, linetype = Sector)) +
scale_x_date(breaks = seq(1920, 2025, 2) %>% paste0("-01-01") %>% as.Date,
labels = date_format("%Y")) +
theme(legend.position = c(0.54, 0.55),
legend.title = element_blank()) +
scale_y_continuous(breaks = 0.01*seq(0, 250, 0.1),
labels = percent_format(accuracy = .1))