Last observation: 2018 (N = 97)
First observation: 1999 (N = 96)
Last data update: 02 août 2026, 11:05
Last compile: 10 oct. 2026, 01:38
t_5201d |>
  left_join(gdp, by = "date") |>
  filter(date == as.Date("2018-01-01")) |>
  select(-date) %>%
  mutate(`% du PIB` = (100*value/gdp) |> round(digits = 2) |> paste0(" %"),
         value = round(value) |> paste0(" Mds€")) |>
  select(-gdp) %>%
{if (is_html_output()) datatable(., filter = 'top', rownames = F) else .}t_5201d |>
left_join(gdp, by = "date") |>
filter(date == as.Date("2018-01-01")) |>
select(-date) |>
arrange(-value) %>%
mutate(`% du PIB` = (100*value/gdp) |> round(digits = 2) |> paste0(" %"),
value = round(value) |> paste0(" Mds€")) |>
select(-gdp) %>%
{if (is_html_output()) datatable(., filter = 'top', rownames = F) else .}t_5201d |>
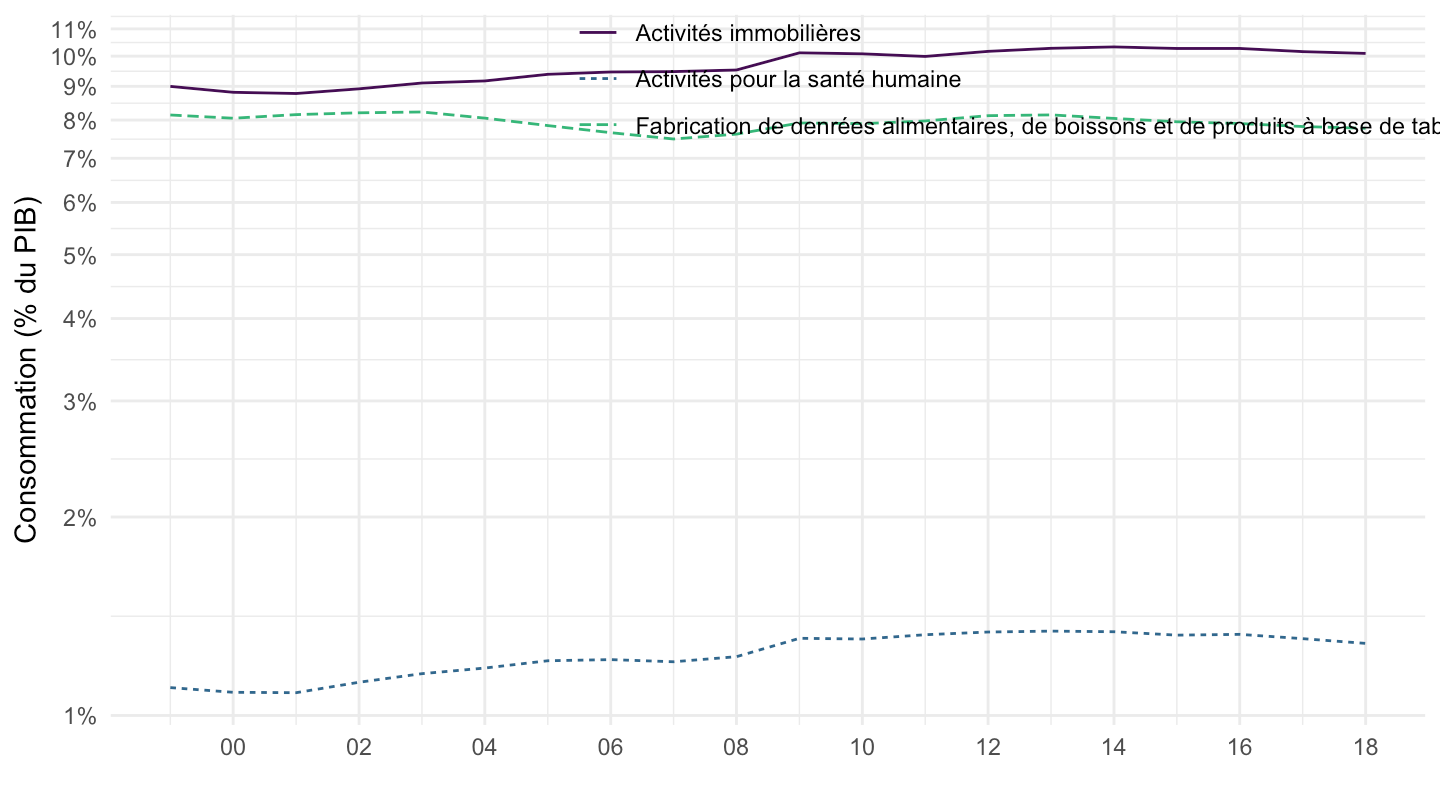
filter(sector %in% c("A38.LZ", "A38.CA", "A38.QA")) |>
left_join(gdp, by = "date") |>
ggplot() + theme_minimal() + ylab("Consommation (% du PIB)") + xlab("") +
geom_line(aes(x = date, y = value/gdp, color = Sector, linetype = Sector)) +
theme(legend.title = element_blank(),
legend.position = c(0.7, 0.91)) +
scale_x_date(breaks = seq(1950, 2100, 2) |> paste0("-01-01") |> as.Date(),
labels = date_format("%Y")) +
scale_color_manual(values = viridis(4)[1:3]) +
scale_y_log10(breaks = 0.01*seq(0, 100, 1),
labels = scales::percent_format(accuracy = 1))