
Last data update: 26 oct. 2026, 16:29
Last compile: 26 oct. 2026, 16:30
Début 2024, en France hors Mayotte (ménages en logement ordinaire). Les parts sont rapportées au patrimoine brut : immobilier + financier + professionnel + résiduel = 100 % ; les emprunts sont rapportés au même patrimoine brut, si bien que le patrimoine net vaut 100 % + emprunts (négatifs). D1 à D9 sont les déciles de patrimoine brut ; P90 à P99 détaillent le dernier décile.
pat |>
  mutate(composante = factor(composante, levels = names(cols_compo))) |>
  ggplot(aes(x = tranche_c, y = part, fill = composante)) +
  geom_col(width = 0.8, color = "white", linewidth = 0.25) +
  geom_hline(yintercept = 0, color = "grey25", linewidth = 0.4) +
  facet_grid(~ niveau, scales = "free_x", space = "free_x") +
  scale_fill_manual(values = cols_compo, name = NULL) +
  scale_y_continuous(labels = ~ paste0(.x, " %"), breaks = seq(-40, 100, 20)) +
  theme_pat(11) +
  labs(x = NULL, y = "% du patrimoine brut",
       title = "L'immobilier domine le patrimoine, sauf aux deux extrémités",
       subtitle = "composition du patrimoine brut par tranche de patrimoine (emprunts en négatif)")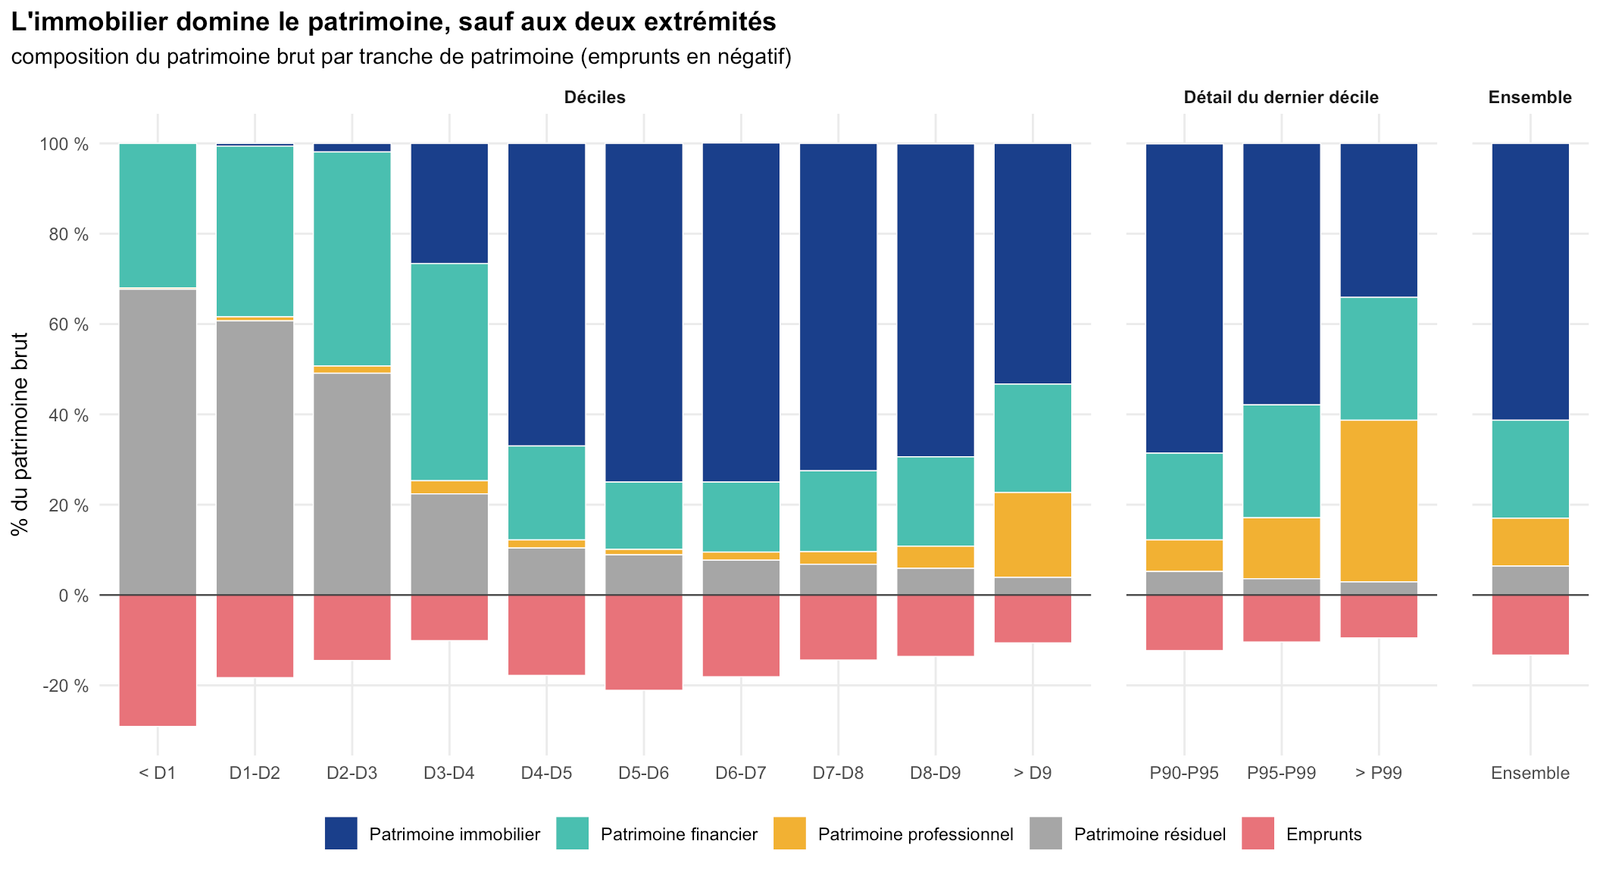
pat |>
  filter(composante %in% c("Patrimoine immobilier", "Patrimoine professionnel")) |>
  mutate(composante = str_remove(composante, "Patrimoine ")) |>
  ggplot(aes(x = tranche_c, y = part / 100, color = composante, group = composante)) +
  geom_line(linewidth = 1.1) +
  geom_point(size = 2.4) +
  scale_y_continuous(labels = scales::percent_format(accuracy = 1)) +
  scale_color_manual(values = c("immobilier" = bleu, "professionnel" = jaune), name = NULL) +
  theme_pat(10) + theme(axis.text.x = element_text(angle = 45, hjust = 1)) +
  labs(x = NULL, y = "Part du patrimoine brut",
       title = "Le 1 % le plus riche détient surtout du patrimoine professionnel",
       subtitle = "35,8 % du patrimoine brut au-delà du 99e centile, contre 1 % à 5 % pour la plupart des ménages")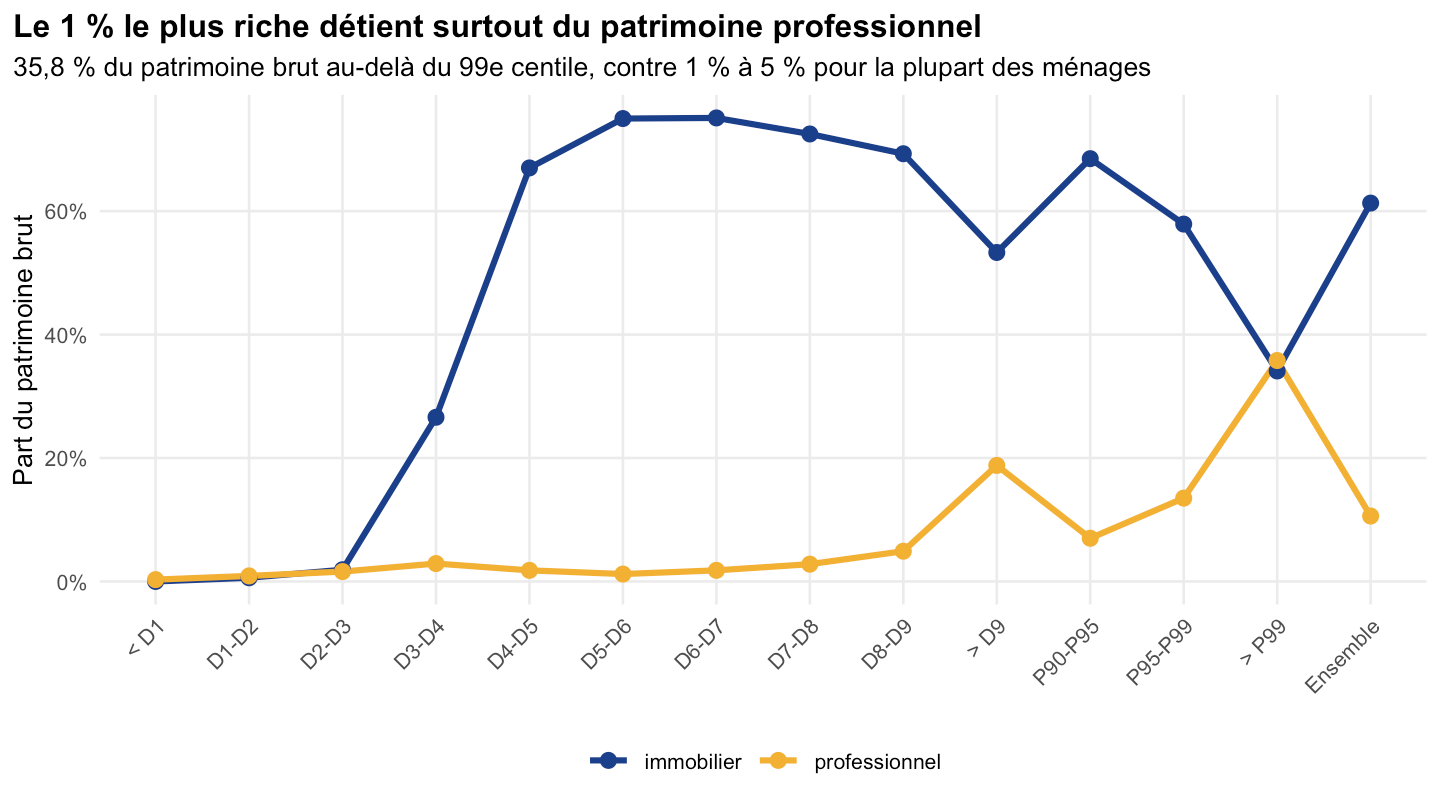
pat |>
  distinct(tranche_c, niveau, patrimoine_brut_moyen) |>
  ggplot(aes(x = tranche_c, y = patrimoine_brut_moyen, fill = niveau)) +
  geom_col(width = 0.75, show.legend = FALSE) +
  geom_text(aes(label = format(round(patrimoine_brut_moyen / 1000, 1), big.mark = " ", decimal.mark = ",")),
            vjust = -0.4, size = 3.2) +
  facet_grid(~ niveau, scales = "free_x", space = "free_x") +
  scale_fill_manual(values = c("Déciles" = bleu, "Détail du dernier décile" = rose, "Ensemble" = "grey40")) +
  scale_y_log10(labels = ~ format(.x / 1000, big.mark = " ", scientific = FALSE),
                breaks = c(1e3, 1e4, 1e5, 1e6), expand = expansion(mult = c(0, 0.15))) +
  theme_pat(11) +
  labs(x = NULL, y = "Milliers d'euros (échelle logarithmique)",
       title = "Le patrimoine brut moyen est 2 000 fois plus élevé au sommet qu'à la base",
       subtitle = "patrimoine brut moyen par tranche, en milliers d'euros (étiquettes) ; échelle logarithmique")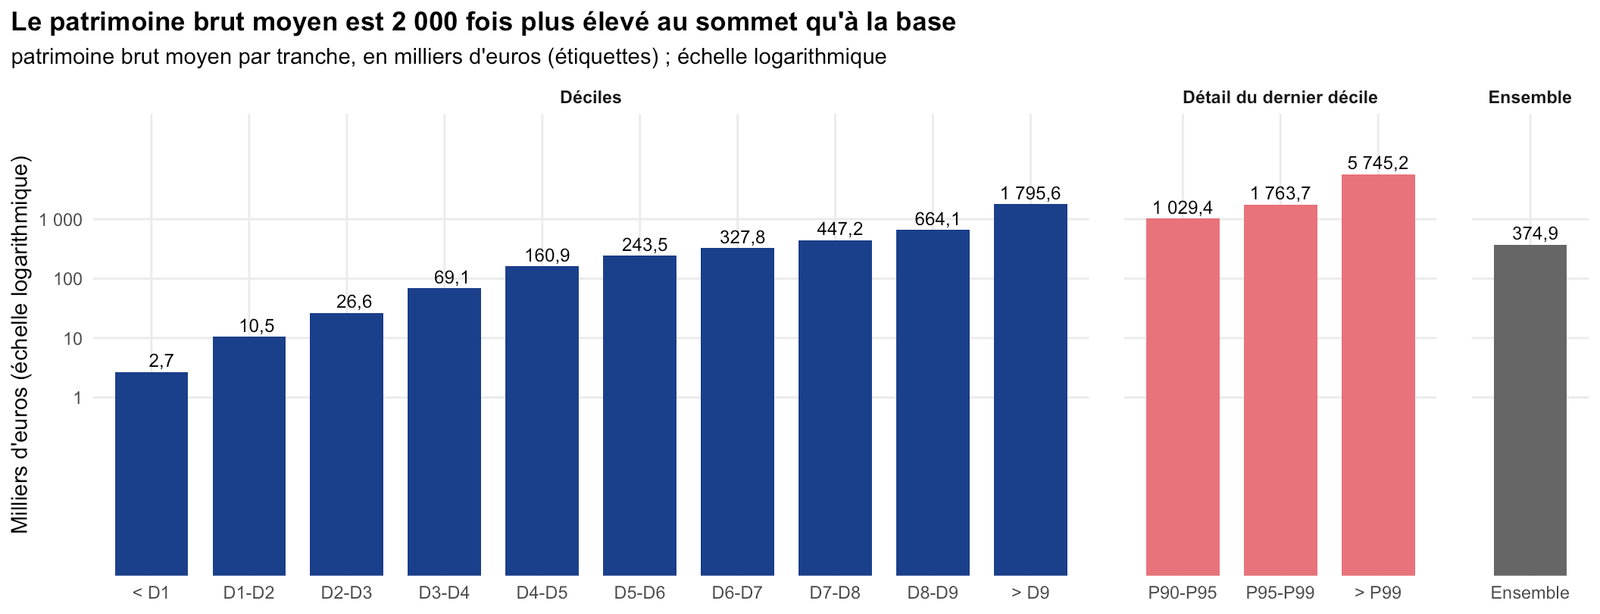
pat |>
  filter(composante == "Emprunts") |>
  transmute(tranche_c, niveau, `Patrimoine net` = patrimoine_brut_moyen * (1 + part / 100),
            `Emprunts` = -patrimoine_brut_moyen * part / 100) |>
  pivot_longer(c(`Patrimoine net`, `Emprunts`), names_to = "type", values_to = "montant") |>
  mutate(type = fct_relevel(type, "Emprunts", "Patrimoine net")) |>
  ggplot(aes(x = tranche_c, y = montant / 1000, fill = type)) +
  geom_col(width = 0.75) +
  facet_grid(~ niveau, scales = "free_x", space = "free_x") +
  scale_fill_manual(values = c("Patrimoine net" = bleu, "Emprunts" = rose), name = NULL) +
  scale_y_continuous(labels = ~ format(.x, big.mark = " ")) +
  theme_pat(11) +
  labs(x = NULL, y = "Milliers d'euros par ménage",
       title = "Patrimoine brut = patrimoine net + emprunts",
       subtitle = "décomposition du patrimoine brut moyen entre patrimoine net et emprunts à rembourser")
pat |>
  filter(composante != "Emprunts", niveau == "Déciles") |>
  mutate(composante = factor(composante, levels = names(cols_compo))) |>
  ggplot(aes(x = tranche_c, y = montant_moyen / 1000, fill = composante)) +
  geom_col(width = 0.8, color = "white", linewidth = 0.25) +
  scale_fill_manual(values = cols_compo, name = NULL, breaks = names(cols_compo)[1:4]) +
  scale_y_continuous(labels = ~ format(.x, big.mark = " ")) +
  theme_pat(11) +
  labs(x = NULL, y = "Milliers d'euros par ménage",
       title = "En euros, le dernier décile écrase tous les autres",
       subtitle = "patrimoine brut moyen par décile et par composante (montant moyen = part × patrimoine brut moyen)")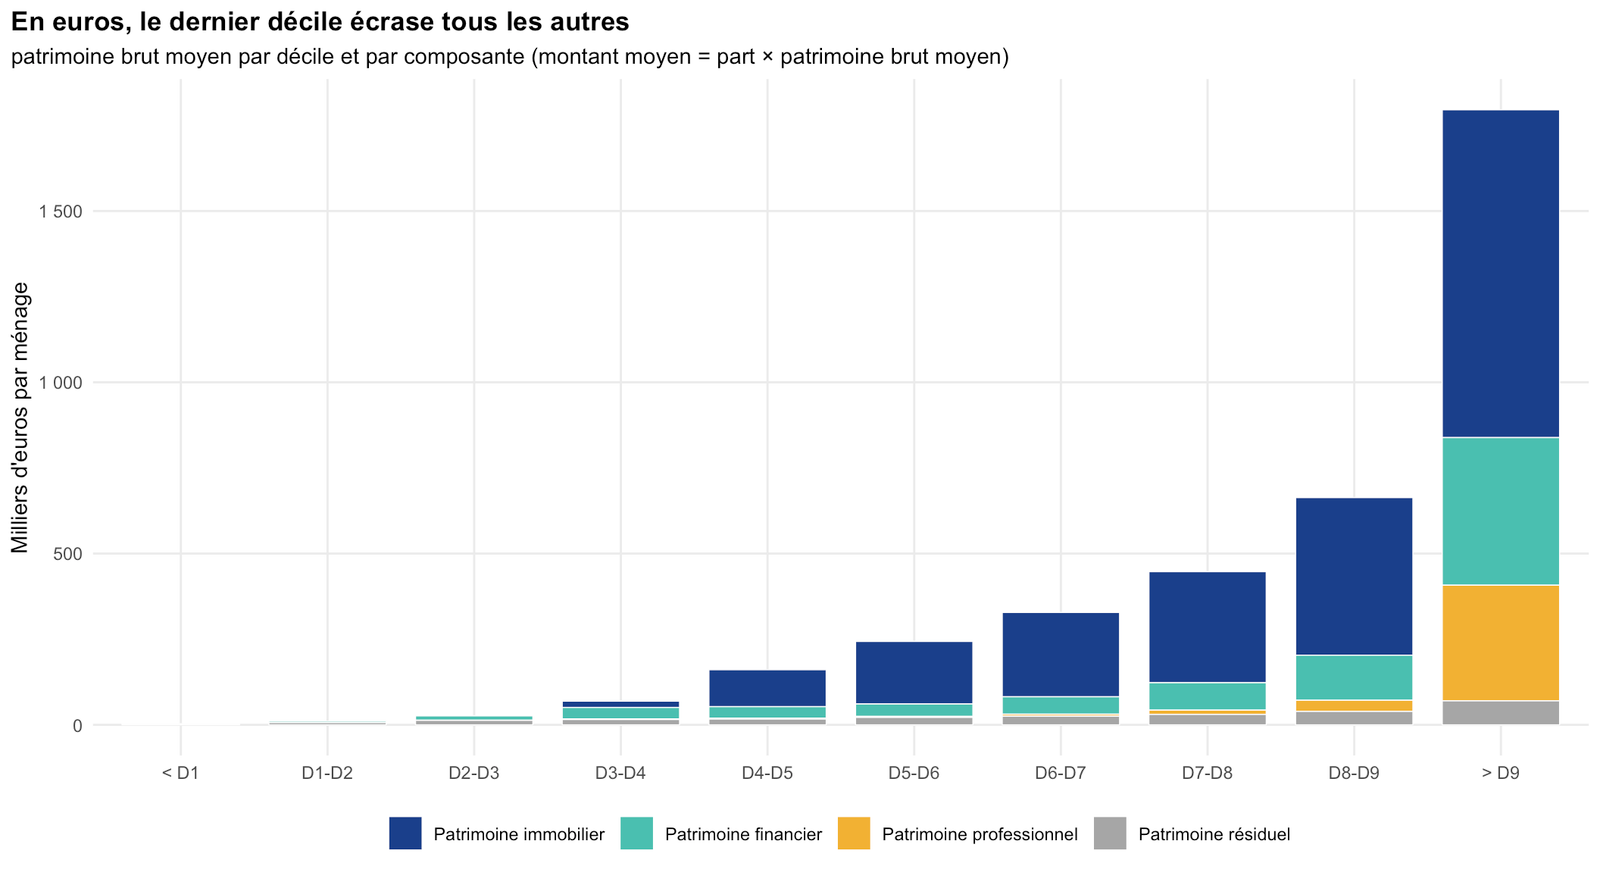
`reve-patrim-brut-compo` |>
  select(tranche, patrimoine_brut_moyen, composante, part) |>
  mutate(composante = str_remove(composante, "Patrimoine ")) |>
  pivot_wider(names_from = composante, values_from = part) |>
  mutate(patrimoine_brut_moyen = format(patrimoine_brut_moyen, big.mark = " ")) |>
  rename(`Tranche de patrimoine brut` = tranche, `Patrimoine brut moyen (€)` = patrimoine_brut_moyen) |>
print_table_conditional()| Tranche de patrimoine brut | Patrimoine brut moyen (€) | immobilier | financier | professionnel | résiduel | Emprunts |
|---|---|---|---|---|---|---|
| Inférieur au 1er décile | 2 700 | 0.0 | 32.0 | 0.3 | 67.7 | -29.1 |
| Du 1er au 2e décile | 10 500 | 0.6 | 37.8 | 0.9 | 60.7 | -18.3 |
| Du 2e au 3e décile | 26 600 | 1.9 | 47.4 | 1.6 | 49.1 | -14.5 |
| Du 3e au 4e décile | 69 100 | 26.6 | 48.1 | 2.9 | 22.4 | -10.1 |
| Du 4e au 5e décile | 160 900 | 67.0 | 20.8 | 1.8 | 10.4 | -17.8 |
| Du 5e au 6e décile | 243 500 | 75.0 | 14.9 | 1.2 | 8.9 | -21.1 |
| Du 6e au 7e décile | 327 800 | 75.1 | 15.5 | 1.8 | 7.7 | -18.1 |
| Du 7e au 8e décile | 447 200 | 72.5 | 17.9 | 2.8 | 6.8 | -14.4 |
| Du 8e au 9e décile | 664 100 | 69.3 | 19.8 | 4.9 | 5.9 | -13.6 |
| Supérieur au 9e décile | 1 795 600 | 53.3 | 24.0 | 18.8 | 3.9 | -10.6 |
| Du 90e au 95e centile | 1 029 400 | 68.5 | 19.2 | 7.0 | 5.2 | -12.3 |
| Du 95e au 99e centile | 1 763 700 | 57.9 | 25.0 | 13.5 | 3.6 | -10.4 |
| Supérieur au 99e centile | 5 745 200 | 34.1 | 27.2 | 35.8 | 2.9 | -9.5 |
| Ensemble | 374 900 | 61.3 | 21.7 | 10.6 | 6.4 | -13.3 |