Date: Vendredi 29 mai 2026, 06h41. Source: https://www.insee.fr/fr/statistiques/2416878#figure1_radio1
Niveau de vie selon l’âge - Données annuelles (1996-)
Données - INSEE
Info
- Niveau de vie selon l’âge. Données annuelles (1996-). html
Données officielles Insee
Annuel
Niveau de vie médian
Niveau de vie moyen
Date: Vendredi 29 mai 2026, 06h41. Source: https://www.insee.fr/fr/statistiques/2416878#figure1_radio2
Mensuel
Niveau de vie médian
Date: Vendredi 29 mai 2026, 06h41. Source: https://www.insee.fr/fr/statistiques/2416878#figure1_radio1
Niveau de vie moyen
Date: Vendredi 29 mai 2026, 06h41. Source: https://www.insee.fr/fr/statistiques/2416878#figure1_radio2
year
Code
`reve-niv-vie-individu-age-moy` %>%
  group_by(year) %>%
  summarise(Nobs = n()) %>%
print_table_conditional()| year | Nobs |
|---|---|
| 1996 | 8 |
| 1997 | 8 |
| 1998 | 8 |
| 1999 | 8 |
| 2000 | 8 |
| 2001 | 8 |
| 2002 | 8 |
| 2003 | 8 |
| 2004 | 8 |
| 2005 | 8 |
| 2006 | 8 |
| 2007 | 8 |
| 2008 | 8 |
| 2009 | 8 |
| 2010 | 8 |
| 20101 | 8 |
| 2011 | 8 |
| 2012 | 8 |
| 20122 | 8 |
| 2013 | 8 |
| 2014 | 8 |
| 2015 | 8 |
| 2016 | 8 |
| 2017 | 8 |
| 2018 | 8 |
| 2019 | 8 |
variable
Code
`reve-niv-vie-individu-age-moy` %>%
  left_join(age, by = "Age") %>%
  group_by(age, Age) %>%
  summarise(Nobs = n()) %>%
print_table_conditional()| age | Age | Nobs |
|---|---|---|
| 18- | Moins de 18 ans | 26 |
| 18-29 | De 18 à 29 ans | 26 |
| 30-39 | De 30 à 39 ans | 26 |
| 40-49 | De 40 à 49 ans | 26 |
| 50-64 | De 50 à 64 ans | 26 |
| 65-74 | De 65 à 74 ans | 26 |
| 75+ | 75 ans et plus | 26 |
| NA | Ensemble | 26 |
Niveau de vie moyen
Table 1996-2008, 2008-2019
Javascript
Code
`reve-niv-vie-individu-age-moy` %>%
  left_join(age, by = "Age") %>%
  mutate(year = as.numeric(year)) %>%
  filter(year %in% c(1996, 2008, 2019)) %>%
  select(age, Age, year, value) %>%
  spread(year, value) %>%
  mutate(`1996-2008` = round(100*((`2008`/`1996`)^(1/12)-1), 2),
         `2008-2019` = round(100*((`2019`/`2008`)^(1/11)-1), 2)) %>%
print_table_conditional()| age | Age | 1996 | 2008 | 2019 | 1996-2008 | 2008-2019 |
|---|---|---|---|---|---|---|
| 18- | Moins de 18 ans | 18560 | 22540 | 22530 | 1.63 | 0.00 |
| 18-29 | De 18 à 29 ans | 18330 | 22110 | 23000 | 1.57 | 0.36 |
| 30-39 | De 30 à 39 ans | 20170 | 24290 | 24930 | 1.56 | 0.24 |
| 40-49 | De 40 à 49 ans | 21830 | 25120 | 25360 | 1.18 | 0.09 |
| 50-64 | De 50 à 64 ans | 23760 | 28890 | 28740 | 1.64 | -0.05 |
| 65-74 | De 65 à 74 ans | 21200 | 25970 | 27050 | 1.71 | 0.37 |
| 75+ | 75 ans et plus | 20810 | 24130 | 24940 | 1.24 | 0.30 |
| NA | Ensemble | 20430 | 24720 | 25190 | 1.60 | 0.17 |
png
Code
i_g("bib/insee/reve-niv-vie-individu-age_1.png")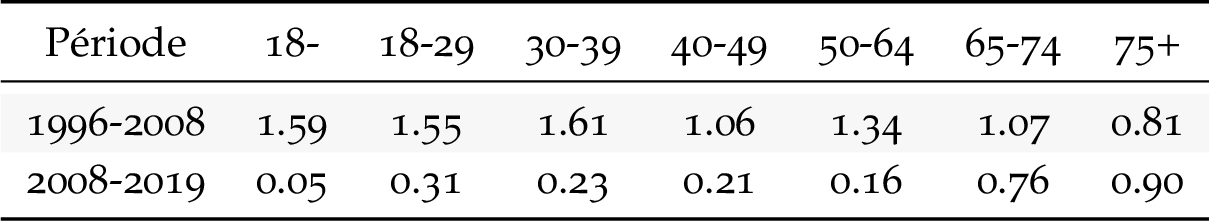
Graph
Code
`reve-niv-vie-individu-age-moy` %>%
  left_join(age, by = "Age") %>%
  filter(!is.na(age)) %>%
  mutate(year = as.numeric(year)) %>%
  filter(year %in% c(1996, 2008, 2019)) %>%
  spread(year, value) %>%
  transmute(age,
            `1996-2008` = (`2008`/`1996`)^(1/12)-1,
            `2008-2019` = (`2019`/`2008`)^(1/11)-1) %>%
  gather(variable, value, -age) %>%
  ggplot + geom_line(aes(x = age, y = value, color = variable, group = variable)) +
  theme_minimal() +
  theme(legend.position = c(0.15, 0.55),
        legend.title = element_blank()) +
  xlab("Age") + ylab("Gain de niveau de vie moyen en € 'constants' / an, INSEE") +
  scale_y_continuous(breaks = 0.01*seq(-30, 50, 0.1),
                     labels = percent_format(accuracy = .1)) +
  geom_hline(yintercept = 0, linetype = "dashed",  color = "black")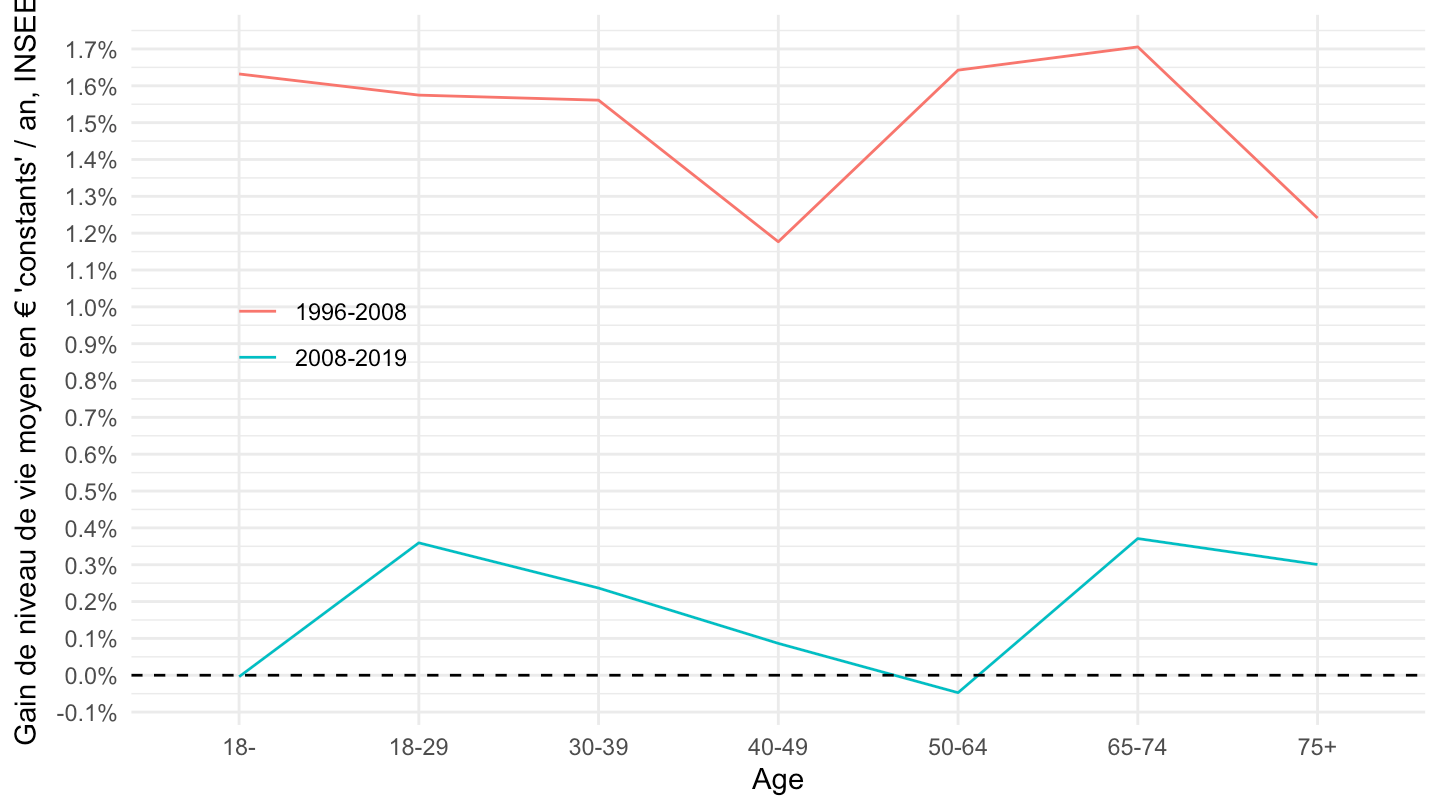
75 ans et plus, 30-39 ans, 65-74 ans, Ensemble
IPC
Code
`reve-niv-vie-individu-age-moy` %>%
  year_to_date2 %>%
  filter(Age %in% c("75 ans et plus", "De 30 à 39 ans",  "De 65 à 74 ans", "Ensemble")) %>%
  group_by(Age) %>%
  mutate(value = 100*value/value[1]) %>%
  ggplot() + ylab("Indice de niveau de vie") + xlab("") + theme_minimal() +
  geom_line(aes(x = date, y = value, color = Age)) +

  scale_x_date(breaks = seq(1920, 2025, 2) %>% paste0("-01-01") %>% as.Date,
               labels = date_format("%Y")) +
  theme(legend.position = c(0.15, 0.85),
        legend.title = element_blank()) +
  scale_y_log10(breaks = seq(10, 300, 2),
                     labels = dollar_format(accuracy = 1, prefix = ""))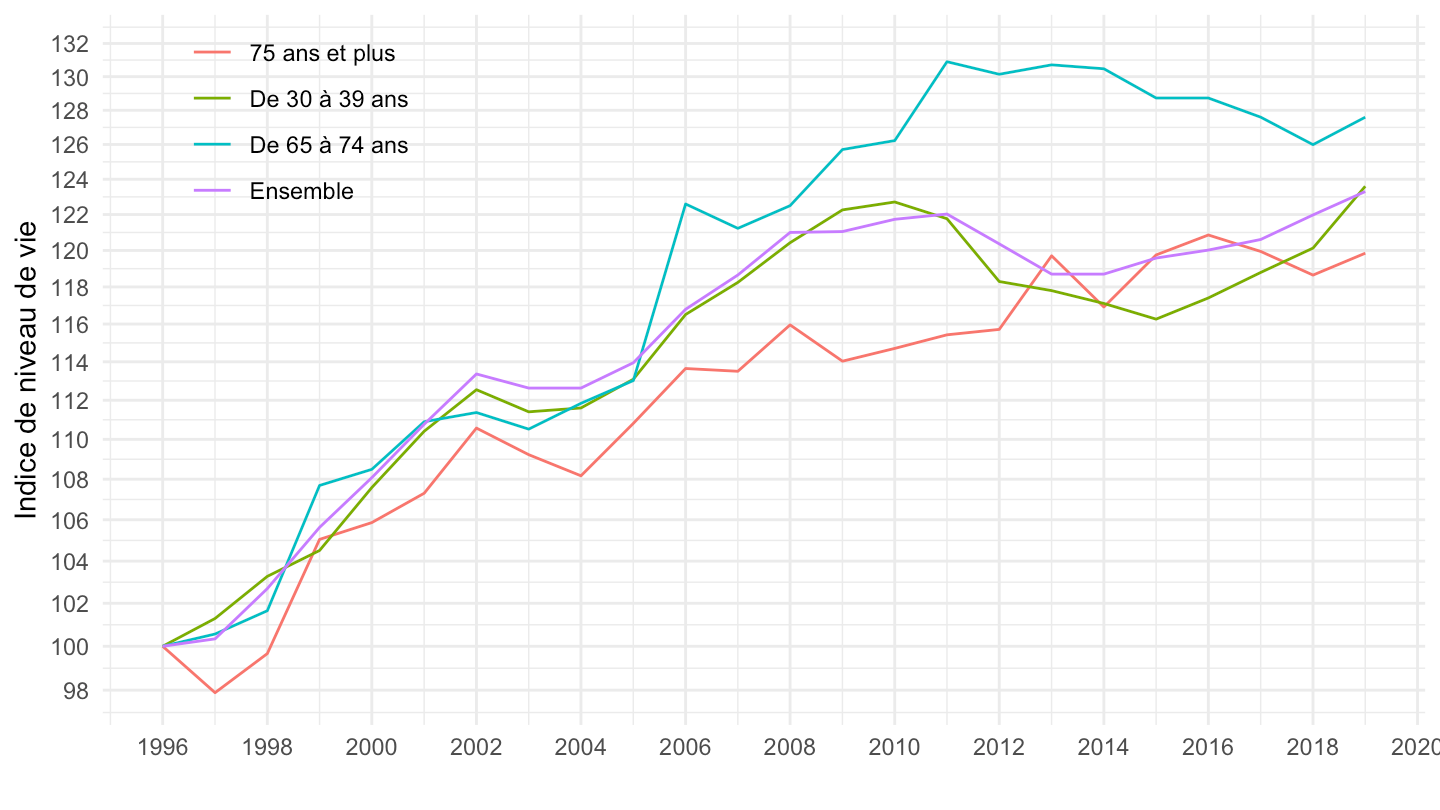
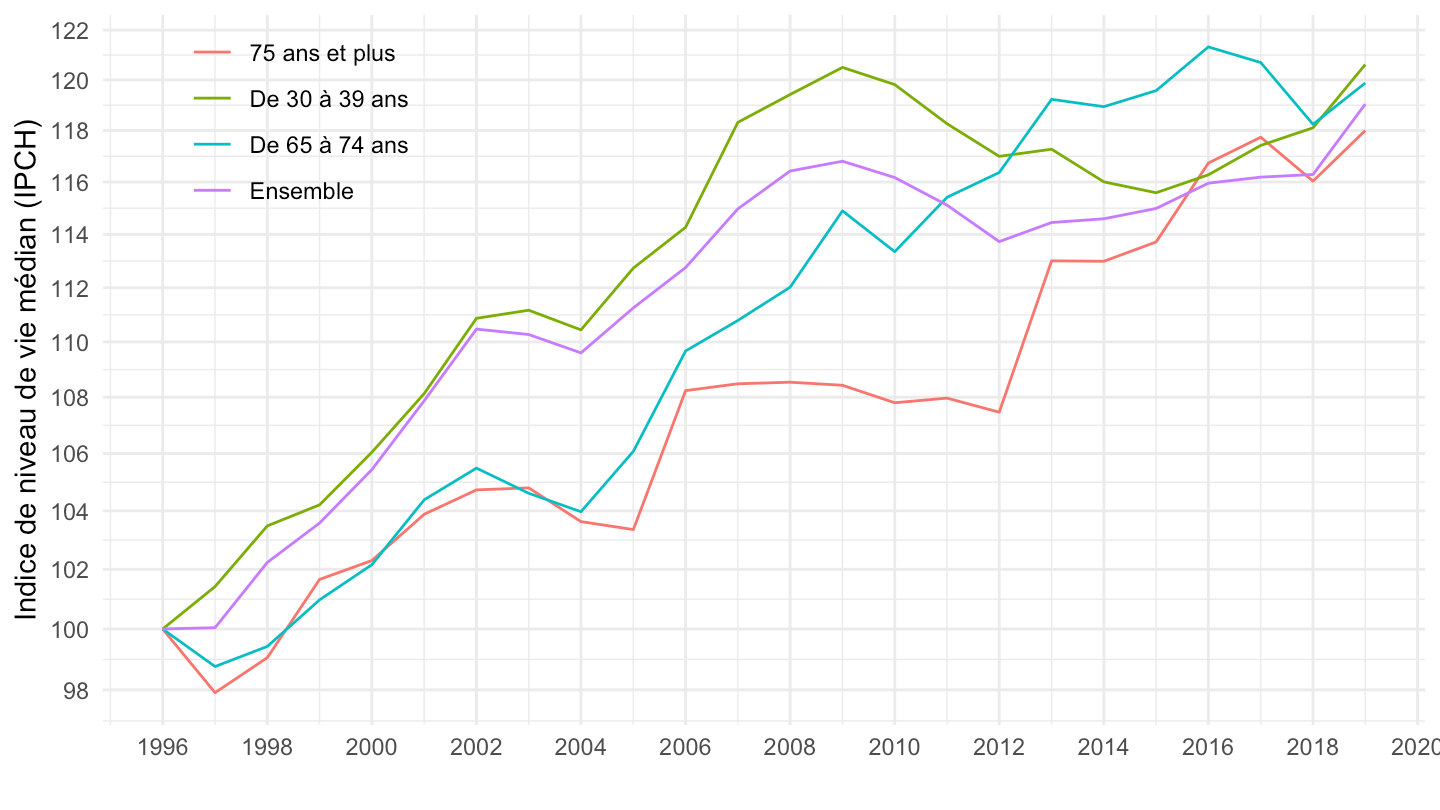
IPCH
Code
IPC_IPCH_adjustment <- `IPCH-IPC-2015-ensemble` %>%
  group_by(date) %>%
  summarise(OBS_VALUE = 100*OBS_VALUE[INDICATEUR == "IPCH"]/OBS_VALUE[INDICATEUR == "IPC"]) %>%
  filter(month(date) == 1,
         date <= as.Date("2019-01-01")) %>%
  select(date, IPC_IPCH_adjustment = OBS_VALUE)


`reve-niv-vie-individu-age-moy` %>%
  year_to_date2 %>%
  filter(Age %in% c("75 ans et plus", "De 30 à 39 ans",  "De 65 à 74 ans", "Ensemble")) %>%
  group_by(Age) %>%
  mutate(value = 100*value/value[1]) %>%
  left_join(IPC_IPCH_adjustment, by = "date") %>%
  ggplot() + ylab("Indice de niveau de vie (IPCH)") + xlab("") + theme_minimal() +
  geom_line(aes(x = date, y = 100*value/IPC_IPCH_adjustment, color = Age)) +

  scale_x_date(breaks = seq(1920, 2025, 2) %>% paste0("-01-01") %>% as.Date,
               labels = date_format("%Y")) +
  theme(legend.position = c(0.15, 0.85),
        legend.title = element_blank()) +
  scale_y_log10(breaks = seq(10, 300, 2),
                     labels = dollar_format(accuracy = 1, prefix = ""))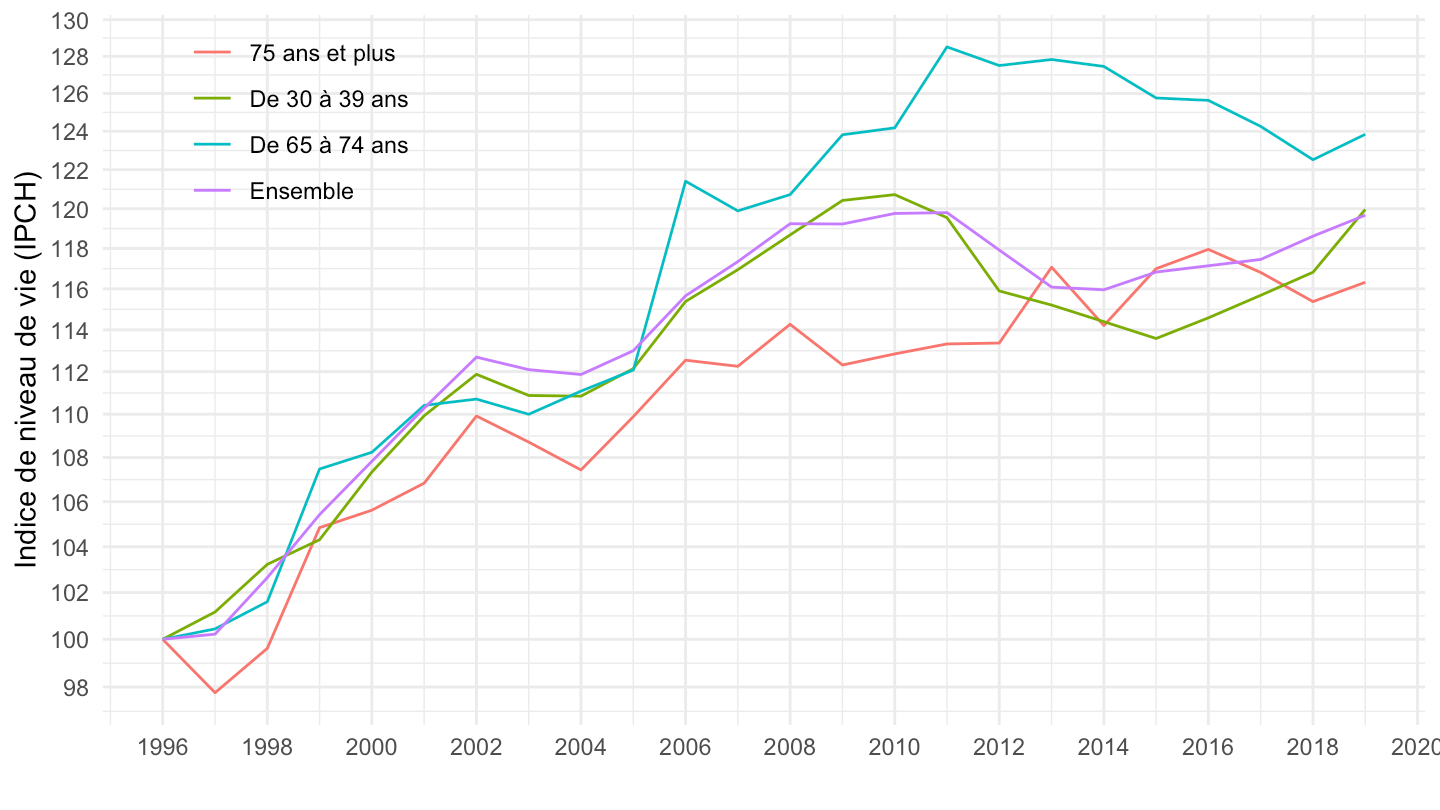
Niveau de vie médian
Table 1996-2008, 2008-2019
Code
`reve-niv-vie-individu-age-med` %>%
  mutate(year = as.numeric(year)) %>%
  filter(year %in% c(1996, 2008, 2019)) %>%
  select_if(~ n_distinct(.) > 1) %>%
  spread(year, value) %>%
  mutate(`1996-2008` = round(100*((`2008`/`1996`)^(1/12)-1), 2),
         `2008-2019` = round(100*((`2019`/`2008`)^(1/11)-1), 2)) %>%
print_table_conditional()| Age | 1996 | 2008 | 2019 | 1996-2008 | 2008-2019 |
|---|---|---|---|---|---|
| 75 ans et plus | 17750 | 19550 | 21580 | 0.81 | 0.90 |
| De 18 à 29 ans | 16820 | 20220 | 20920 | 1.55 | 0.31 |
| De 30 à 39 ans | 18130 | 21970 | 22530 | 1.61 | 0.23 |
| De 40 à 49 ans | 19370 | 21980 | 22490 | 1.06 | 0.21 |
| De 50 à 64 ans | 20490 | 24030 | 24450 | 1.34 | 0.16 |
| De 65 à 74 ans | 18800 | 21370 | 23220 | 1.07 | 0.76 |
| Ensemble | 17970 | 21230 | 22040 | 1.40 | 0.34 |
| Moins de 18 ans | 16310 | 19720 | 19830 | 1.59 | 0.05 |
Graph
Code
`reve-niv-vie-individu-age-med` %>%
  left_join(age, by = "Age") %>%
  filter(!is.na(age)) %>%
  mutate(year = as.numeric(year)) %>%
  filter(year %in% c(1996, 2008, 2019)) %>%
  spread(year, value) %>%
  transmute(age,
            `1996-2008` = (`2008`/`1996`)^(1/12)-1,
            `2008-2019` = (`2019`/`2008`)^(1/11)-1) %>%
  gather(variable, value, -age) %>%
  ggplot + geom_line(aes(x = age, y = value, color = variable, group = variable)) +
  theme_minimal() +
  theme(legend.position = c(0.15, 0.55),
        legend.title = element_blank()) +
  xlab("Age") + ylab("Gain de niveau de vie median en € 'constants' / an, INSEE") +
  scale_y_continuous(breaks = 0.01*seq(-30, 50, 0.1),
                     labels = percent_format(accuracy = .1)) +
  geom_hline(yintercept = 0, linetype = "dashed",  color = "black")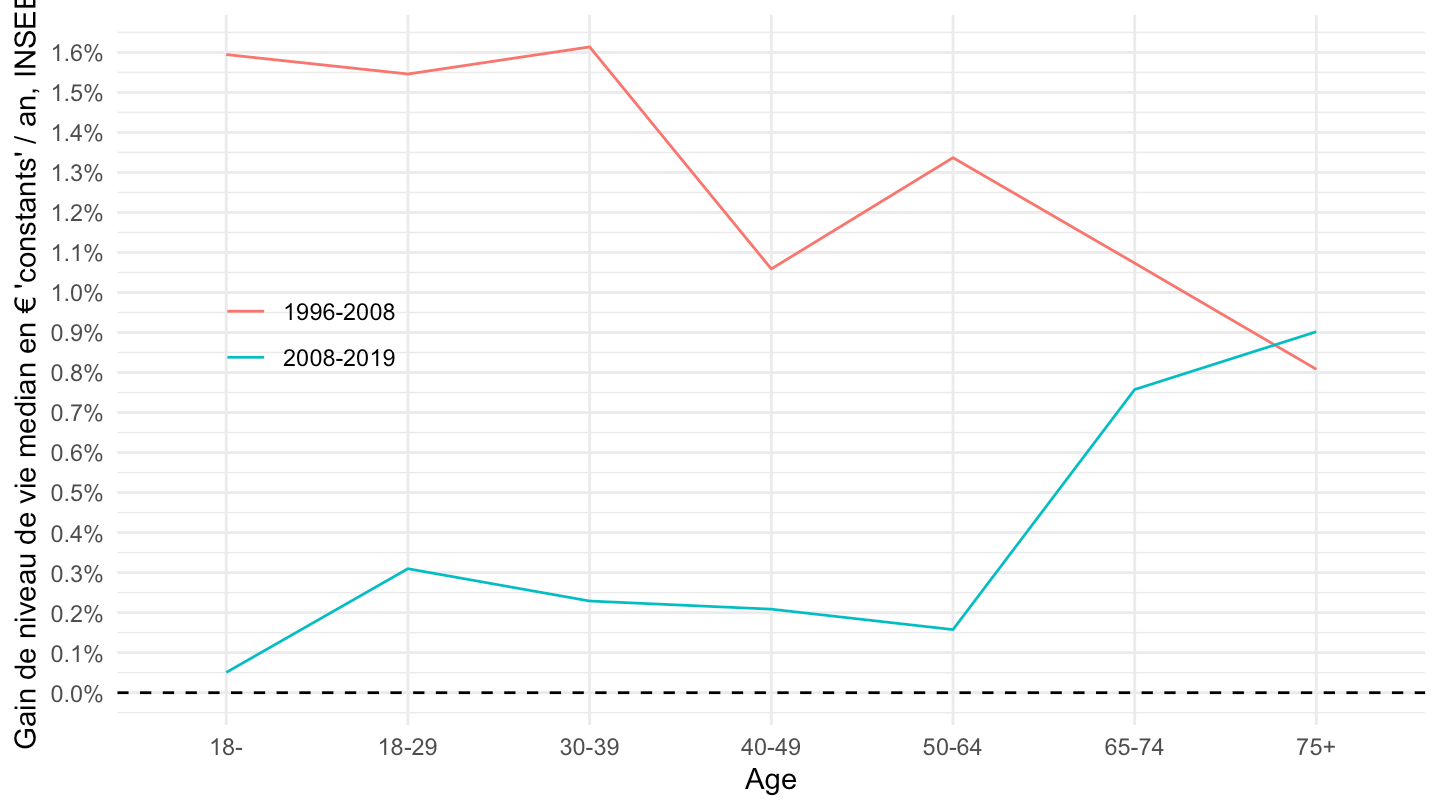
75 ans et plus, 30-39 ans, 65-74 ans, Ensemble
IPC
Code
`reve-niv-vie-individu-age-med` %>%
  year_to_date2 %>%
  filter(Age %in% c("75 ans et plus", "De 30 à 39 ans",  "De 65 à 74 ans", "Ensemble")) %>%
  group_by(Age) %>%
  mutate(value = 100*value/value[1]) %>%
  ggplot() + ylab("Indice de niveau de vie médian") + xlab("") + theme_minimal() +
  geom_line(aes(x = date, y = value, color = Age)) +
  scale_x_date(breaks = seq(1920, 2025, 2) %>% paste0("-01-01") %>% as.Date,
               labels = date_format("%Y")) +
  theme(legend.position = c(0.15, 0.85),
        legend.title = element_blank()) +
  scale_y_log10(breaks = seq(10, 300, 2),
                     labels = dollar_format(accuracy = 1, prefix = ""))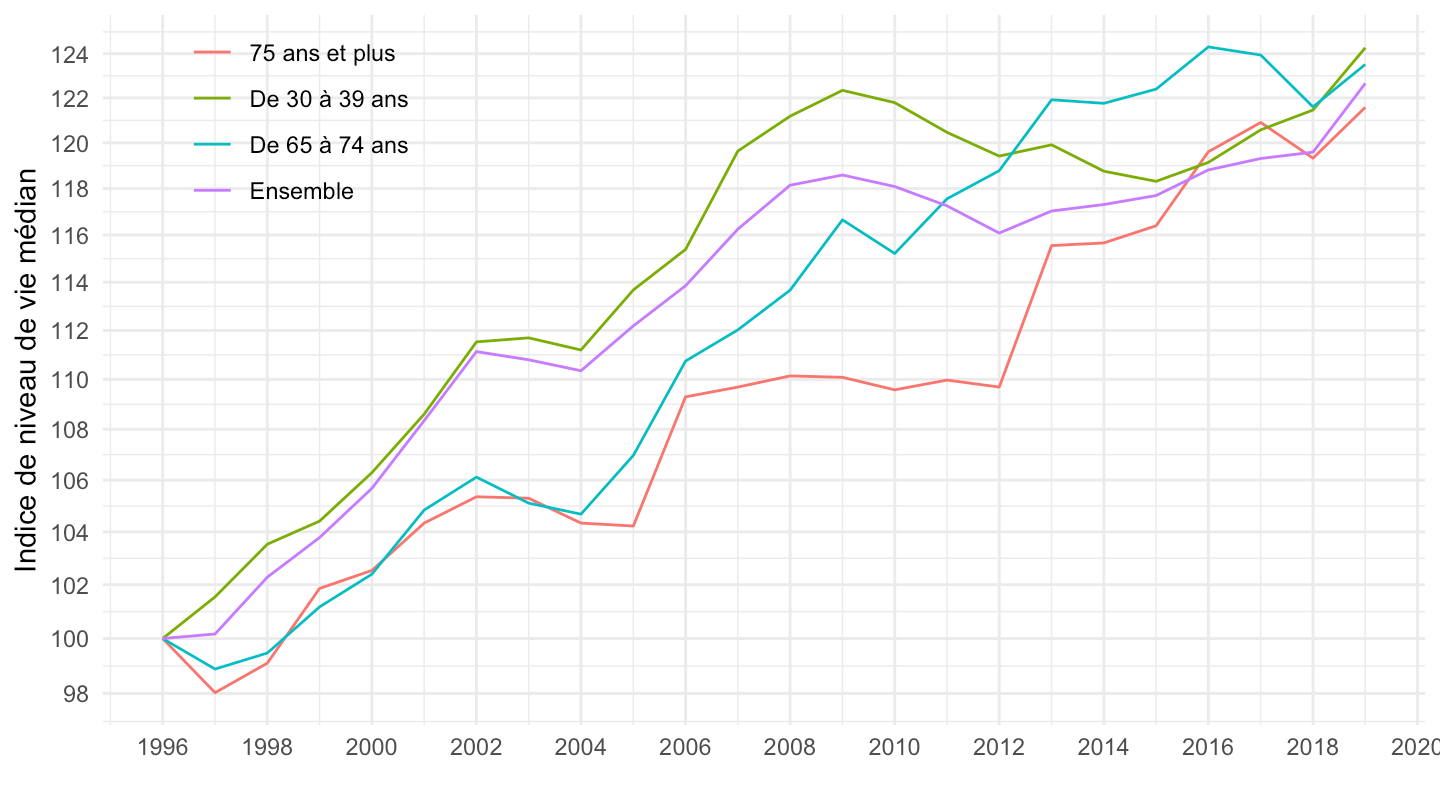
IPCH
Code
IPC_IPCH_adjustment <- `IPCH-IPC-2015-ensemble` %>%
  group_by(date) %>%
  summarise(OBS_VALUE = 100*OBS_VALUE[INDICATEUR == "IPCH"]/OBS_VALUE[INDICATEUR == "IPC"]) %>%
  filter(month(date) == 1,
         date <= as.Date("2019-01-01")) %>%
  select(date, IPC_IPCH_adjustment = OBS_VALUE)


`reve-niv-vie-individu-age-med` %>%
  year_to_date2 %>%
  filter(Age %in% c("75 ans et plus", "De 30 à 39 ans",  "De 65 à 74 ans", "Ensemble")) %>%
  group_by(Age) %>%
  mutate(value = 100*value/value[1]) %>%
  left_join(IPC_IPCH_adjustment, by = "date") %>%
  ggplot() + ylab("Indice de niveau de vie médian (IPCH)") + xlab("") + theme_minimal() +
  geom_line(aes(x = date, y = 100*value/IPC_IPCH_adjustment, color = Age)) +
  scale_x_date(breaks = seq(1920, 2025, 2) %>% paste0("-01-01") %>% as.Date,
               labels = date_format("%Y")) +
  theme(legend.position = c(0.15, 0.85),
        legend.title = element_blank()) +
  scale_y_log10(breaks = seq(10, 300, 2),
                     labels = dollar_format(accuracy = 1, prefix = ""))