Last data update: 26 oct. 2026, 19:23
Last compile: 26 oct. 2026, 19:24
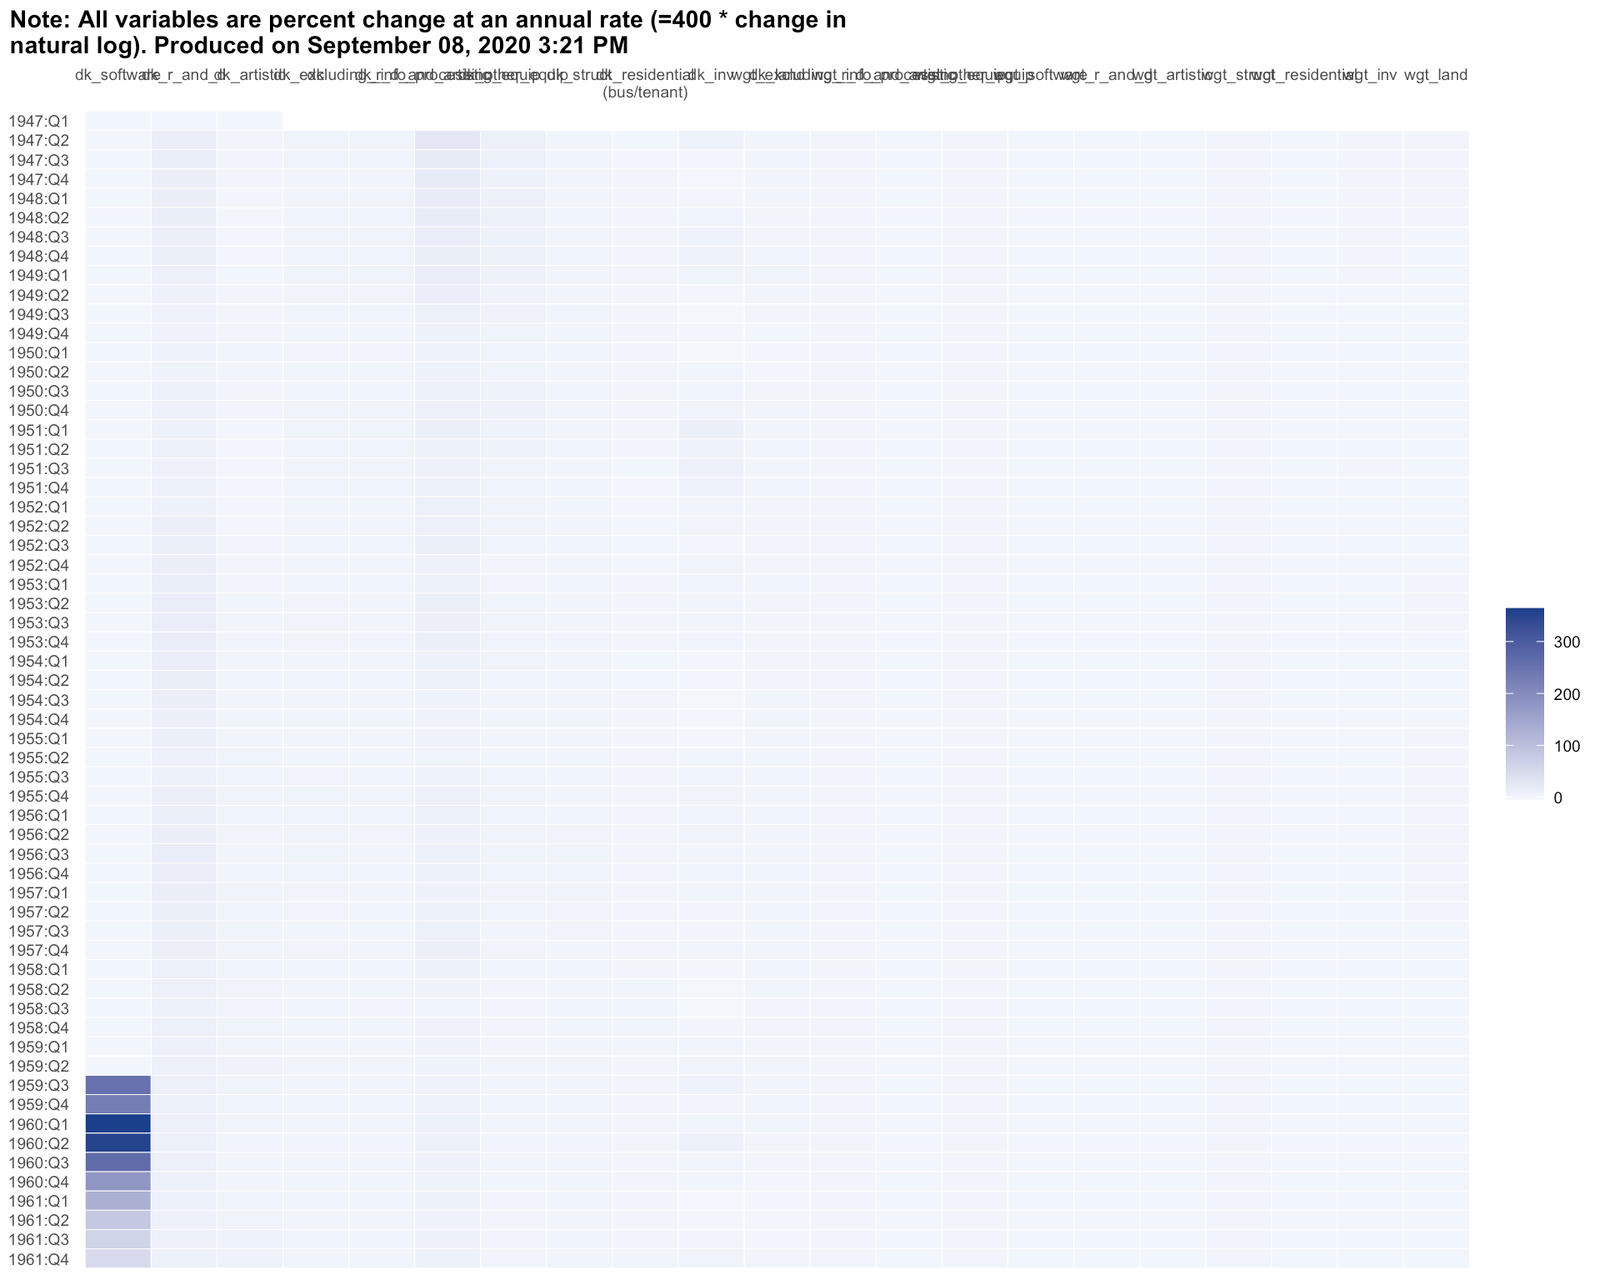
d1 |>
  filter(!is.na(valeur), !total100) |>
  filter(libelle %in% head(unique(libelle), 60)) |>
  mutate(lab = fct_inorder(libelle), serie = fct_inorder(serie)) |>
  ggplot(aes(x = serie, y = fct_rev(lab), fill = valeur)) +
  geom_tile(color = "white") +
  scale_x_discrete(labels = scales::label_wrap(12), position = "top") +
  scale_y_discrete(labels = scales::label_wrap(40)) +
  scale_fill_gradient(low = "#F4F8FD", high = bleu, name = "") +
  theme_pub(9) +
  labs(x = NULL, y = NULL, title = str_wrap("Note: All variables are percent change at an annual rate (=400 * change in natural log). Produced on September 08, 2020 3:21 PM", 75)) +
  theme(legend.position = "right", panel.grid = element_blank())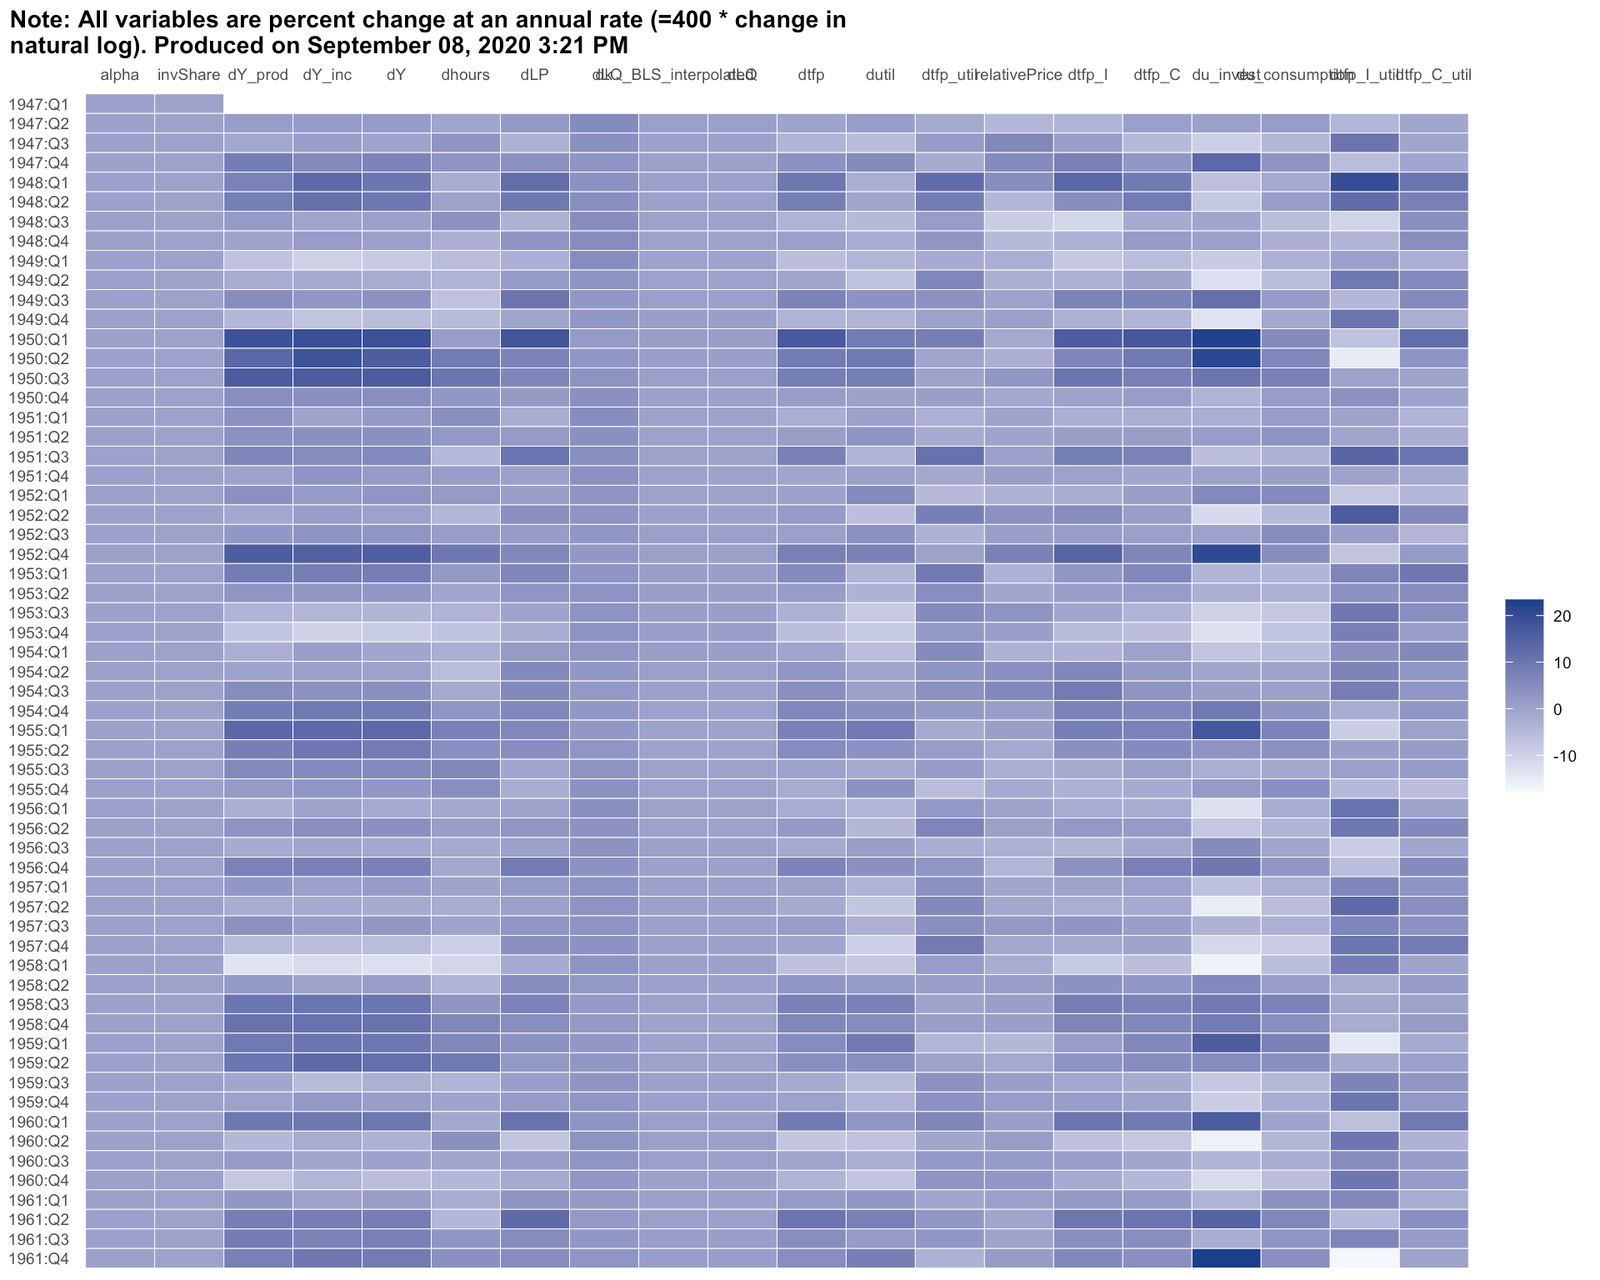
d2 |>
  filter(!is.na(valeur), !is.na(annee), !total100, cle %in% head(unique(cle), 24)) |>
  mutate(cle = str_wrap(cle, 32)) |>
  ggplot(aes(x = annee, y = valeur)) +
  geom_line(color = bleu, linewidth = 0.9) +
  facet_wrap(~ cle, scales = "free_y", ncol = 3) +
  theme_pub(9) +
  labs(x = NULL, y = "",
       title = str_wrap("annual", 75)) +
  theme(legend.position = "none")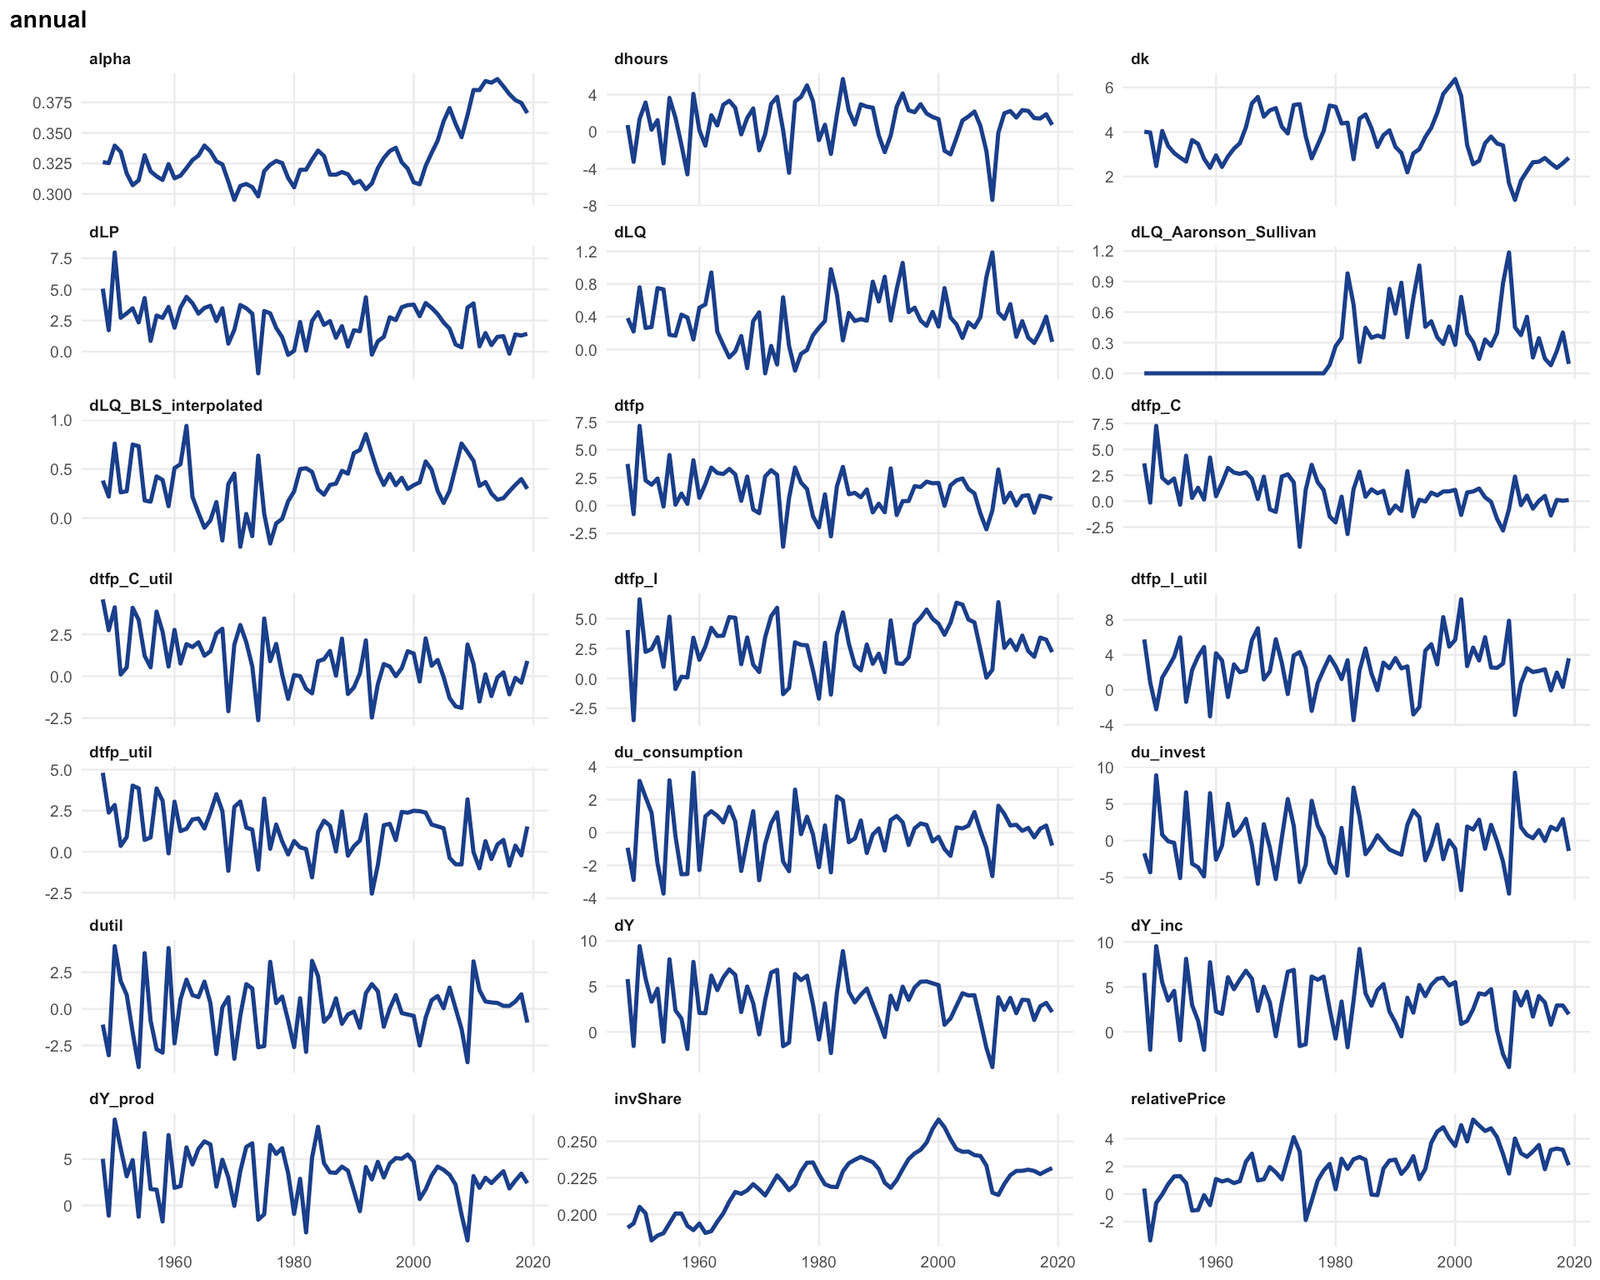
d3 |>
  filter(!is.na(valeur), !total100) |>
  filter(libelle %in% head(unique(libelle), 60)) |>
  mutate(lab = fct_inorder(libelle), serie = fct_inorder(serie)) |>
  ggplot(aes(x = serie, y = fct_rev(lab), fill = valeur)) +
  geom_tile(color = "white") +
  scale_x_discrete(labels = scales::label_wrap(12), position = "top") +
  scale_y_discrete(labels = scales::label_wrap(40)) +
  scale_fill_gradient(low = "#F4F8FD", high = bleu, name = "") +
  theme_pub(9) +
  labs(x = NULL, y = NULL, title = str_wrap("Note: All variables are percent change at an annual rate (=400 * change in natural log). Produced on September 08, 2020 3:21 PM", 75)) +
  theme(legend.position = "right", panel.grid = element_blank())