Last data update: 17 sept. 2026, 22:39
Last compile: 08 oct. 2026, 01:28
fig1 |>
  filter(section != "Ensemble") |>
  mutate(caracteristique = fct_reorder(caracteristique, part_delocalise)) |>
  ggplot(aes(x = caracteristique, y = part_delocalise, fill = section)) +
  geom_col(show.legend = FALSE) +
  geom_hline(yintercept = fig1$part_delocalise[fig1$section == "Ensemble"],
             linetype = "dashed", color = "grey40") +
  coord_flip() +
  facet_wrap(~ section, scales = "free_y", ncol = 1) +
  theme_minimal(base_size = 11) +
  labs(x = NULL, y = NULL,
       title = "Part des entreprises ayant délocalisé entre 2021 et 2023",
       subtitle = "selon leurs caractéristiques (%) ; ligne pointillée = ensemble (2 %)") +
  theme(panel.grid.minor = element_blank(),
        panel.grid.major.y = element_blank(),
        strip.text = element_text(size = 9))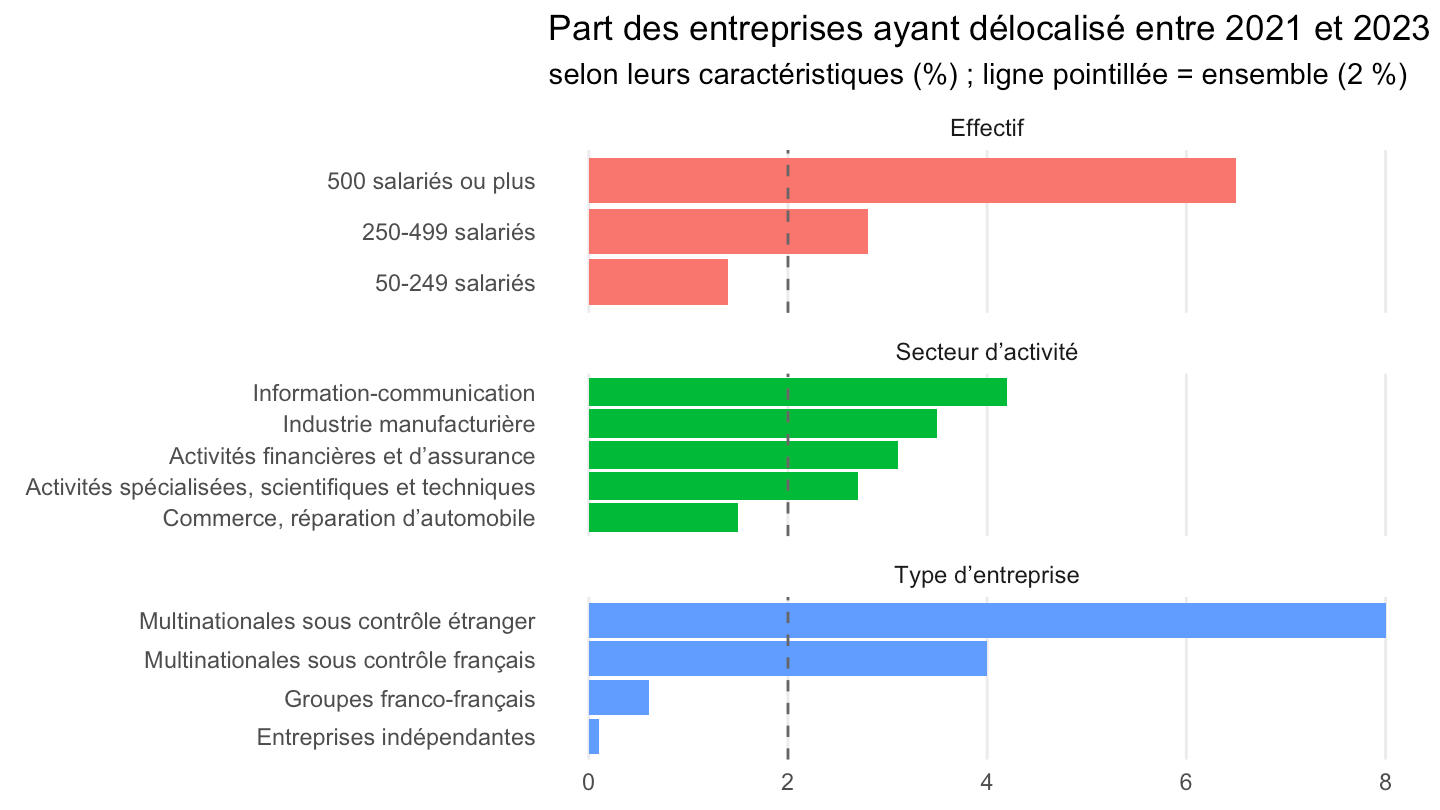
fig2 |>
  mutate(activite = fct_reorder(activite, part)) |>
  ggplot(aes(x = activite, y = part)) +
  geom_col(fill = "#1B3F8B") +
  geom_text(aes(label = paste0(part, "%")), hjust = -0.15, size = 4) +
  coord_flip(clip = "off") +
  scale_y_continuous(expand = expansion(mult = c(0, 0.12))) +
  theme_minimal(base_size = 13) +
  labs(x = NULL, y = NULL,
       title = "Principales activités délocalisées",
       subtitle = "par les entreprises entre 2021 et 2023 (%, plusieurs réponses possibles)") +
  theme(panel.grid.minor = element_blank(),
        panel.grid.major.y = element_blank())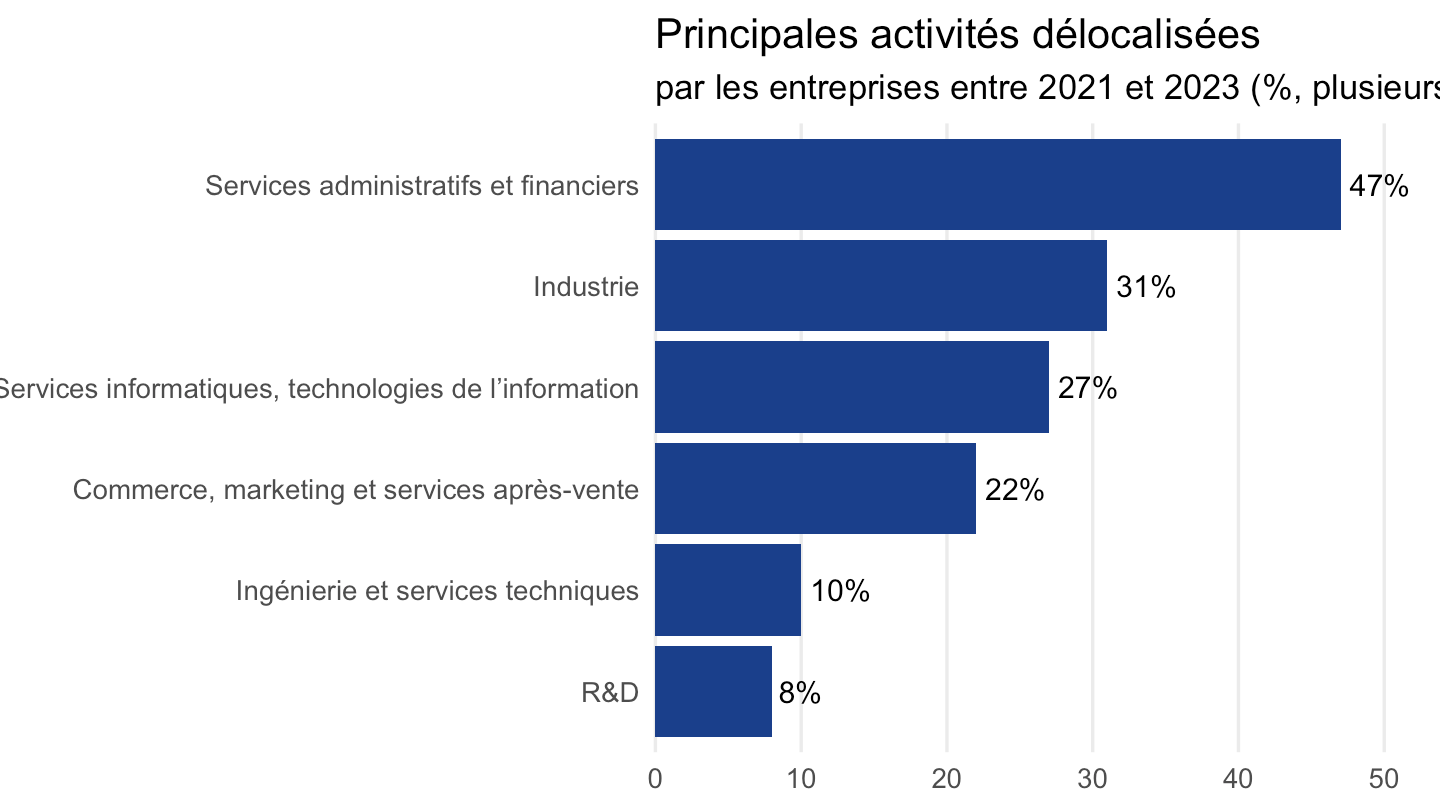
fig3 |>
  mutate(zone = fct_reorder(zone, part)) |>
  ggplot(aes(x = zone, y = part)) +
  geom_col(fill = "#E8737A") +
  geom_text(aes(label = paste0(part, "%")), hjust = -0.15, size = 4) +
  coord_flip(clip = "off") +
  scale_y_continuous(expand = expansion(mult = c(0, 0.12))) +
  theme_minimal(base_size = 12) +
  labs(x = NULL, y = NULL,
       title = "Principales zones géographiques de délocalisation",
       subtitle = "entre 2021 et 2023 (%, plusieurs réponses possibles)") +
  theme(panel.grid.minor = element_blank(),
        panel.grid.major.y = element_blank())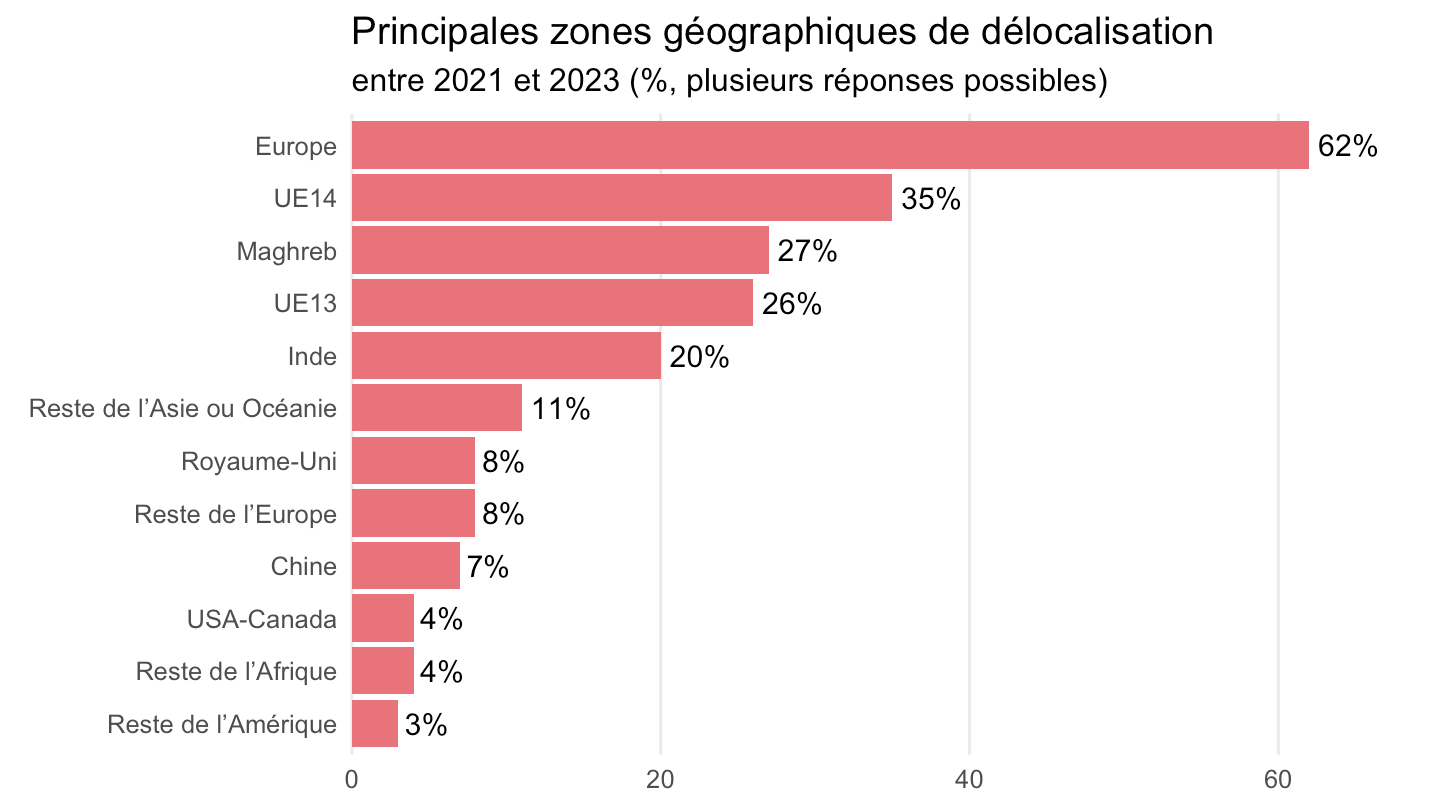
fig4 |>
  mutate(motivation = fct_reorder(motivation, part)) |>
  ggplot(aes(x = motivation, y = part)) +
  geom_col(fill = "#B8860B") +
  geom_text(aes(label = paste0(part, "%")), hjust = -0.15, size = 4) +
  coord_flip(clip = "off") +
  scale_y_continuous(expand = expansion(mult = c(0, 0.12))) +
  theme_minimal(base_size = 12) +
  labs(x = NULL, y = NULL,
       title = "Principales motivations des entreprises ayant délocalisé",
       subtitle = "entre 2021 et 2023 (%)") +
  theme(panel.grid.minor = element_blank(),
        panel.grid.major.y = element_blank())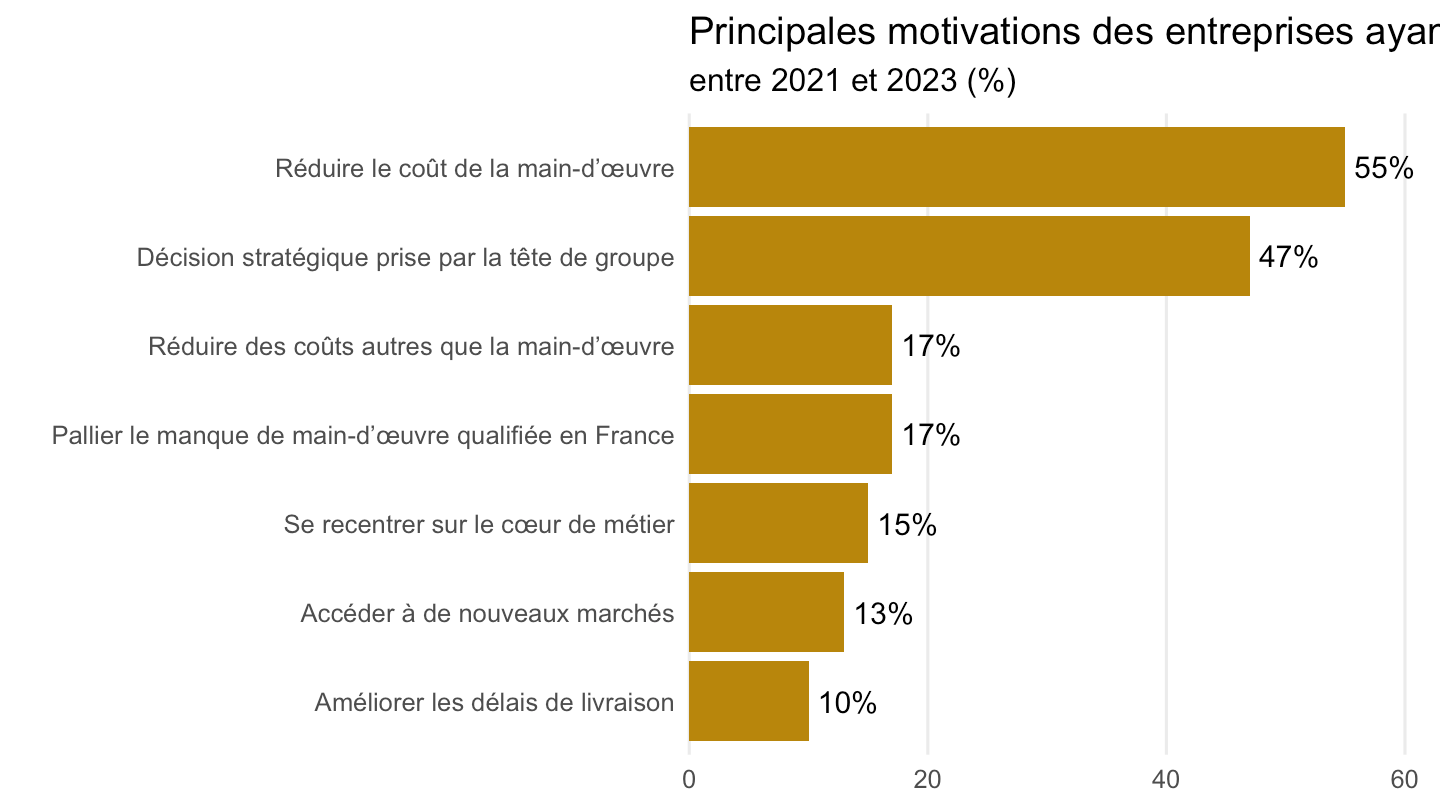
fig_encadre |>
  filter(!is.na(taux_delocalisation)) |>
  mutate(pays = fct_reorder(pays, taux_delocalisation)) |>
  ggplot(aes(x = pays, y = taux_delocalisation, fill = est_agregat)) +
  geom_col(show.legend = FALSE) +
  coord_flip() +
  scale_fill_manual(values = c("TRUE" = "#E8737A", "FALSE" = "#1B3F8B")) +
  theme_minimal(base_size = 10) +
  labs(x = NULL, y = NULL,
       title = "Part d'entreprises ayant délocalisé entre 2021 et 2023, selon le pays",
       subtitle = "en % ; France et Union européenne en rouge") +
  theme(panel.grid.minor = element_blank(),
        panel.grid.major.y = element_blank())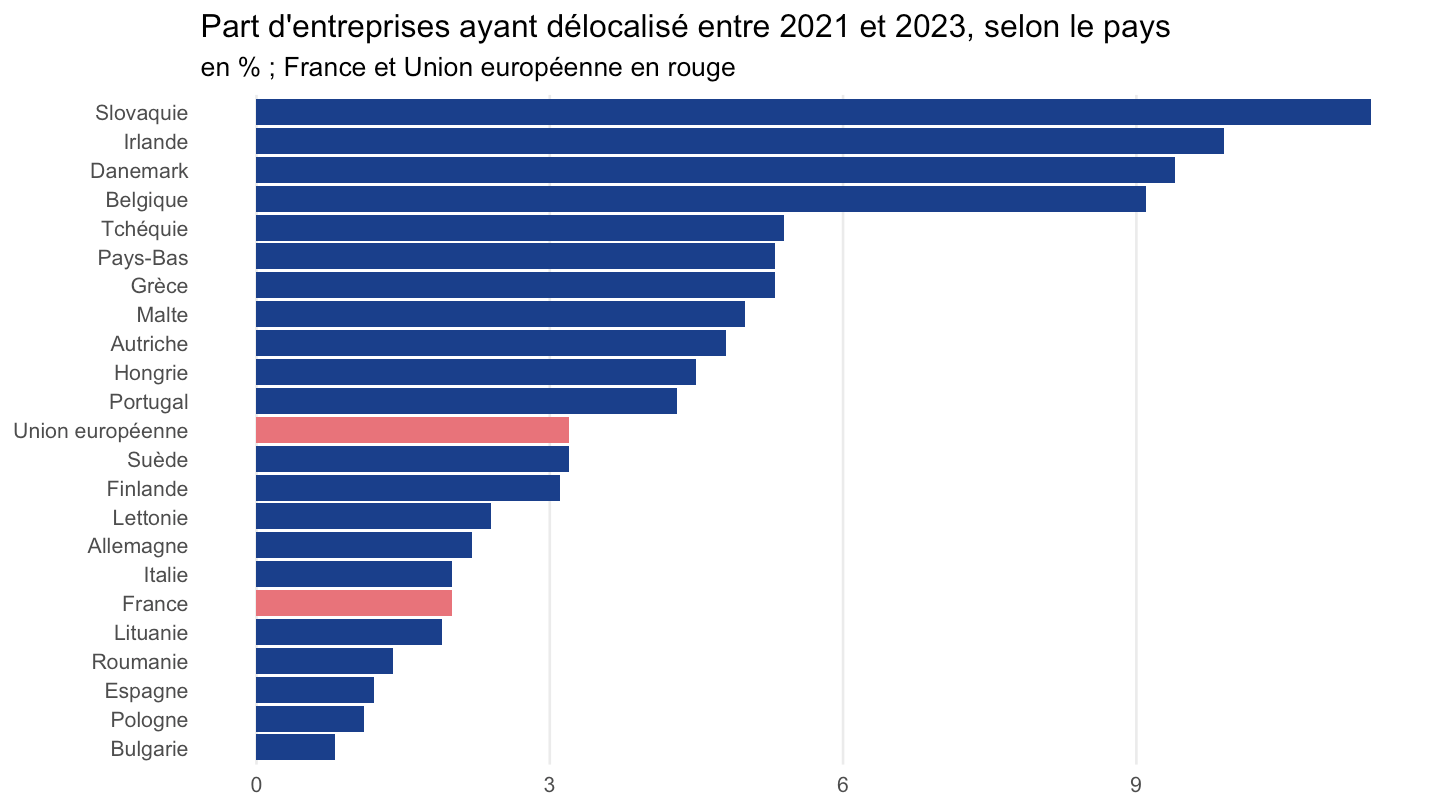
tc1 |>
  filter(caracteristique != "ensemble") |>
  mutate(caracteristique = recode(caracteristique,
    multinationales_controle_etranger = "Multinationale contrôle étranger",
    activite_industrielle = "Activité : industrielle",
    activite_services_admin_financiers = "Activité : services admin./fin.",
    activite_services_commerciaux = "Activité : services commerciaux",
    activite_services_informatiques = "Activité : services informatiques",
    zone_ue14 = "Zone : UE14", zone_ue13 = "Zone : UE13",
    zone_maghreb = "Zone : Maghreb", zone_inde = "Zone : Inde"
  ),
  motivation = str_wrap(motivation, 35),
  motivation = fct_reorder(motivation, part, .fun = mean)) |>
  ggplot(aes(x = motivation, y = part, fill = caracteristique)) +
  geom_col(position = position_dodge(width = 0.85), width = 0.8) +
  coord_flip() +
  scale_fill_brewer(palette = "Paired", name = NULL) +
  theme_minimal(base_size = 9) +
  labs(x = NULL, y = NULL,
       title = "Principales motivations selon les caractéristiques de l'entreprise",
       subtitle = "entre 2021 et 2023 (%)") +
  theme(legend.position = "bottom",
        panel.grid.minor = element_blank(),
        panel.grid.major.y = element_blank())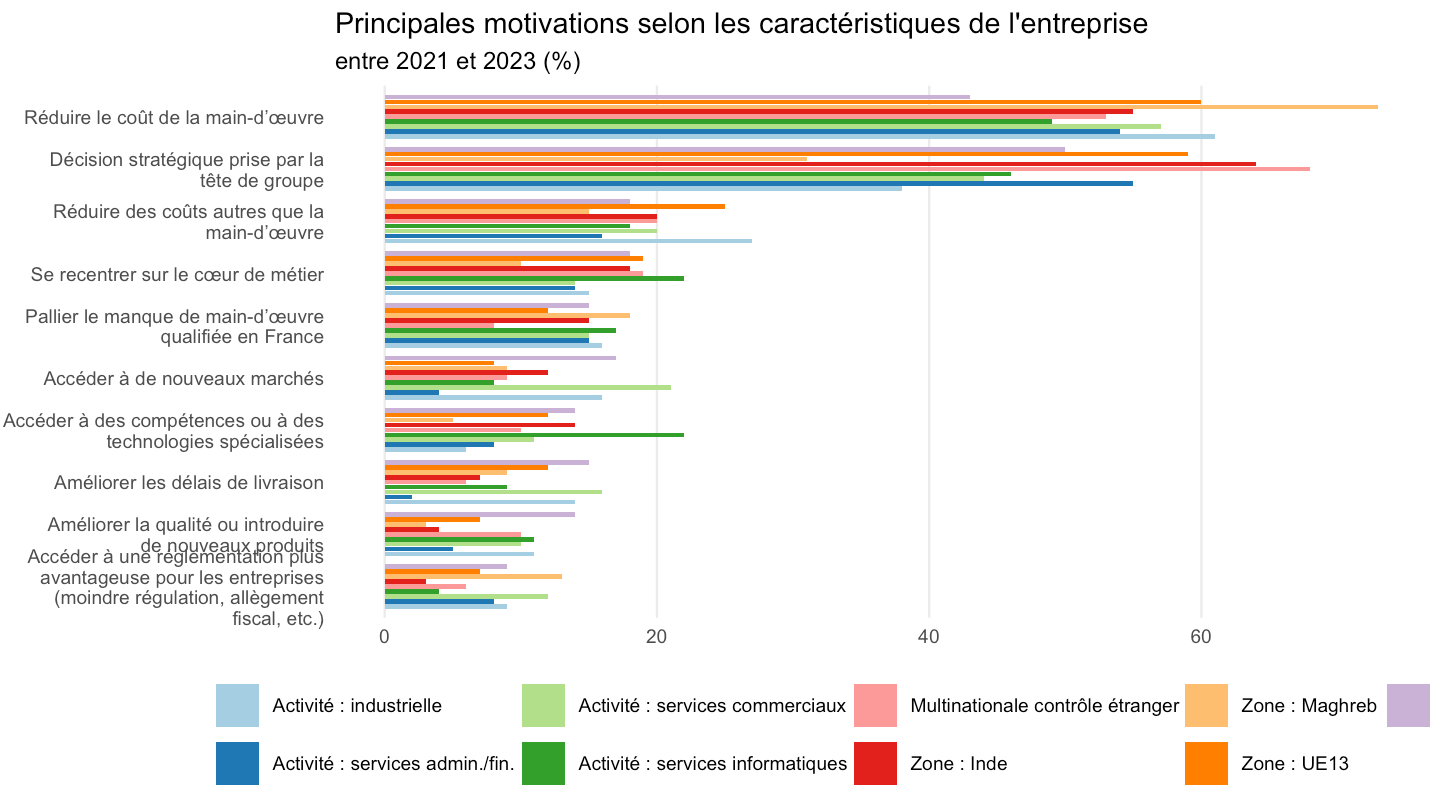
tc2 |>
  mutate(frein = str_wrap(frein, 40), frein = fct_reorder(frein, part)) |>
  ggplot(aes(x = frein, y = part)) +
  geom_col(fill = "#1B3F8B") +
  geom_text(aes(label = paste0(part, "%")), hjust = -0.15, size = 3.5) +
  coord_flip(clip = "off") +
  scale_y_continuous(expand = expansion(mult = c(0, 0.12))) +
  theme_minimal(base_size = 10) +
  labs(x = NULL, y = NULL,
       title = "Principaux freins dans le choix de ne pas délocaliser",
       subtitle = "entre 2021 et 2023 (%)") +
  theme(panel.grid.minor = element_blank(),
        panel.grid.major.y = element_blank())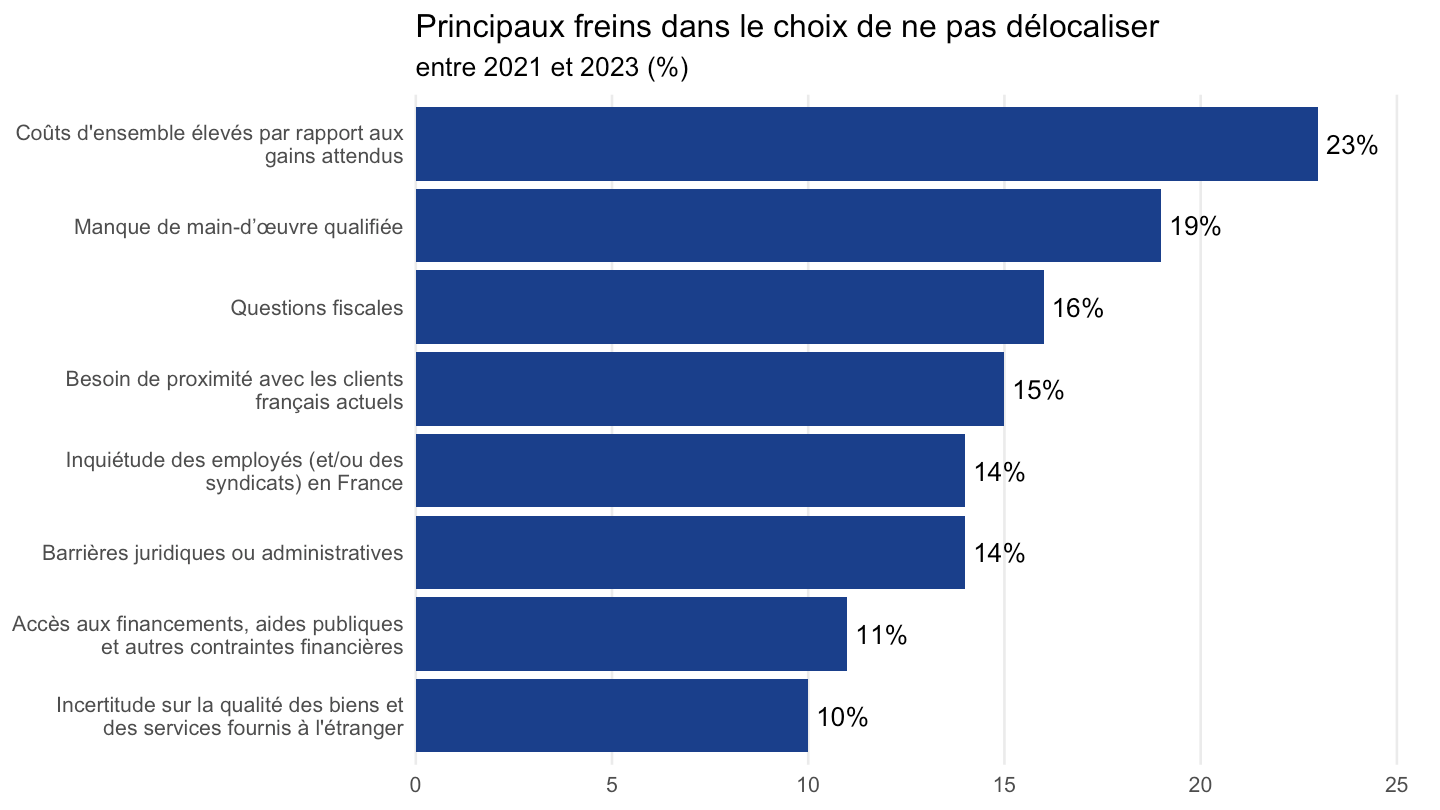
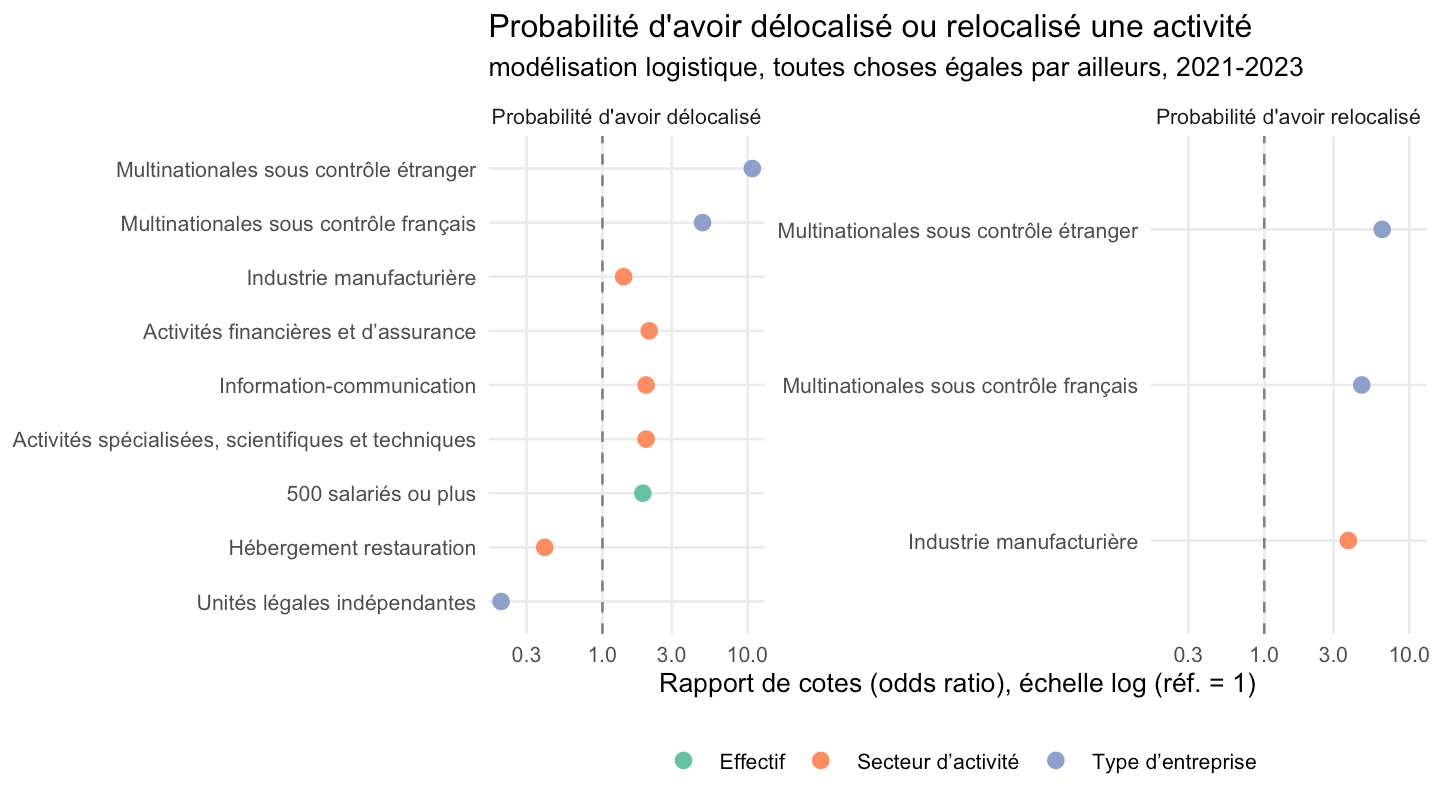
bind_rows(
  tc3 |> mutate(modele = "Probabilité d'avoir délocalisé"),
  tc4 |> mutate(modele = "Probabilité d'avoir relocalisé")
) |>
  filter(!reference, !is.na(odds_ratio)) |>
  mutate(modalite = fct_reorder(modalite, odds_ratio)) |>
  ggplot(aes(x = modalite, y = odds_ratio, color = variable)) +
  geom_hline(yintercept = 1, linetype = "dashed", color = "grey50") +
  geom_point(size = 2.5) +
  coord_flip() +
  facet_wrap(~ modele, scales = "free_y") +
  scale_y_log10() +
  scale_color_brewer(palette = "Set2", name = NULL) +
  theme_minimal(base_size = 10) +
  labs(x = NULL, y = "Rapport de cotes (odds ratio), échelle log (réf. = 1)",
       title = "Probabilité d'avoir délocalisé ou relocalisé une activité",
       subtitle = "modélisation logistique, toutes choses égales par ailleurs, 2021-2023") +
  theme(legend.position = "bottom",
        panel.grid.minor = element_blank())