Last observation: 2018 (N = 3)
First observation: 1996 (N = 3)
Last data update: 02 août 2026, 11:04
Last compile: 10 oct. 2026, 01:10
ip1828 |>
  group_by(date) |>
  summarise(Nobs = n()) |>
print_table_conditional()| date | Nobs |
|---|---|
| 1996-01-01 | 3 |
| 1997-01-01 | 3 |
| 1998-01-01 | 3 |
| 1999-01-01 | 3 |
| 2000-01-01 | 3 |
| 2001-01-01 | 3 |
| 2002-01-01 | 3 |
| 2003-01-01 | 3 |
| 2004-01-01 | 3 |
| 2005-01-01 | 3 |
| 2006-01-01 | 3 |
| 2007-01-01 | 3 |
| 2008-01-01 | 3 |
| 2009-01-01 | 3 |
| 2010-01-01 | 3 |
| 2011-01-01 | 3 |
| 2012-01-01 | 3 |
| 2013-01-01 | 3 |
| 2014-01-01 | 3 |
| 2015-01-01 | 3 |
| 2016-01-01 | 3 |
| 2017-01-01 | 3 |
| 2018-01-01 | 3 |
ip1828 |>
  group_by(variable, sheet) |>
  summarise(Nobs = n()) |>
print_table_conditional()| variable | sheet | Nobs |
|---|---|---|
| decile1 | fig5 | 23 |
| decile9 | fig5 | 23 |
| mediane | fig5 | 23 |
ip1828 |>
  mutate(year = year(date)) |>
  select(-date) |>
  filter(sheet == "fig5",
         year %in% c(1998, 2008, 2018)) %>%
  select_if(~ n_distinct(.) > 1) |>
  spread(year, value) |>
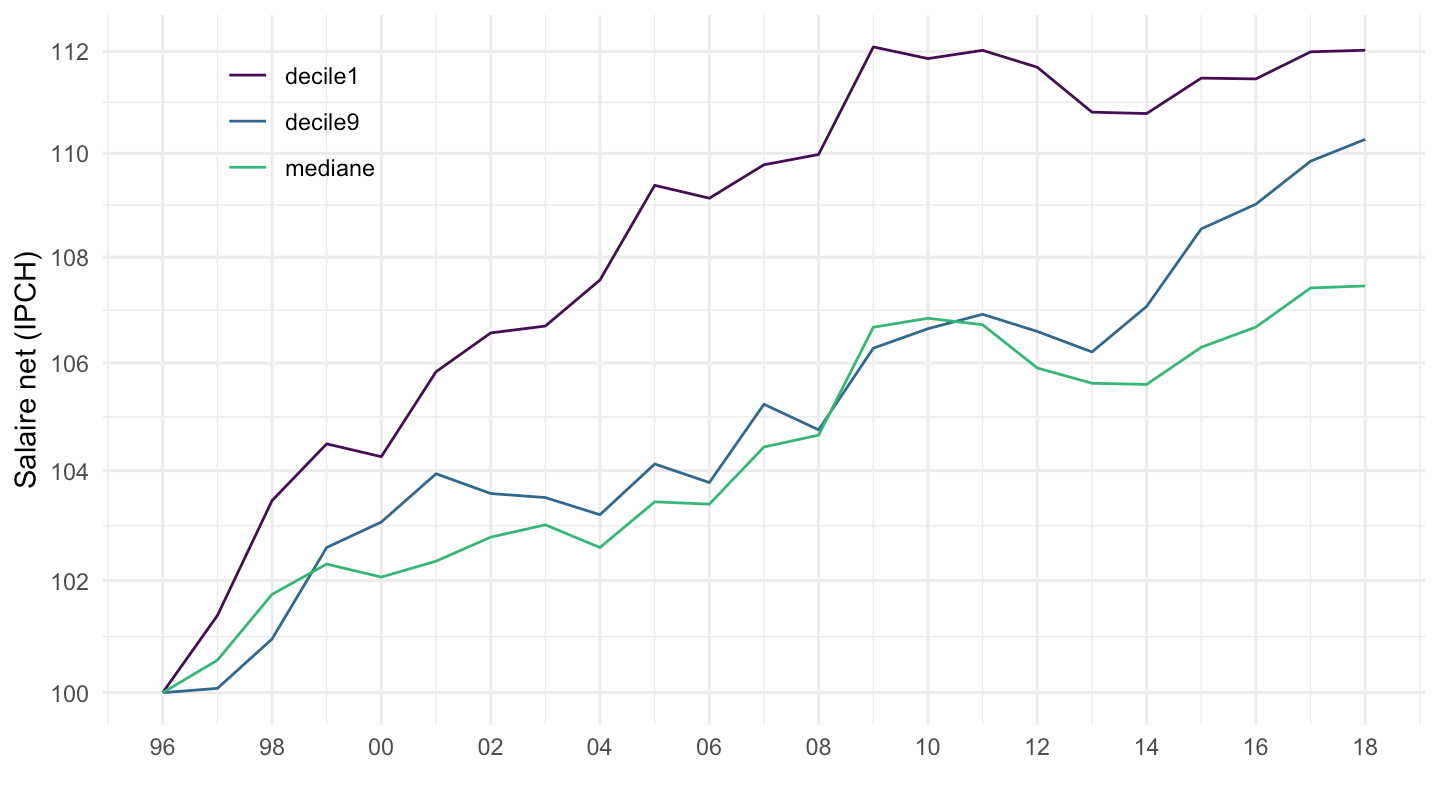
print_table_conditional()| variable | 1998 | 2008 | 2018 |
|---|---|---|---|
| decile1 | 103.5 | 111.6 | 115.2 |
| decile9 | 101.0 | 106.3 | 113.4 |
| mediane | 101.8 | 106.2 | 110.5 |
ip1828 |>
  filter(sheet == "fig5",
         variable %in% c("decile1", "mediane", "decile9")) |>
  group_by(variable) |>
  mutate(value = 100*value/value[date == as.Date("1996-01-01")]) |>
  ggplot() + ylab("Salaire net") + xlab("") + theme_minimal() +
  geom_line(aes(x = date, y = value, color = variable)) +
  scale_color_manual(values = viridis(4)[1:3]) +
  scale_x_date(breaks = seq(1920, 2100, 2) |> paste0("-01-01") |> as.Date(),
               labels = date_format("%Y")) +
  theme(legend.position = c(0.15, 0.85),
        legend.title = element_blank()) +
  scale_y_log10(breaks = seq(10, 300, 2),
                     labels = dollar_format(accuracy = 1, prefix = ""))
IPC_IPCH_adjustment <- `IPCH-IPC-2015-ensemble` |>
  group_by(date) |>
  summarise(OBS_VALUE = 100*OBS_VALUE[INDICATEUR == "IPCH"]/OBS_VALUE[INDICATEUR == "IPC"]) |>
  filter(month(date) == 1,
         date <= as.Date("2019-01-01")) |>
  select(date, IPC_IPCH_adjustment = OBS_VALUE)

ip1828 |>
  filter(sheet == "fig5",
         variable %in% c("decile1", "mediane", "decile9")) |>
  group_by(variable) |>
  mutate(value = 100*value/value[date == as.Date("1996-01-01")]) |>
  left_join(IPC_IPCH_adjustment, by = "date") |>
  ggplot() + ylab("Salaire net (IPCH)") + xlab("") + theme_minimal() +
  geom_line(aes(x = date, y = 100*value/IPC_IPCH_adjustment, color = variable)) +
  scale_color_manual(values = viridis(4)[1:3]) +
  scale_x_date(breaks = seq(1920, 2100, 2) |> paste0("-01-01") |> as.Date(),
               labels = date_format("%Y")) +
  theme(legend.position = c(0.15, 0.85),
        legend.title = element_blank()) +
  scale_y_log10(breaks = seq(10, 300, 2),
                     labels = dollar_format(accuracy = 1, prefix = ""))