Last data update: 30 sept. 2026, 20:22
Last compile: 20 oct. 2026, 02:21
fig1 |>
  filter(zone == "France hors Mayotte", categorie != "Ensemble",
         indicateur %in% c("logements_1982", "logements_2026")) |>
  mutate(annee = recode(indicateur, logements_1982 = "1982", logements_2026 = "2026"),
         categorie = fct_relevel(categorie, names(categories_couleurs))) |>
  ggplot(aes(x = annee, y = valeur / 1000, fill = categorie)) +
  geom_col(position = "stack") +
  scale_fill_manual(values = categories_couleurs, name = NULL) +
  theme_minimal(base_size = 11) +
  labs(x = NULL, y = "Millions de logements",
       title = "Parc de logements",
       subtitle = "France hors Mayotte, 1982 vs. 2026") +
  theme(legend.position = "bottom", panel.grid.minor = element_blank()) +
  guides(fill = guide_legend(ncol = 1))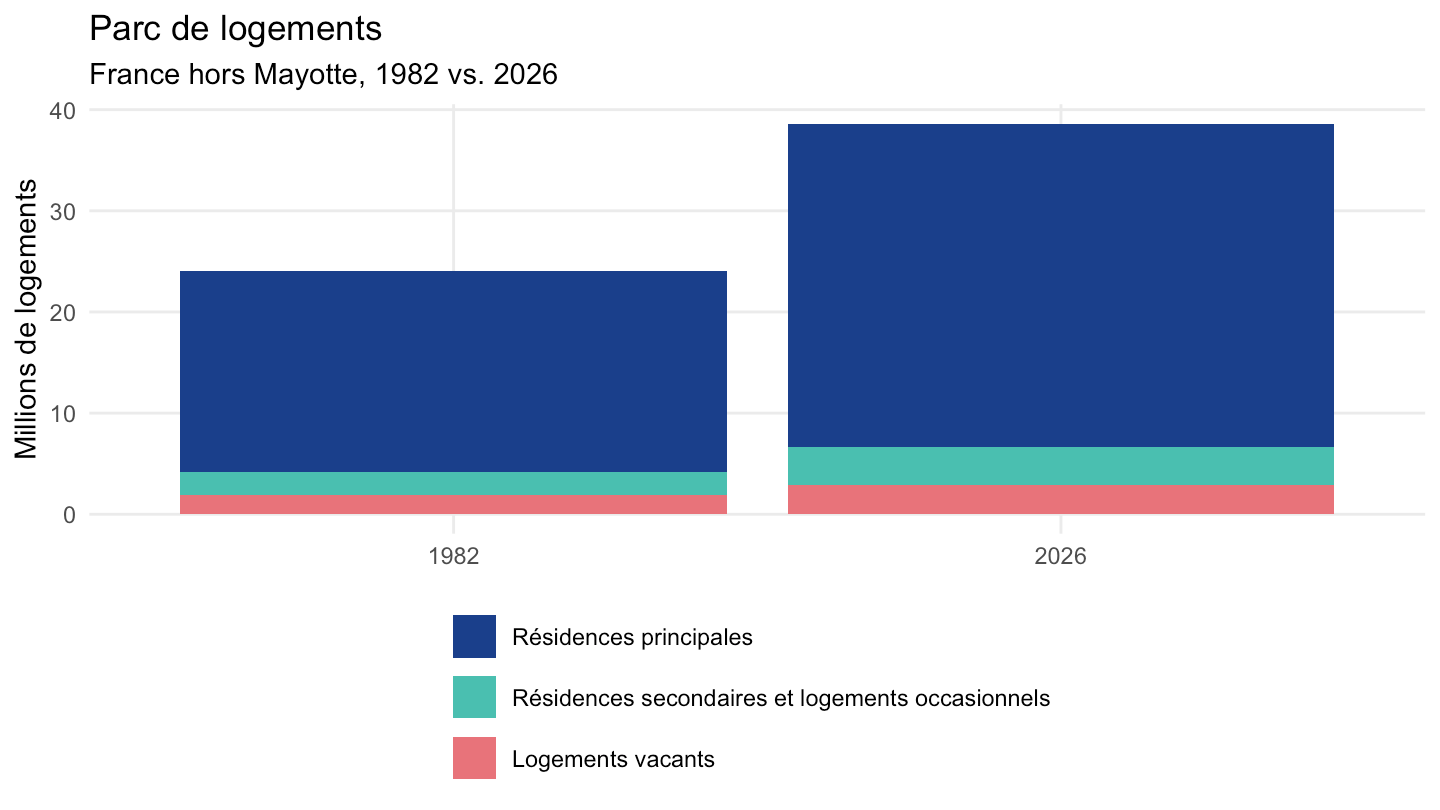
fig2 |>
  ggplot(aes(x = annee, y = valeur, color = indicateur)) +
  geom_line(linewidth = 1) +
  scale_color_brewer(palette = "Set1", name = NULL) +
  theme_minimal(base_size = 9) +
  labs(x = NULL, y = "Base 100 en 1982",
       title = "Évolution du nombre de logements et de la population",
       subtitle = "France hors Mayotte, depuis 1982") +
  theme(legend.position = "bottom", panel.grid.minor = element_blank()) +
  guides(color = guide_legend(ncol = 2))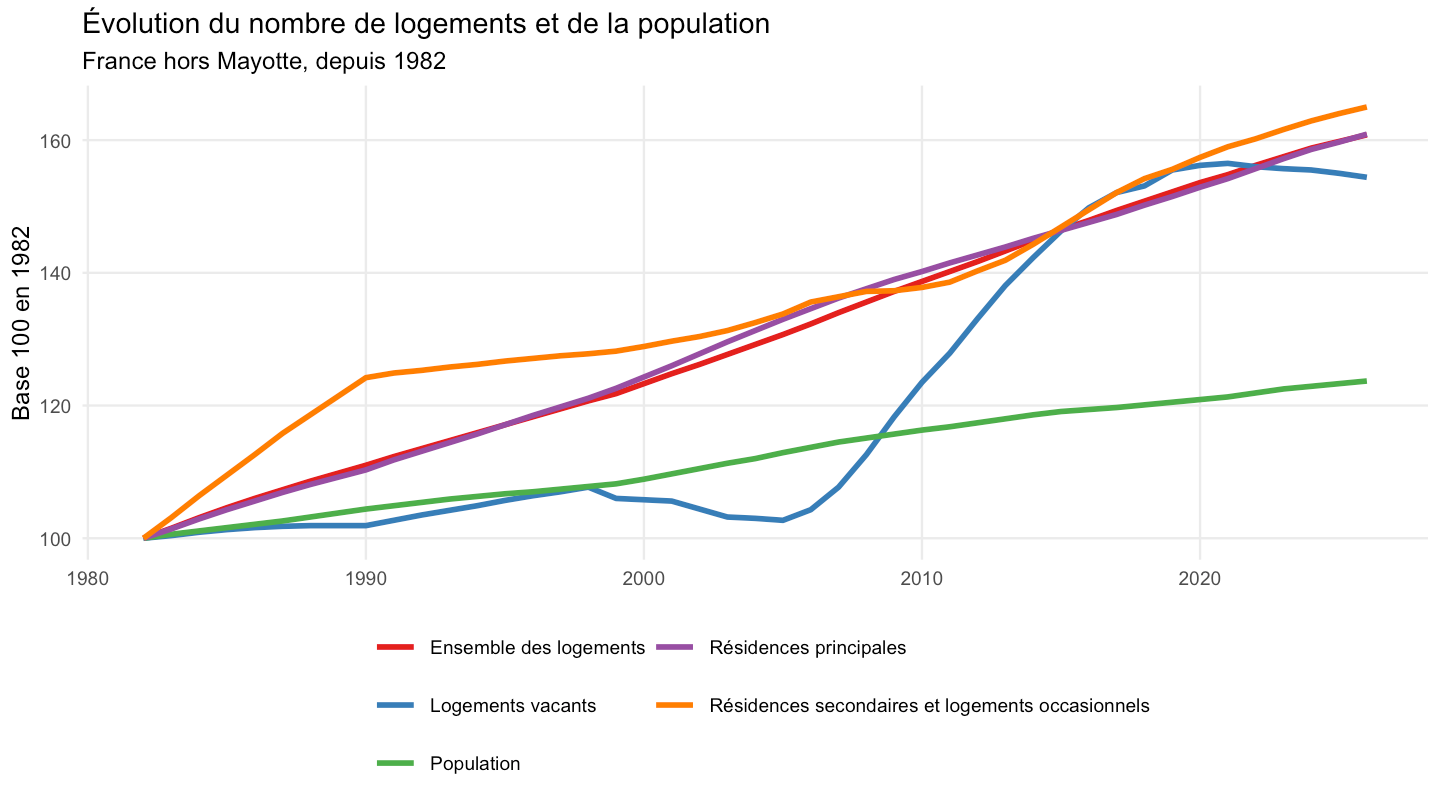
fig3 |>
  mutate(categorie = fct_relevel(categorie, names(categories_couleurs))) |>
  ggplot(aes(x = annee, y = valeur / 100, fill = categorie)) +
  geom_area(position = "stack") +
  scale_y_continuous(labels = scales::percent_format(accuracy = 1)) +
  scale_fill_manual(values = categories_couleurs, name = NULL) +
  theme_minimal(base_size = 10) +
  labs(x = NULL, y = NULL,
       title = "Répartition du parc de logements",
       subtitle = "par catégorie, depuis 1982") +
  theme(legend.position = "bottom", panel.grid.minor = element_blank()) +
  guides(fill = guide_legend(ncol = 1))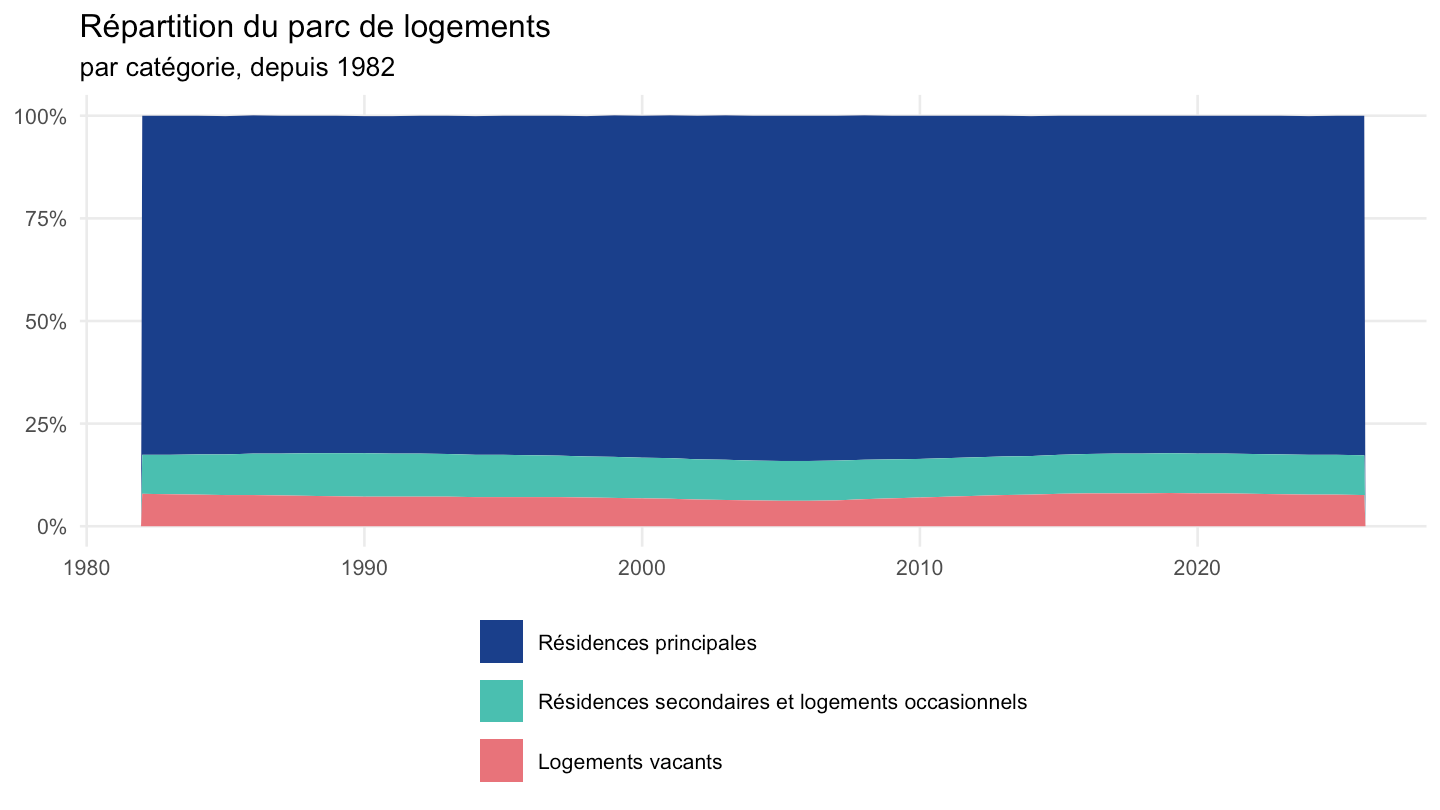
fig4 |>
  ggplot(aes(x = annee, y = valeur / 100, color = categorie)) +
  geom_line(linewidth = 1) +
  scale_y_continuous(labels = scales::percent_format(accuracy = 1)) +
  scale_color_brewer(palette = "Set2", name = NULL) +
  theme_minimal(base_size = 9) +
  labs(x = NULL, y = NULL,
       title = "Part de l'habitat individuel",
       subtitle = "par catégorie de logement, depuis 1982") +
  theme(legend.position = "bottom", panel.grid.minor = element_blank()) +
  guides(color = guide_legend(ncol = 1))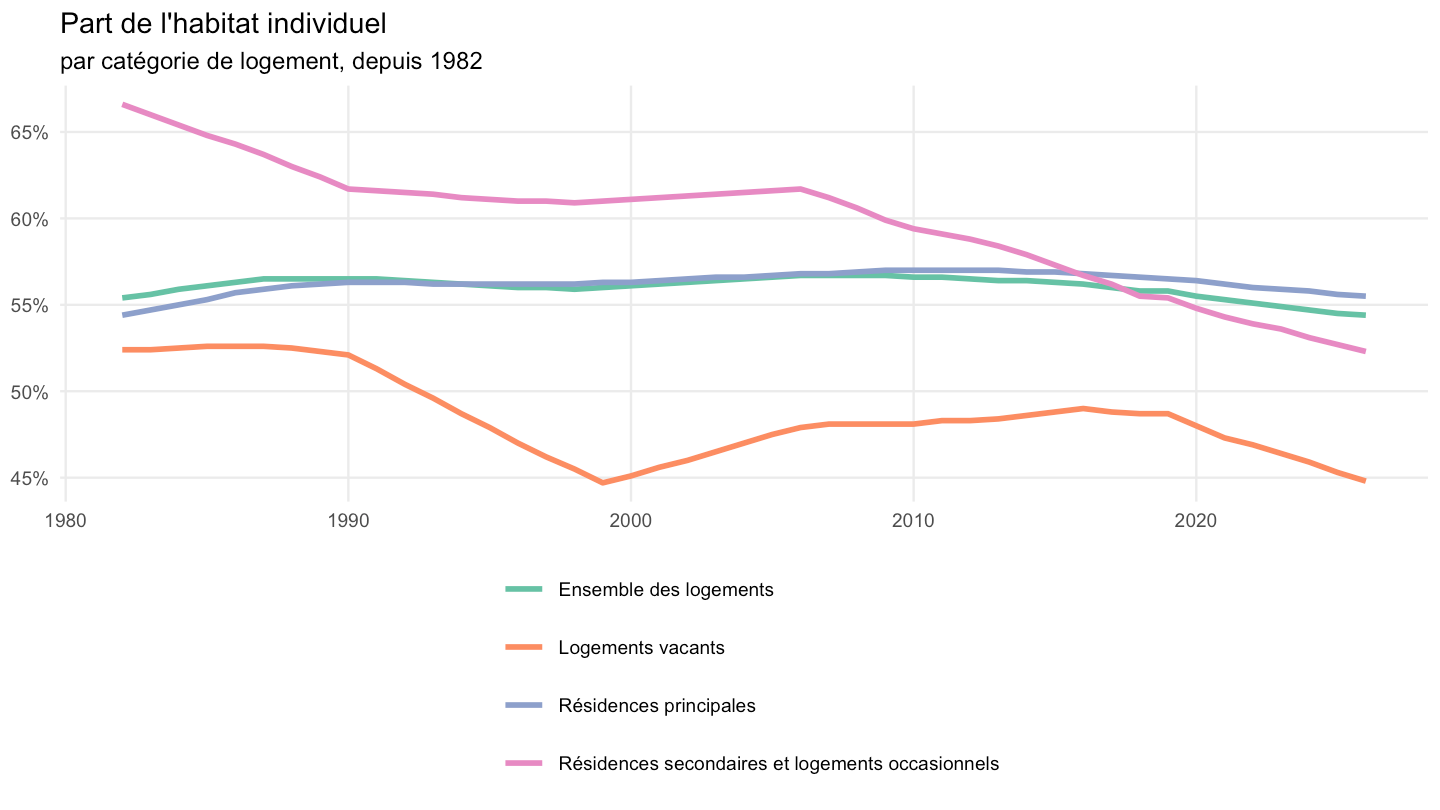
fig5 |>
  filter(statut %in% c("Ensemble des propriétaires", "Ensemble des locataires", "Logés gratuitement")) |>
  ggplot(aes(x = annee, y = valeur / 100, fill = statut)) +
  geom_area(position = "stack") +
  scale_y_continuous(labels = scales::percent_format(accuracy = 1)) +
  scale_fill_brewer(palette = "Set2", name = NULL) +
  theme_minimal(base_size = 10) +
  labs(x = NULL, y = NULL,
       title = "Statut d'occupation des résidences principales",
       subtitle = "depuis 1982") +
  theme(legend.position = "bottom", panel.grid.minor = element_blank())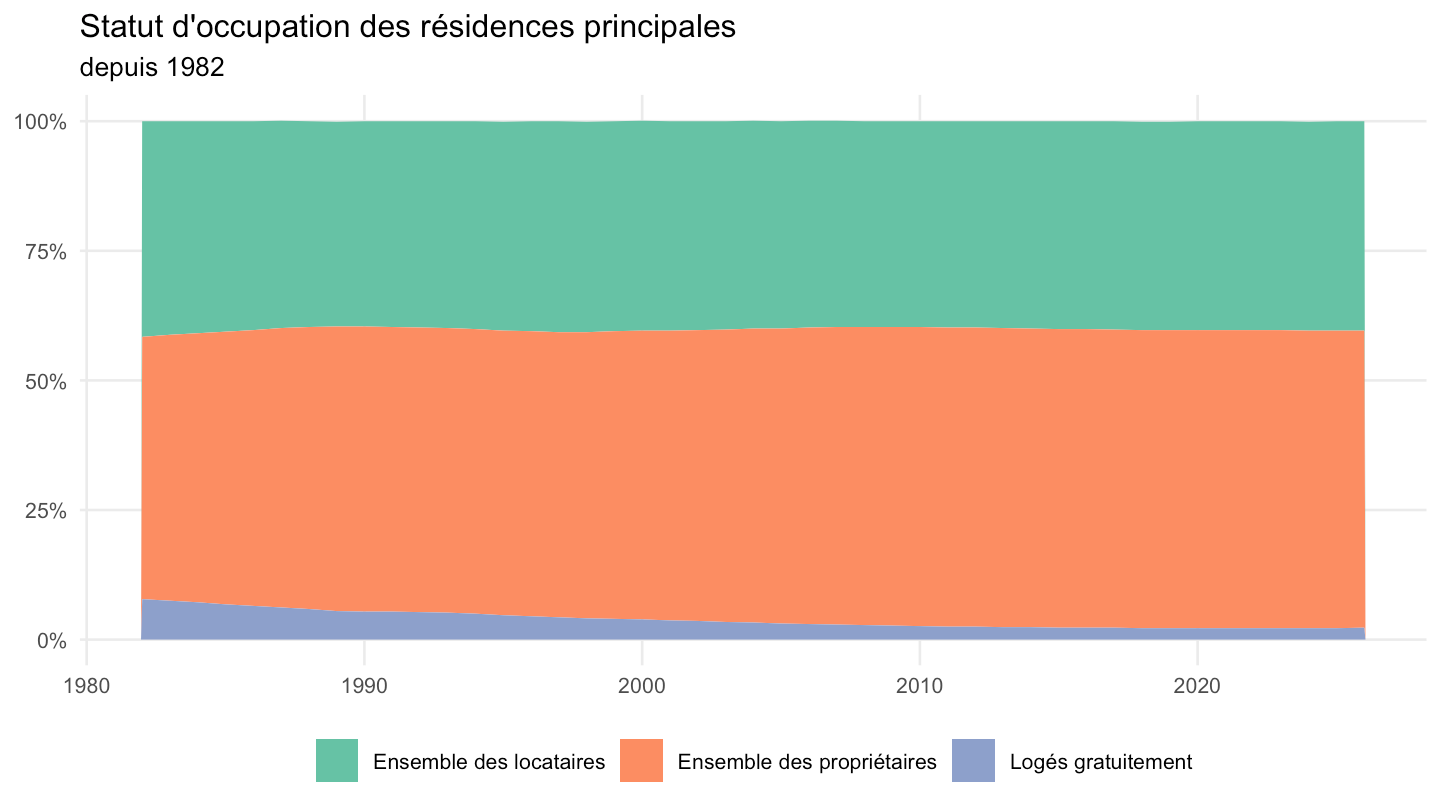
fig5 |>
  filter(statut %in% c("Propriétaires sans charge de remboursement", "Accédants à la propriété",
                        "Bailleurs publics", "Bailleurs privés")) |>
  ggplot(aes(x = annee, y = valeur / 100, color = statut)) +
  geom_line(linewidth = 1) +
  scale_y_continuous(labels = scales::percent_format(accuracy = 1)) +
  scale_color_brewer(palette = "Set1", name = NULL) +
  theme_minimal(base_size = 9) +
  labs(x = NULL, y = NULL,
       title = "Détail du statut d'occupation des résidences principales",
       subtitle = "depuis 1982") +
  theme(legend.position = "bottom", panel.grid.minor = element_blank()) +
  guides(color = guide_legend(ncol = 1))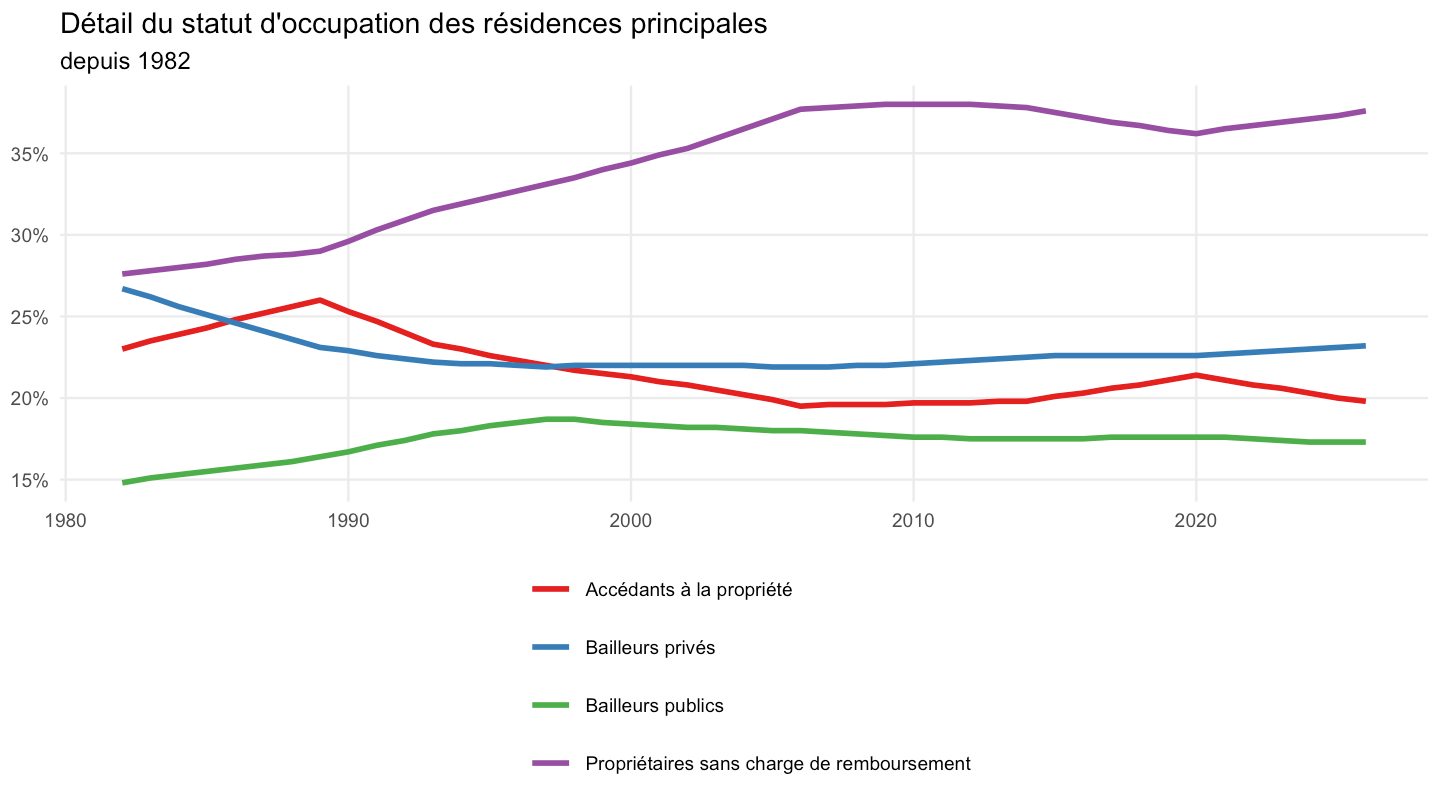
taille_ordre <- c("Unité urbaine de Paris", "Unités urbaines de 100 000 habitants ou plus (hors Paris)",
                   "Unités urbaines de moins de 100 000 habitants", "Communes hors unité urbaine",
                   "Ensemble des communes")
fig6 |>
  mutate(taille_uu = fct_relevel(taille_uu, taille_ordre),
         categorie = fct_relevel(categorie, names(categories_couleurs))) |>
  ggplot(aes(x = taille_uu, y = valeur / 100, fill = categorie)) +
  geom_col(position = "stack") +
  coord_flip() +
  scale_y_continuous(labels = scales::percent_format(accuracy = 1)) +
  scale_fill_manual(values = categories_couleurs, name = NULL) +
  theme_minimal(base_size = 9) +
  labs(x = NULL, y = NULL,
       title = "Répartition des logements par catégorie",
       subtitle = "selon la taille de l'unité urbaine, au 1er janvier 2026") +
  theme(legend.position = "bottom", panel.grid.minor = element_blank()) +
  guides(fill = guide_legend(ncol = 1))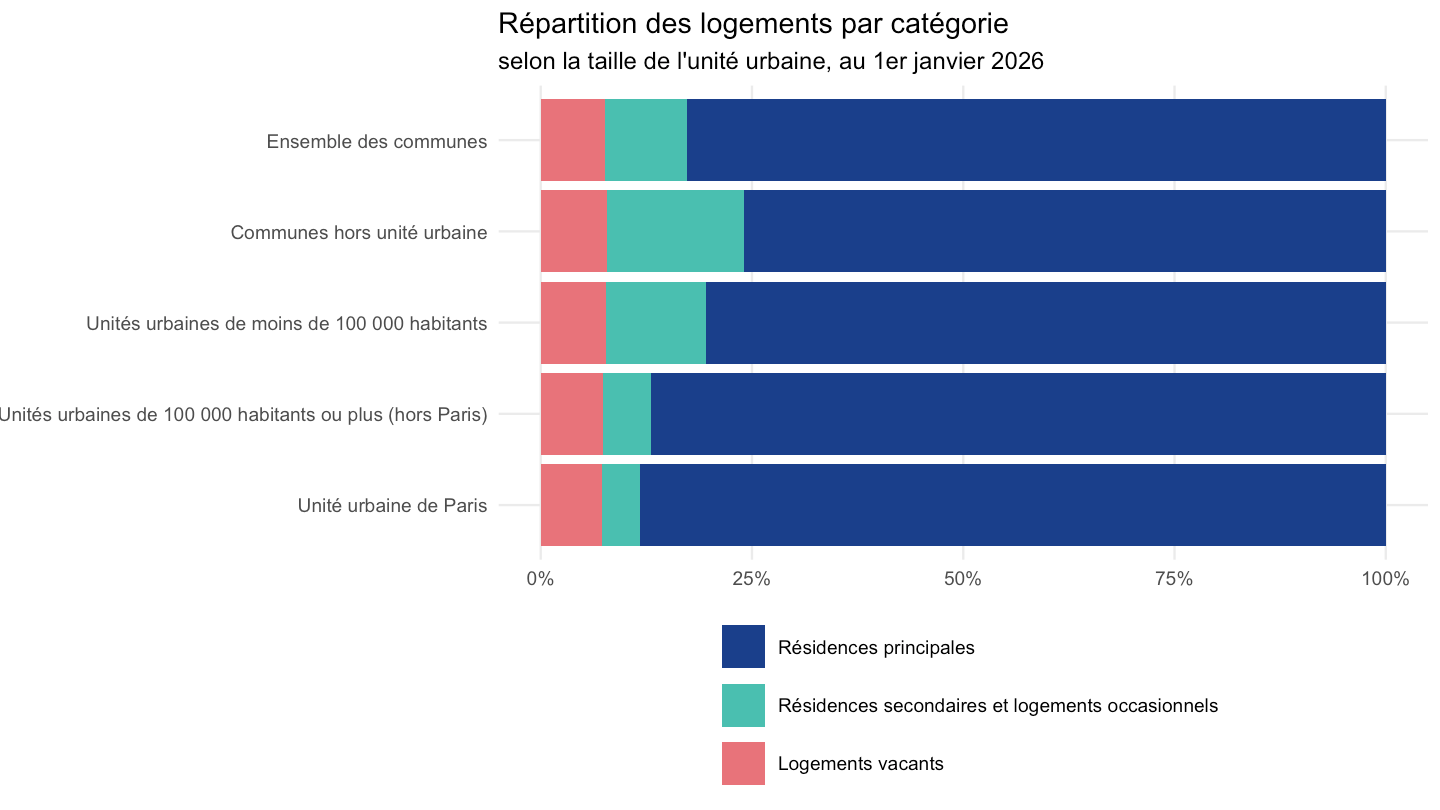
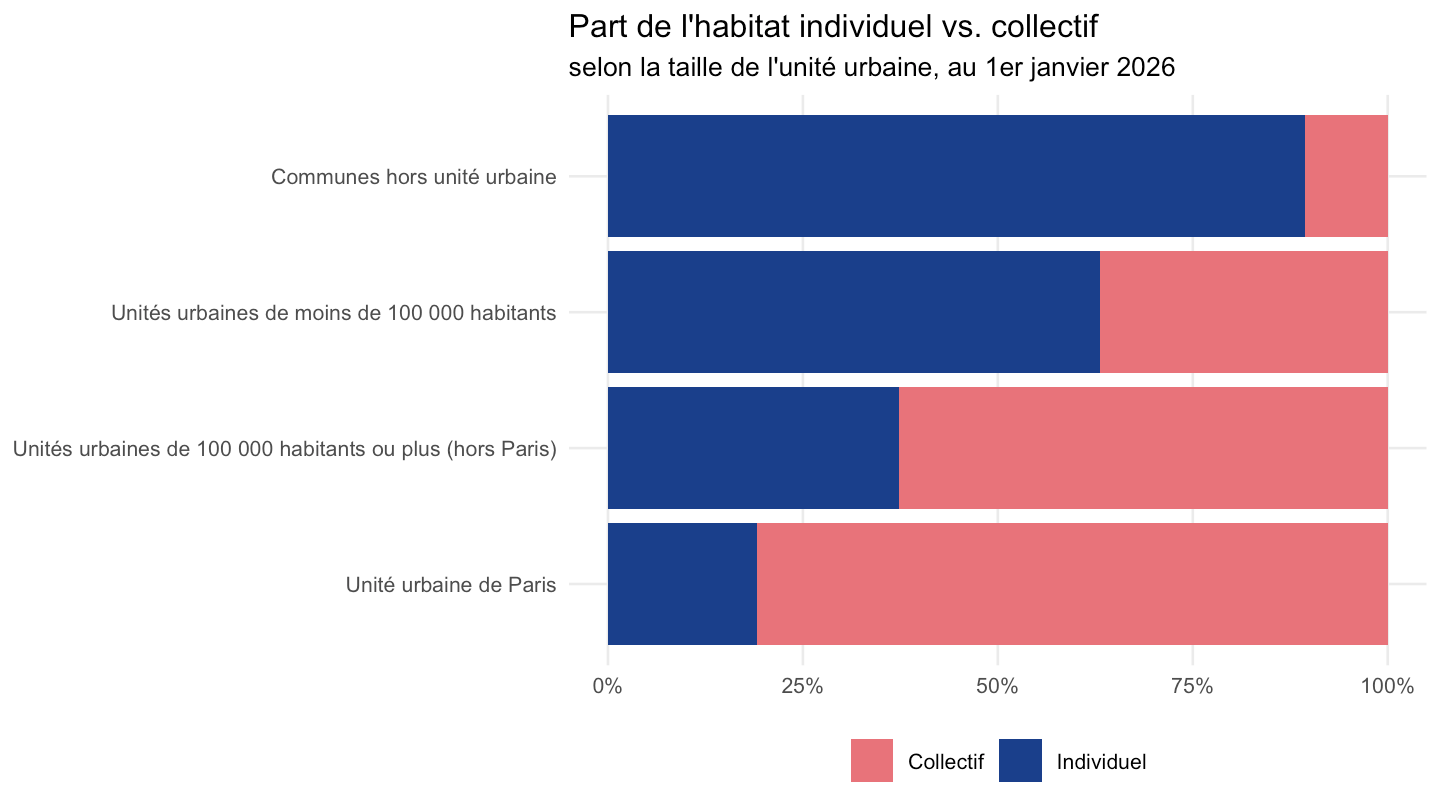
tc |>
  filter(taille_uu != "Ensemble des communes", type_habitat != "Ensemble",
         categorie == "ensemble_logements") |>
  mutate(taille_uu = fct_relevel(taille_uu, taille_ordre)) |>
  ggplot(aes(x = taille_uu, y = valeur / 1000, fill = type_habitat)) +
  geom_col(position = "fill") +
  coord_flip() +
  scale_y_continuous(labels = scales::percent_format(accuracy = 1)) +
  scale_fill_manual(values = c("Individuel" = "#1B3F8B", "Collectif" = "#E8737A"), name = NULL) +
  theme_minimal(base_size = 10) +
  labs(x = NULL, y = NULL,
       title = "Part de l'habitat individuel vs. collectif",
       subtitle = "selon la taille de l'unité urbaine, au 1er janvier 2026") +
  theme(legend.position = "bottom", panel.grid.minor = element_blank())