Code
depts2016 %>%
{if (is_html_output()) datatable(., filter = 'top', rownames = F) else .}Données - INSEE
depts2016 %>%
{if (is_html_output()) datatable(., filter = 'top', rownames = F) else .}i_g("bib/france/dept-reg-2014.png")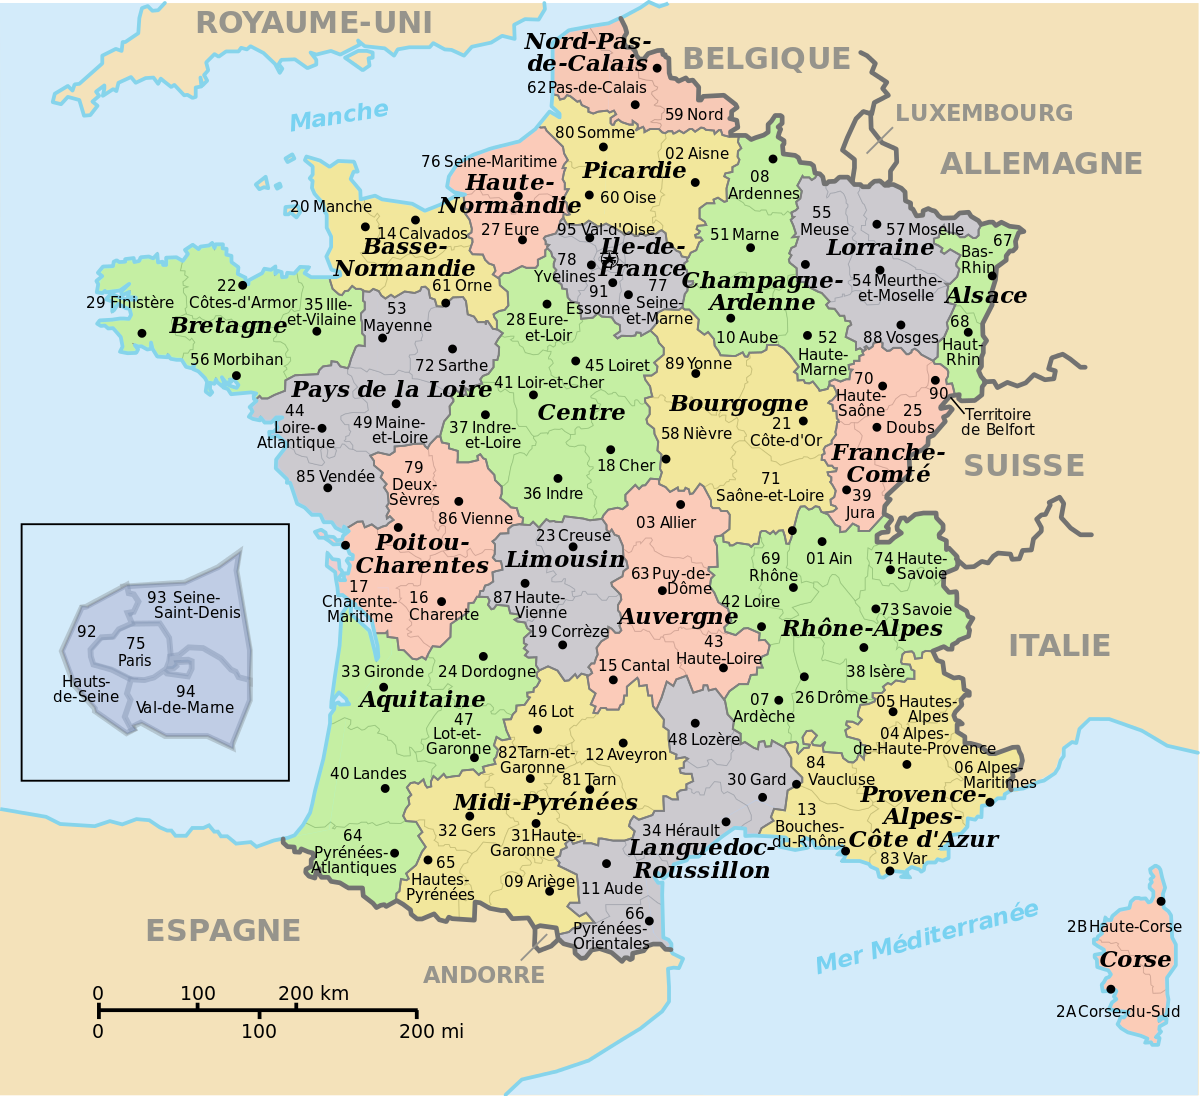
i_g("bib/france/dept-reg-2016.png")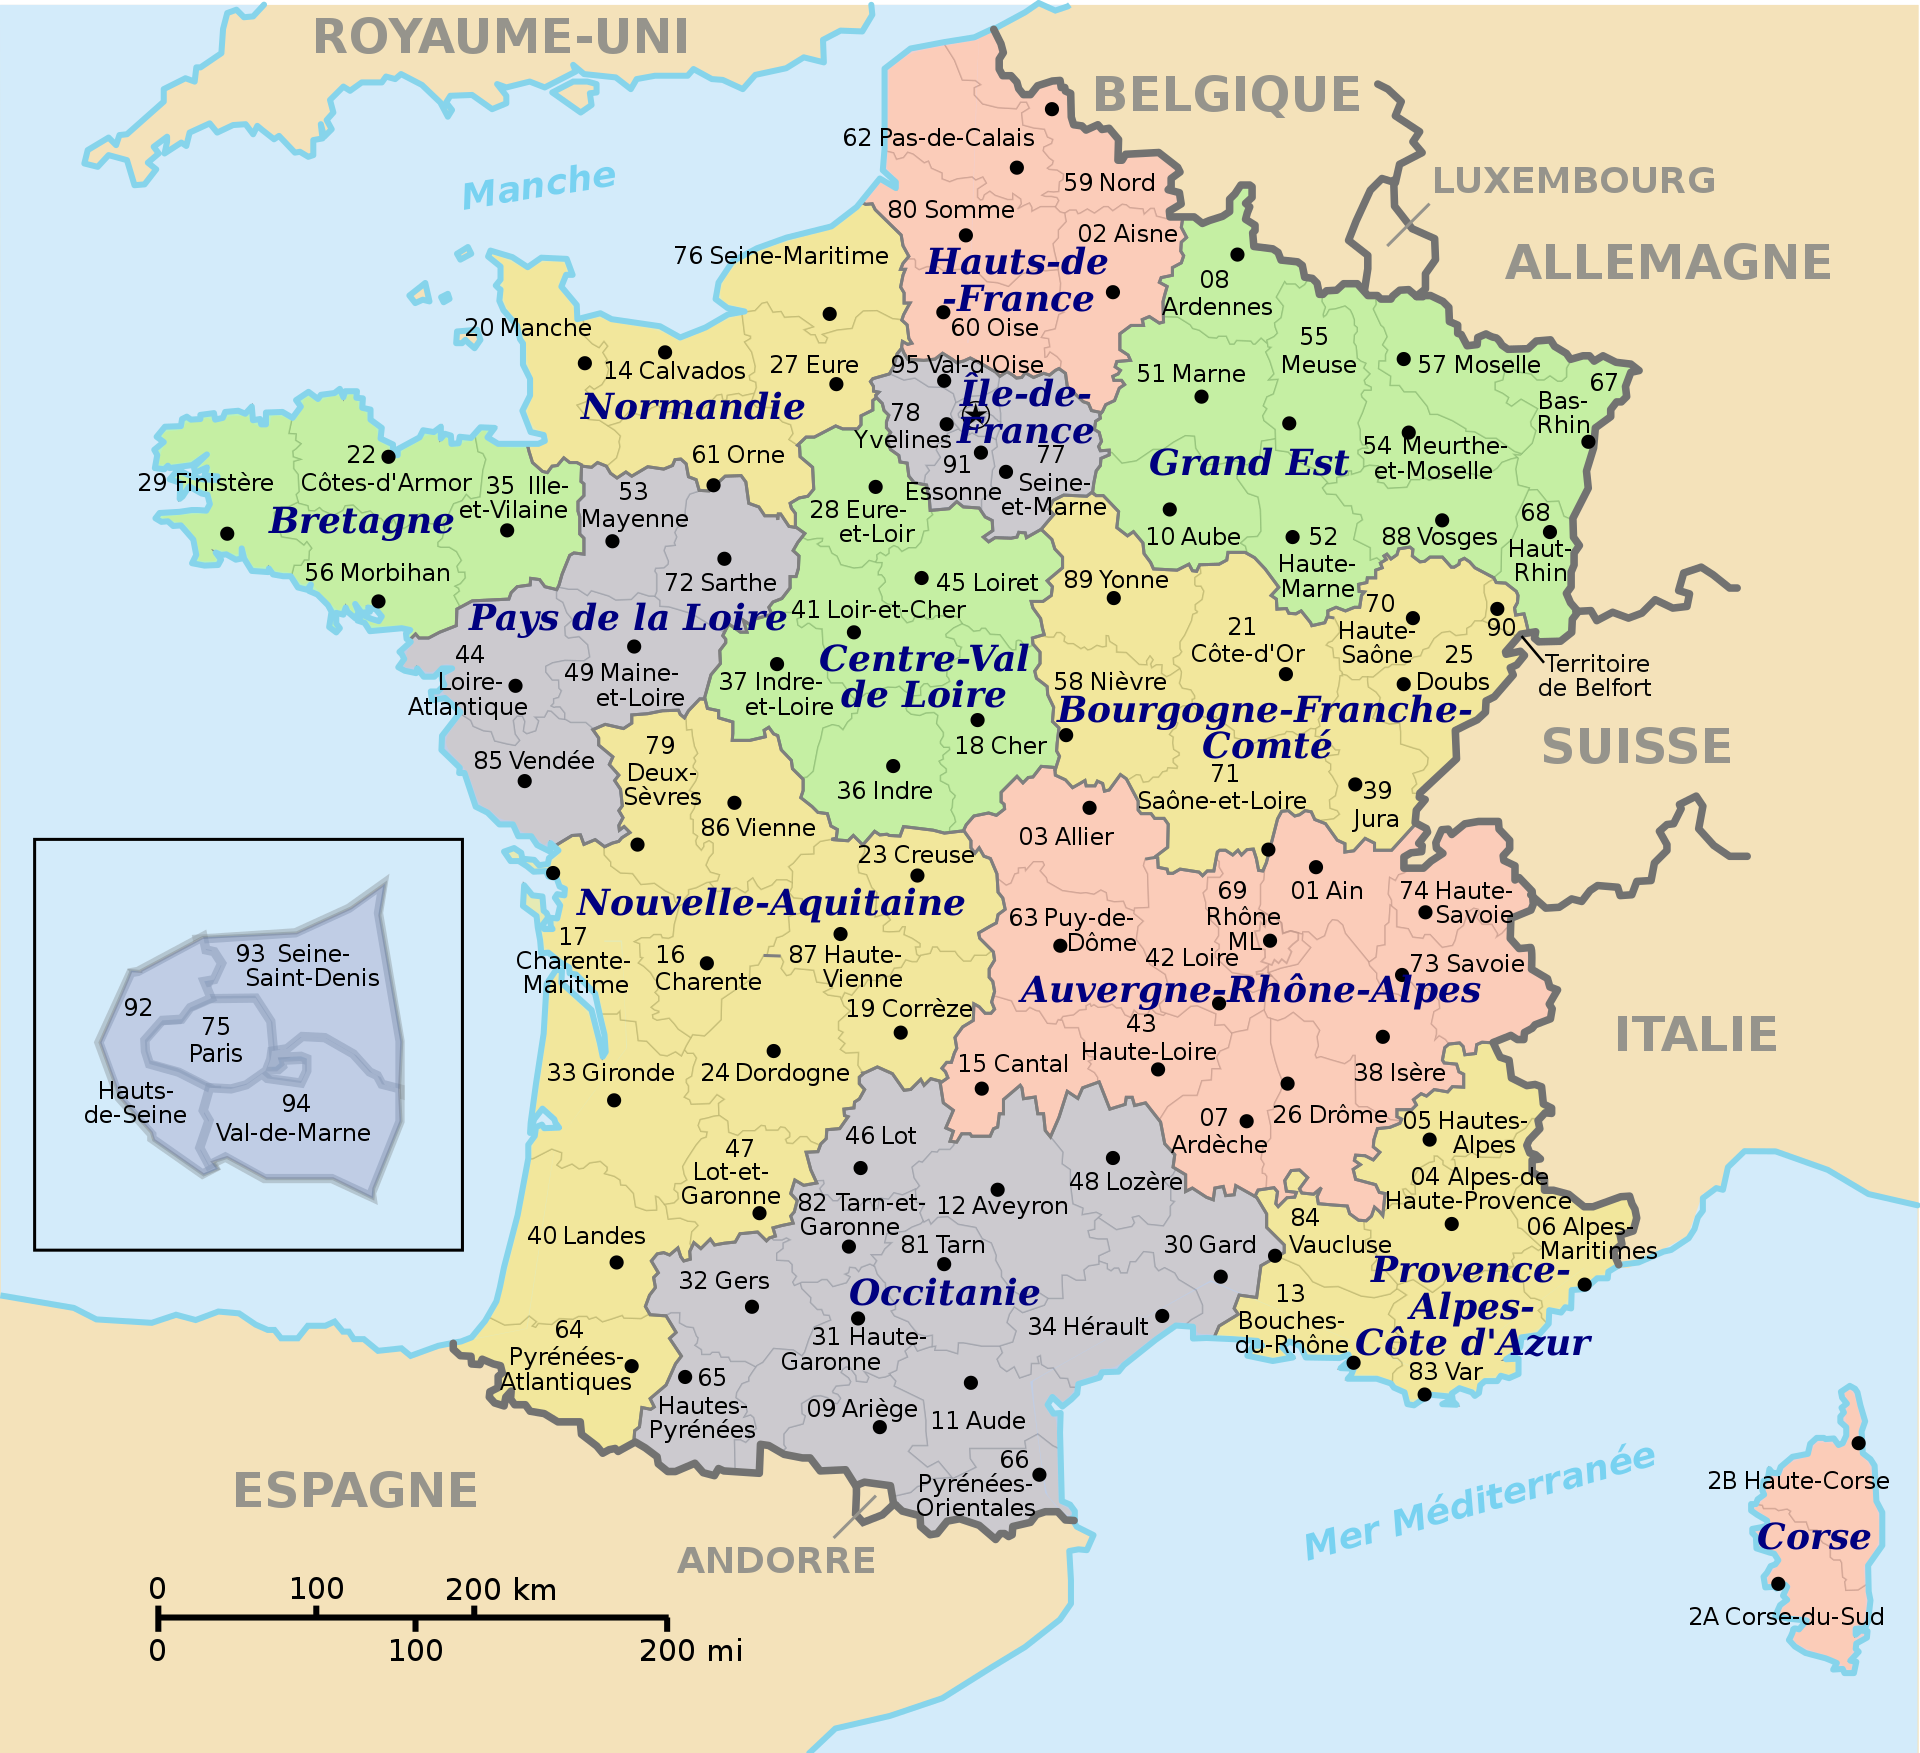
i_g("bib/france/carte-vidal-lablache-4-france-departements-reproduction-ancienne-carte-scolaire.jpg")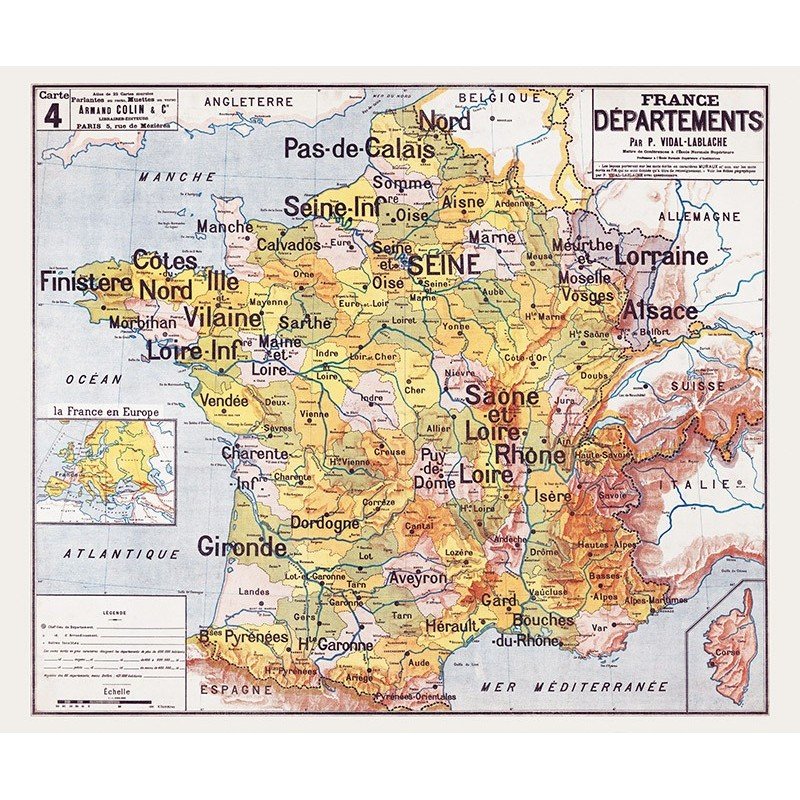
i_g("bib/france/carte-vidal-lablache-5-france-villes-reproduction-ancienne-carte-scolaire.jpg")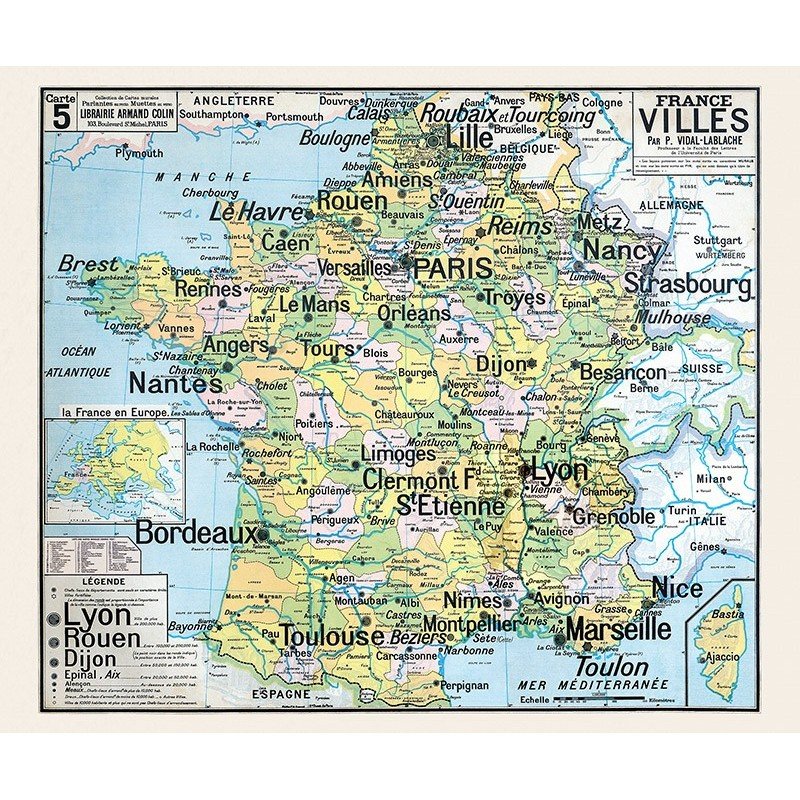
presidentielles_2017_T1 %>%
  group_by(depts_code, name) %>%
  summarise(count = sum(count)) %>%
  group_by(depts_code) %>%
  mutate(TOTAL = sum(count)) %>%
  spread(name, count) %>%
  mutate(pourcentage_macron = MACRON/TOTAL) %>%
  ungroup %>%
  rename(CODE_DEPT = depts_code) %>%
  left_join(departements_details, by = "CODE_DEPT") %>%
  left_join(departements, by = "CODE_DEPT") %>%
  ggplot(.) + aes(long, lat, group = group, fill = pourcentage_macron) +
  coord_equal() + theme_void() + geom_polygon() +
  geom_text(aes(X_CENTROID, Y_CENTROID, label = NOM_DEPT), size = 3) +
  scale_fill_viridis_c(na.value = "white",
                       name = "Macron T1",
                       breaks = 0.01*seq(0, 50, 4),
                       labels = percent_format(accuracy = 1)) +
  labs(x = "", y = "", title = "") +
  theme(axis.text.x = element_blank(),
        axis.text.y = element_blank())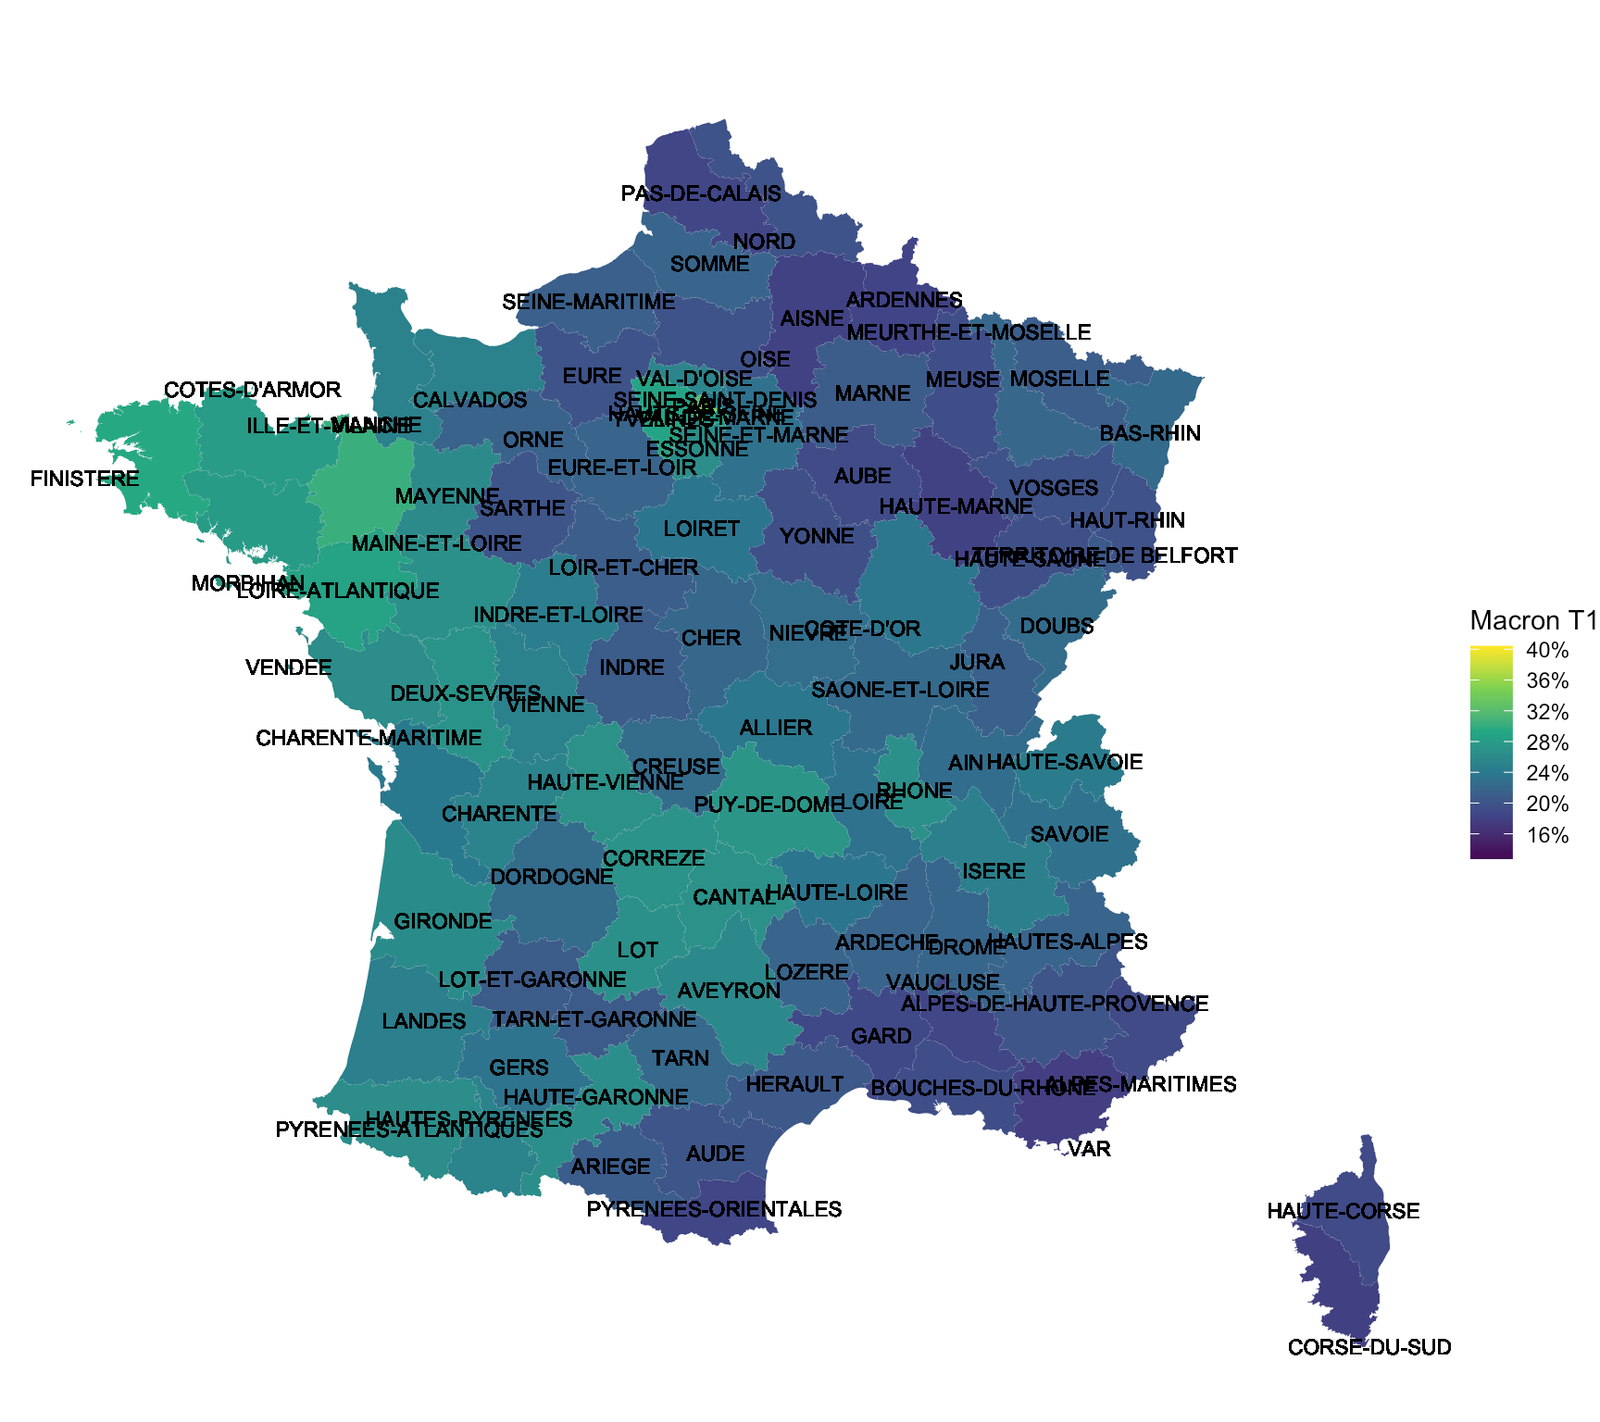
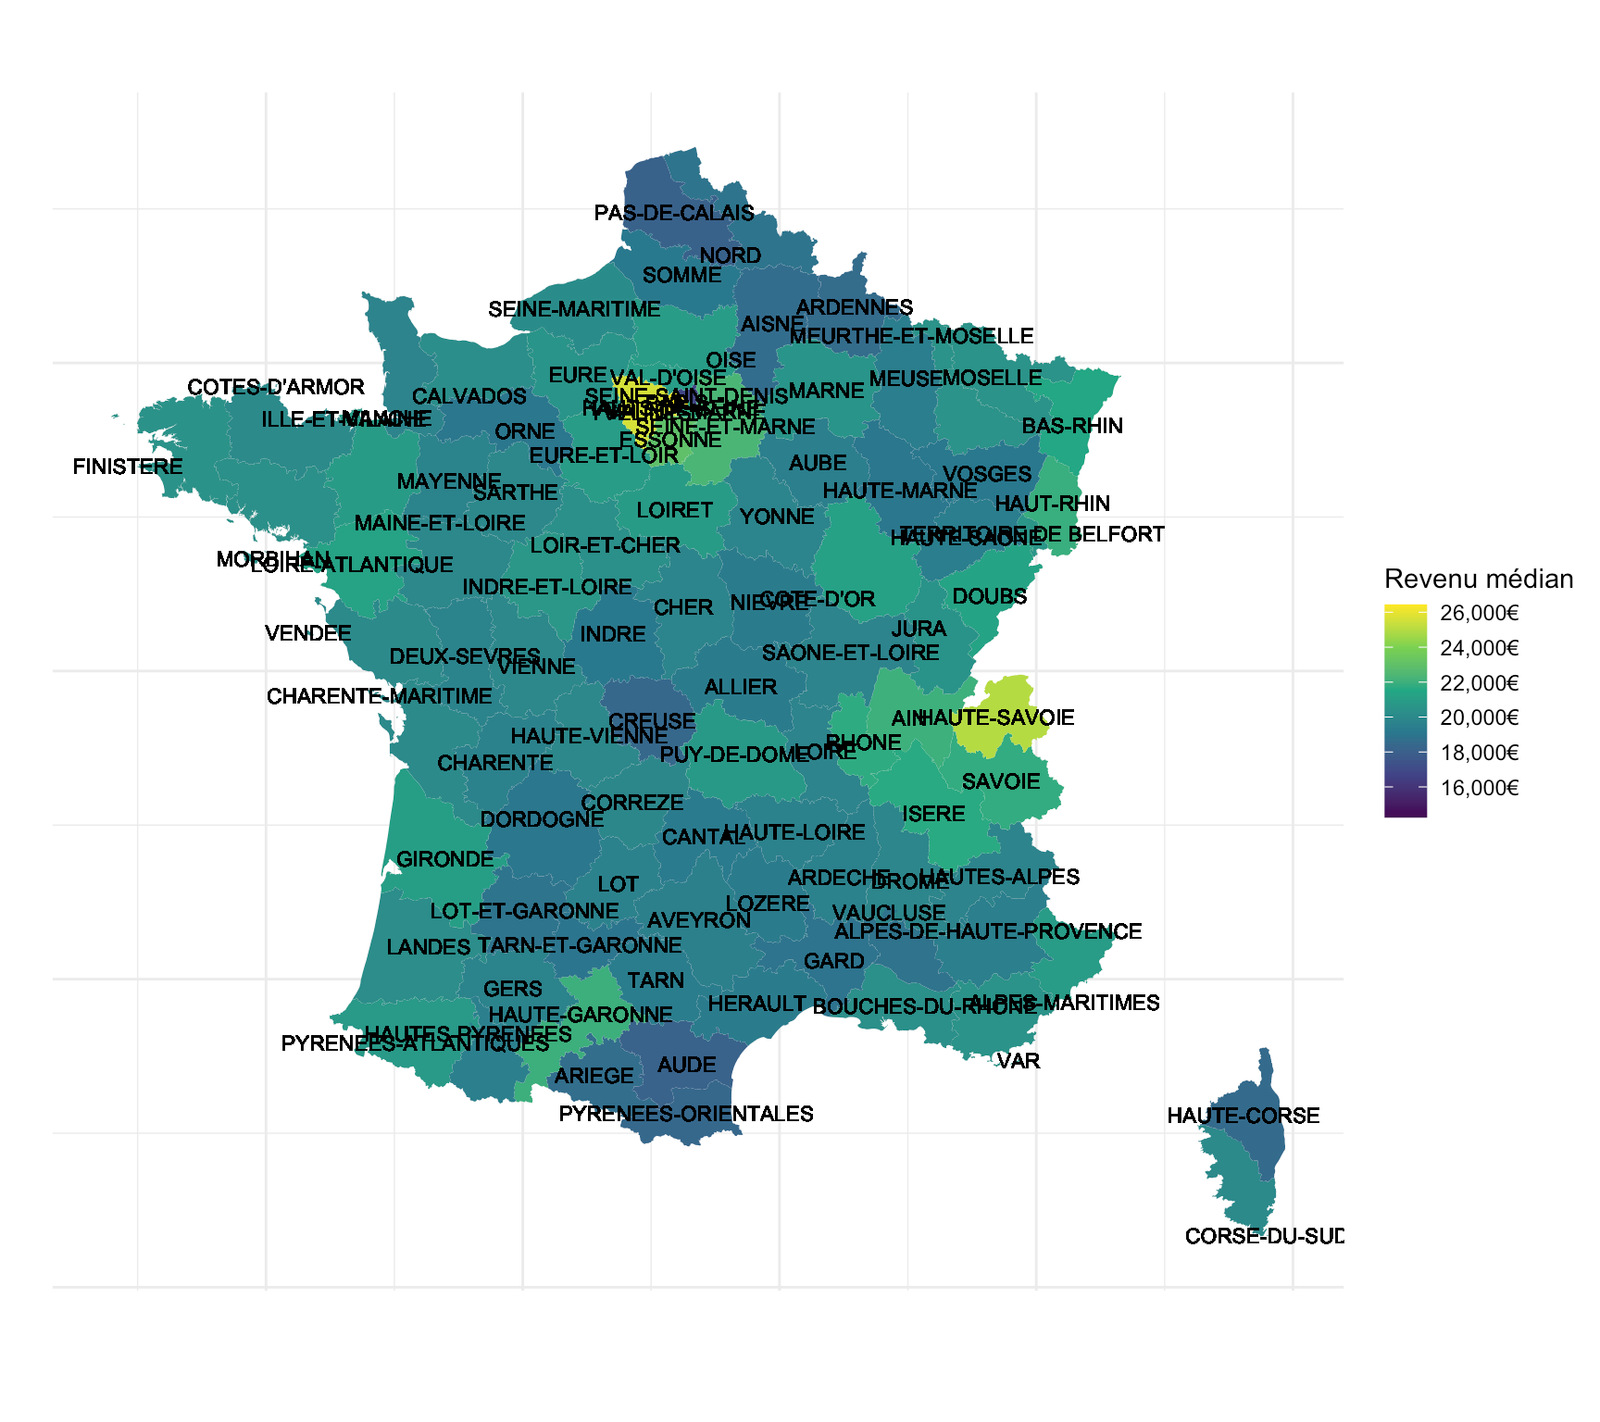
filosofi2015_DEP %>%
  filter(variable == "MED15") %>%
  rename(CODE_DEPT = CODGEO) %>%
  left_join(departements_details, by = "CODE_DEPT") %>%
  left_join(departements, by = "CODE_DEPT") %>%
  ggplot(.) + aes(long, lat, group = group, fill = value) +
  coord_equal() + theme_void() + geom_polygon() +
  geom_text(aes(X_CENTROID, Y_CENTROID, label = NOM_DEPT), size = 3) +
  scale_fill_viridis_c(na.value = "white",
                       breaks = 1000*seq(10, 30, 2),
                       labels = dollar_format(a = 1, p = "", su = "€"),
                       name = "Revenu médian") +
  labs(x = "", y = "") +
  theme_minimal() + theme(axis.text.x = element_blank(),
                          axis.text.y = element_blank())