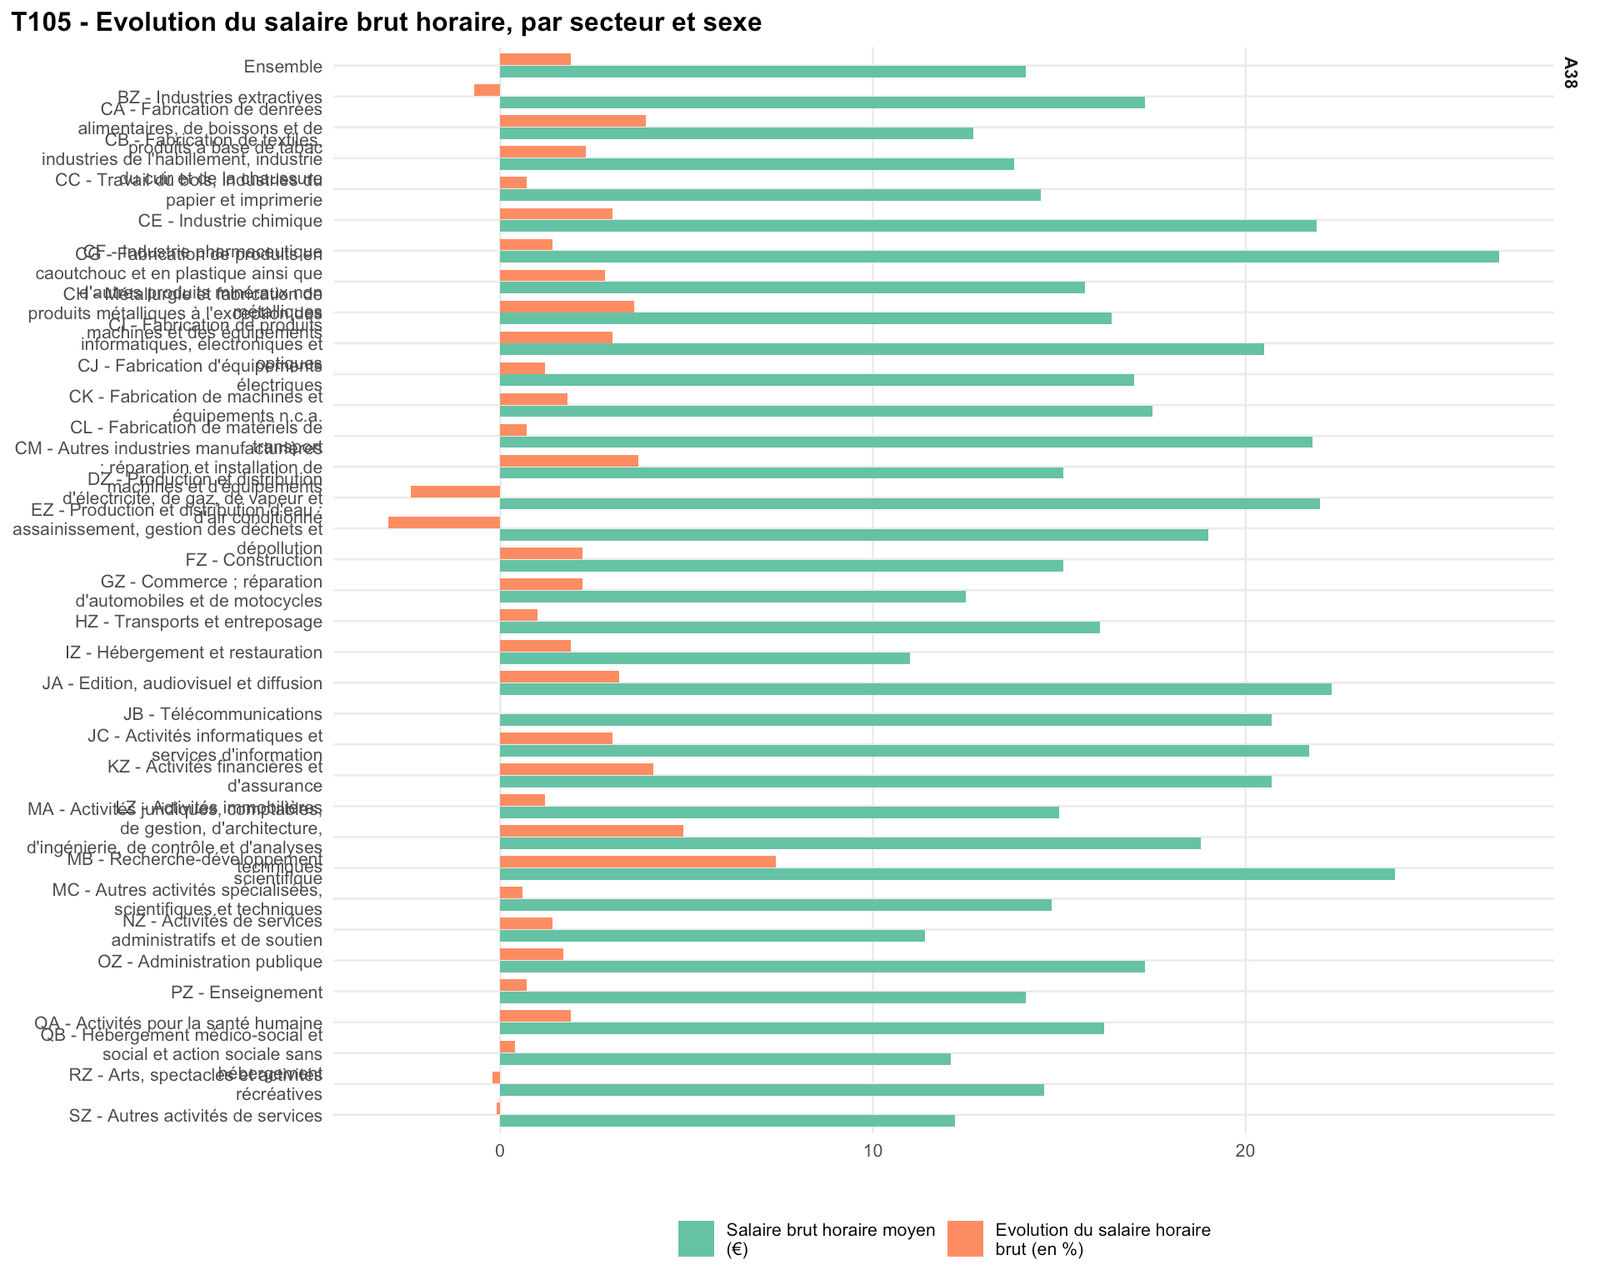
Last data update: 26 oct. 2026, 19:31
Last compile: 26 oct. 2026, 19:36
d1 |>
  filter(!is.na(valeur), !total100) |>
  mutate(lab = fct_inorder(libelle), serie = fct_inorder(serie)) |>
  ggplot(aes(x = valeur, y = fct_rev(lab), fill = serie)) +
  geom_col(position = position_dodge(width = 0.8), width = 0.75) +
  facet_grid(section ~ ., scales = "free_y", space = "free_y", labeller = labeller(section = scales::label_wrap(14))) +
  scale_y_discrete(labels = scales::label_wrap(40)) +
  scale_fill_brewer(palette = "Set2", name = NULL, labels = scales::label_wrap(30)) +
  theme_pub(10) +
  labs(x = "", y = NULL,
       title = str_wrap("T105 - Evolution du salaire brut horaire, par secteur et sexe", 75)) +
  guides(fill = guide_legend(ncol = 2))
d2 |>
  filter(!is.na(valeur), !total100) |>
  mutate(lab = fct_inorder(libelle), serie = fct_inorder(serie)) |>
  ggplot(aes(x = valeur, y = fct_rev(lab), fill = serie)) +
  geom_col(position = position_dodge(width = 0.8), width = 0.75) +
  facet_grid(section ~ ., scales = "free_y", space = "free_y", labeller = labeller(section = scales::label_wrap(14))) +
  scale_y_discrete(labels = scales::label_wrap(40)) +
  scale_fill_brewer(palette = "Set2", name = NULL, labels = scales::label_wrap(30)) +
  theme_pub(10) +
  labs(x = "", y = NULL,
       title = str_wrap("T105 - Evolution du salaire brut horaire, par secteur et sexe", 75)) +
  guides(fill = guide_legend(ncol = 2))
d3 |>
  filter(!is.na(valeur), !total100) |>
  mutate(lab = fct_inorder(libelle), serie = fct_inorder(serie)) |>
  ggplot(aes(x = valeur, y = fct_rev(lab), fill = serie)) +
  geom_col(position = position_dodge(width = 0.8), width = 0.75) +
  facet_grid(section ~ ., scales = "free_y", space = "free_y", labeller = labeller(section = scales::label_wrap(14))) +
  scale_y_discrete(labels = scales::label_wrap(40)) +
  scale_fill_brewer(palette = "Set2", name = NULL, labels = scales::label_wrap(30)) +
  theme_pub(10) +
  labs(x = "", y = NULL,
       title = str_wrap("T105 - Evolution du salaire brut horaire, par secteur et sexe", 75)) +
  guides(fill = guide_legend(ncol = 2))
d4 |>
  filter(!is.na(valeur), !total100) |>
  mutate(lab = fct_inorder(libelle), serie = fct_inorder(serie)) |>
  ggplot(aes(x = valeur, y = fct_rev(lab), fill = serie)) +
  geom_col(position = position_dodge(width = 0.8), width = 0.75) +
  facet_grid(section ~ ., scales = "free_y", space = "free_y", labeller = labeller(section = scales::label_wrap(14))) +
  scale_y_discrete(labels = scales::label_wrap(40)) +
  scale_fill_brewer(palette = "Set2", name = NULL, labels = scales::label_wrap(30)) +
  theme_pub(10) +
  labs(x = "", y = NULL,
       title = str_wrap("T105 - Evolution du salaire brut horaire, par secteur et sexe", 75)) +
  guides(fill = guide_legend(ncol = 2))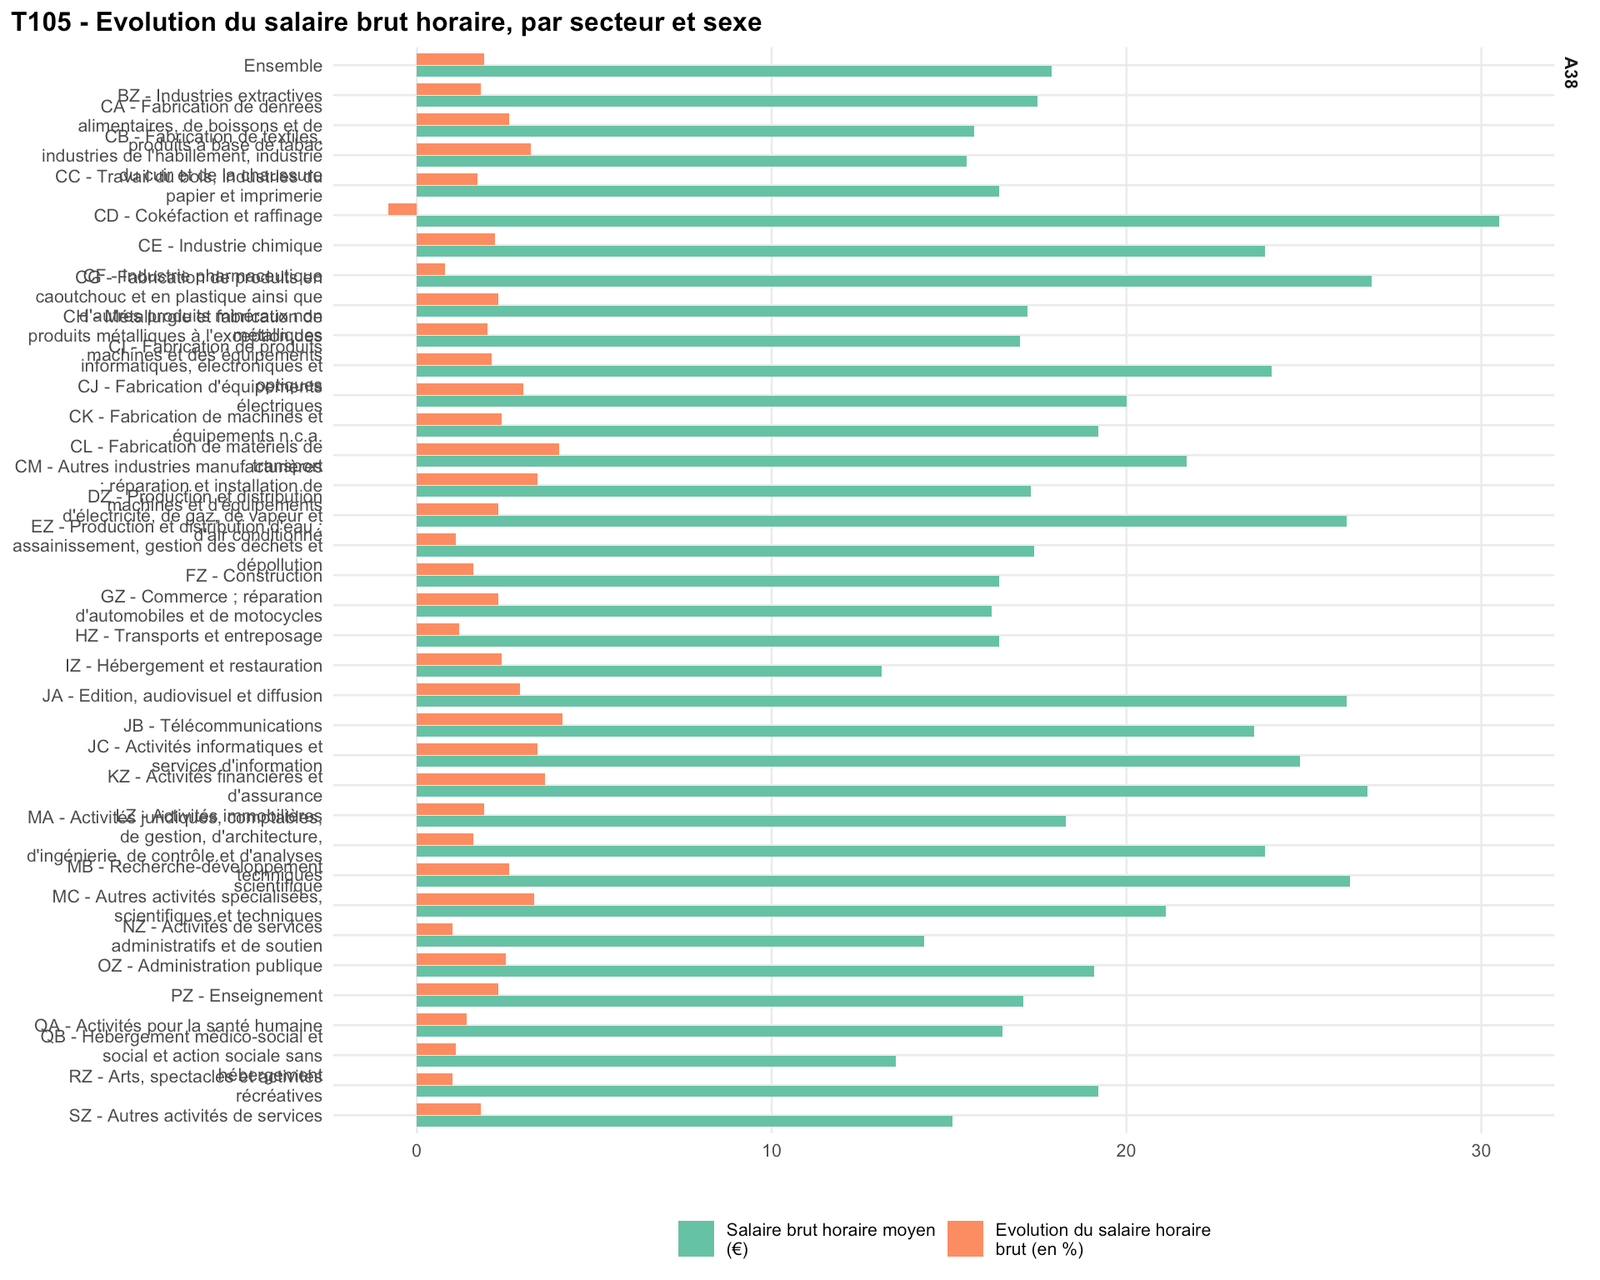
d5 |>
  filter(!is.na(valeur), !total100) |>
  mutate(lab = fct_inorder(libelle), serie = fct_inorder(serie)) |>
  ggplot(aes(x = valeur, y = fct_rev(lab), fill = serie)) +
  geom_col(position = position_dodge(width = 0.8), width = 0.75) +
  facet_grid(section ~ ., scales = "free_y", space = "free_y", labeller = labeller(section = scales::label_wrap(14))) +
  scale_y_discrete(labels = scales::label_wrap(40)) +
  scale_fill_brewer(palette = "Set2", name = NULL, labels = scales::label_wrap(30)) +
  theme_pub(10) +
  labs(x = "", y = NULL,
       title = str_wrap("T105 - Evolution du salaire brut horaire, par secteur et sexe", 75)) +
  guides(fill = guide_legend(ncol = 2))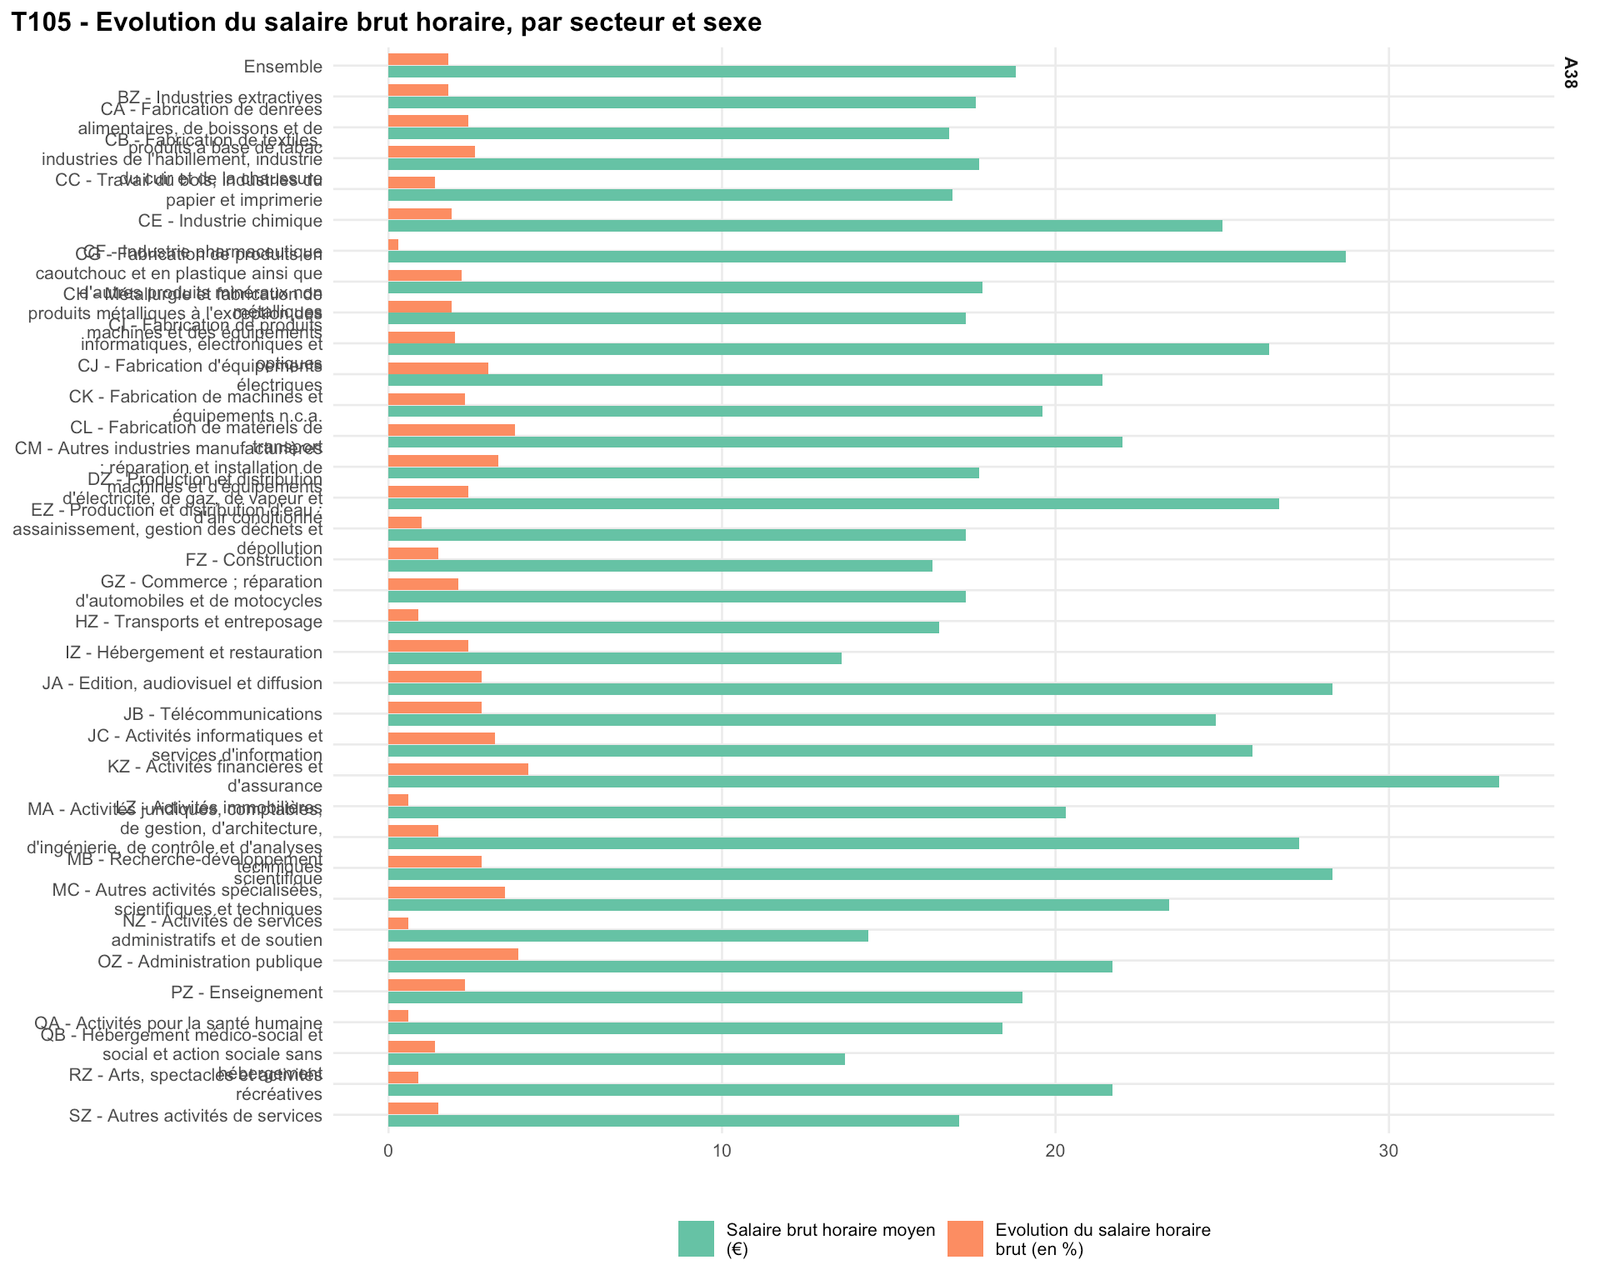
d6 |>
  filter(!is.na(valeur), !total100) |>
  mutate(lab = fct_inorder(libelle), serie = fct_inorder(serie)) |>
  ggplot(aes(x = valeur, y = fct_rev(lab), fill = serie)) +
  geom_col(position = position_dodge(width = 0.8), width = 0.75) +
  facet_grid(section ~ ., scales = "free_y", space = "free_y", labeller = labeller(section = scales::label_wrap(14))) +
  scale_y_discrete(labels = scales::label_wrap(40)) +
  scale_fill_brewer(palette = "Set2", name = NULL, labels = scales::label_wrap(30)) +
  theme_pub(10) +
  labs(x = "", y = NULL,
       title = str_wrap("T105 - Evolution du salaire brut horaire, par secteur et sexe", 75)) +
  guides(fill = guide_legend(ncol = 2))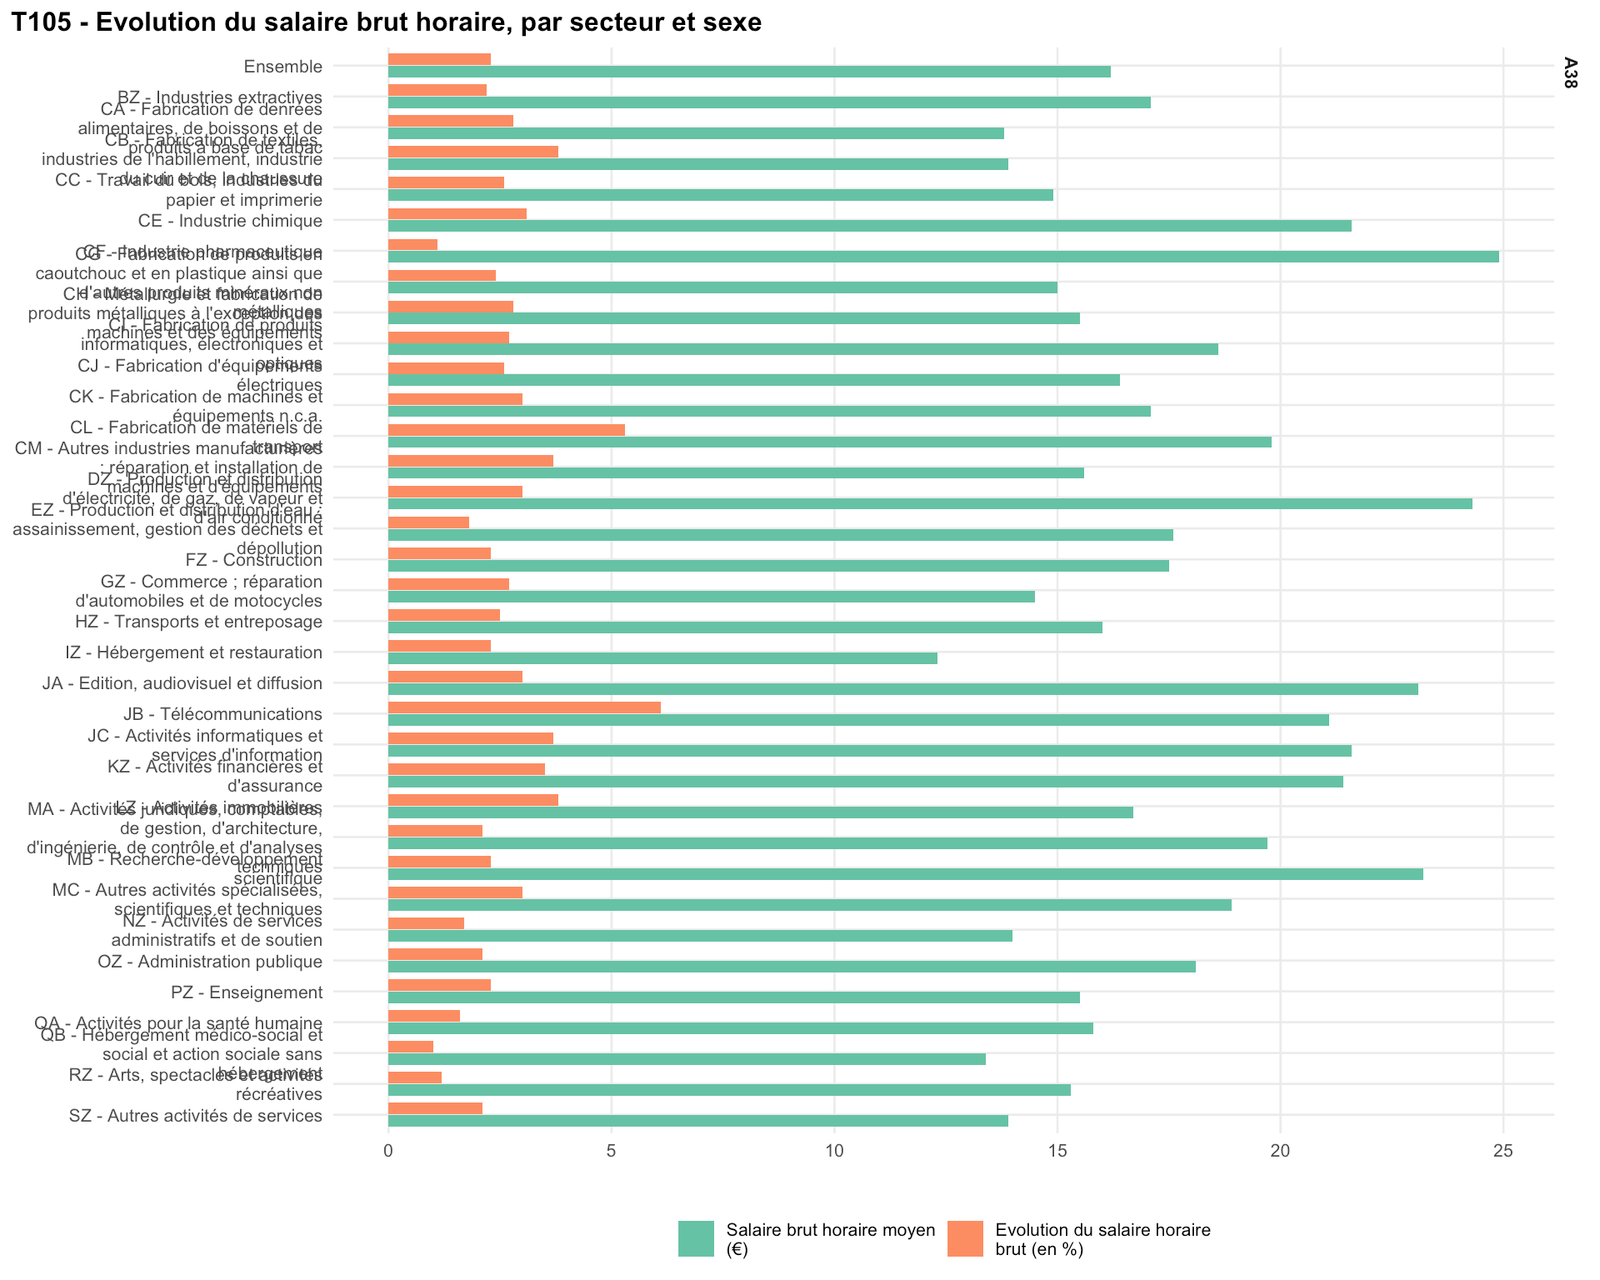
d7 |>
  filter(!is.na(valeur), !total100) |>
  mutate(lab = fct_inorder(libelle), serie = fct_inorder(serie)) |>
  ggplot(aes(x = valeur, y = fct_rev(lab), fill = serie)) +
  geom_col(position = position_dodge(width = 0.8), width = 0.75) +
  facet_grid(section ~ ., scales = "free_y", space = "free_y", labeller = labeller(section = scales::label_wrap(14))) +
  scale_y_discrete(labels = scales::label_wrap(40)) +
  scale_fill_brewer(palette = "Set2", name = NULL, labels = scales::label_wrap(30)) +
  theme_pub(10) +
  labs(x = "", y = NULL,
       title = str_wrap("T105 - Evolution du salaire brut horaire, par secteur et sexe", 75)) +
  guides(fill = guide_legend(ncol = 2))
d8 |>
  filter(!is.na(valeur), !total100) |>
  mutate(lab = fct_inorder(libelle), serie = fct_inorder(serie)) |>
  ggplot(aes(x = valeur, y = fct_rev(lab), fill = serie)) +
  geom_col(position = position_dodge(width = 0.8), width = 0.75) +
  facet_grid(section ~ ., scales = "free_y", space = "free_y", labeller = labeller(section = scales::label_wrap(14))) +
  scale_y_discrete(labels = scales::label_wrap(40)) +
  scale_fill_brewer(palette = "Set2", name = NULL, labels = scales::label_wrap(30)) +
  theme_pub(10) +
  labs(x = "", y = NULL,
       title = str_wrap("T105 - Evolution du salaire brut horaire, par secteur et sexe", 75)) +
  guides(fill = guide_legend(ncol = 2))
d9 |>
  filter(!is.na(valeur), !total100) |>
  mutate(lab = fct_inorder(libelle), serie = fct_inorder(serie)) |>
  ggplot(aes(x = valeur, y = fct_rev(lab), fill = serie)) +
  geom_col(position = position_dodge(width = 0.8), width = 0.75) +
  facet_grid(section ~ ., scales = "free_y", space = "free_y", labeller = labeller(section = scales::label_wrap(14))) +
  scale_y_discrete(labels = scales::label_wrap(40)) +
  scale_fill_brewer(palette = "Set2", name = NULL, labels = scales::label_wrap(30)) +
  theme_pub(10) +
  labs(x = "", y = NULL,
       title = str_wrap("T105 - Evolution du salaire brut horaire, par secteur et sexe", 75)) +
  guides(fill = guide_legend(ncol = 2))