Last data update: 02 août 2026, 11:03
Last compile: 16 oct. 2026, 01:23
a6 |>
  group_by(NOMENCLATURE, Nomenclature) |>
  summarise(Nobs = n()) |>
  arrange(-Nobs) |>
print_table_conditional()a6 |>
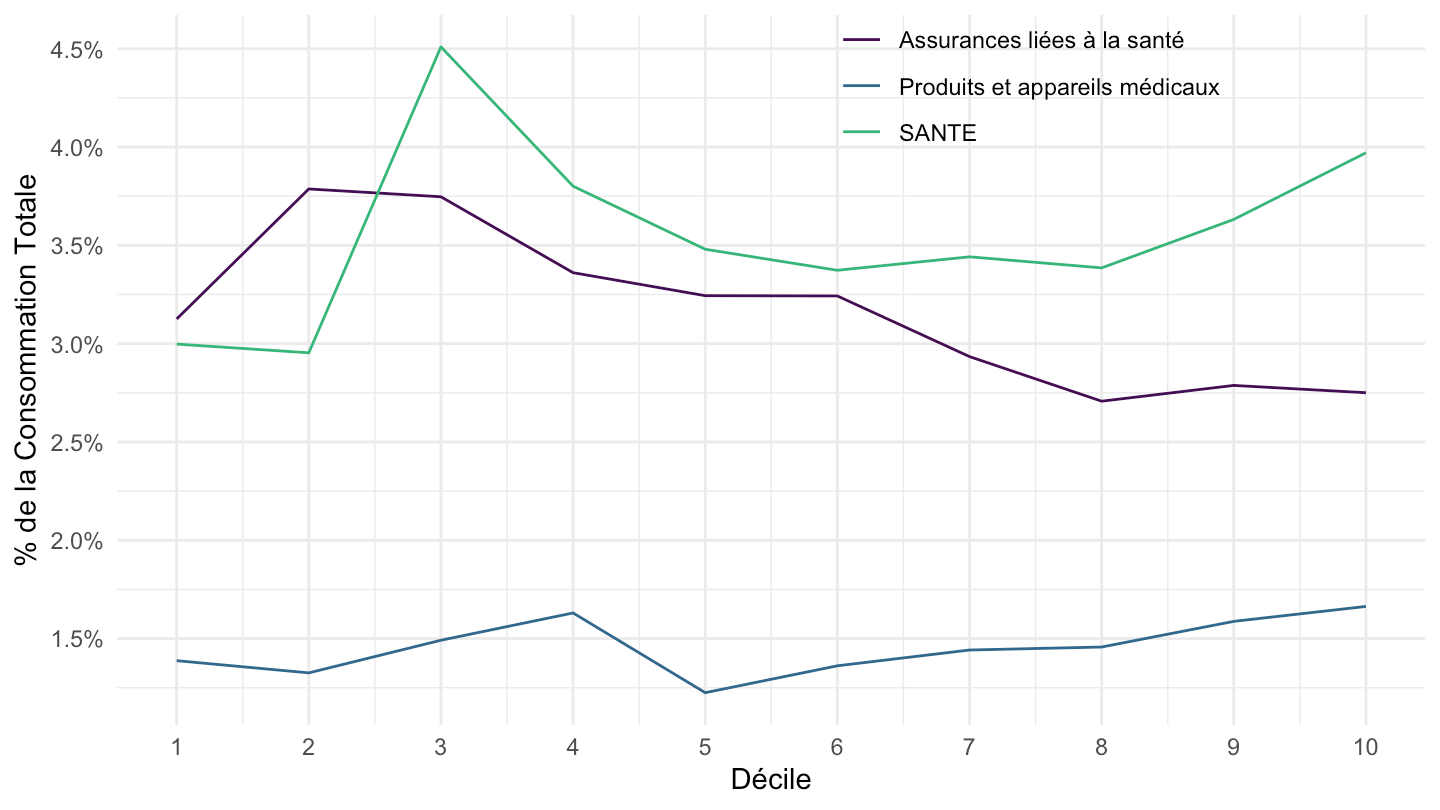
filter(NOMENCLATURE %in% c("1013", "022", "081", "CTOTALE")) |>
mutate(DECUC = DECUC |> as.numeric()) |>
group_by(DECUC) |>
mutate(CONSO = CONSO/CONSO[NOMENCLATURE == "CTOTALE"]) |>
filter(NOMENCLATURE != "CTOTALE") |>
ggplot() + geom_line(aes(x = DECUC, y = CONSO, color = Nomenclature)) +
theme_minimal() + xlab("Décile") + ylab("% de la Consommation Totale") +
scale_y_continuous(breaks = 0.01*seq(-30, 50, 0.5),
labels = percent_format(accuracy = .1)) +
scale_x_continuous(breaks = seq(0, 10, 1)) +
scale_color_manual(values = viridis(4)[1:3]) +
theme(legend.position = c(0.7, 0.9),
legend.title = element_blank())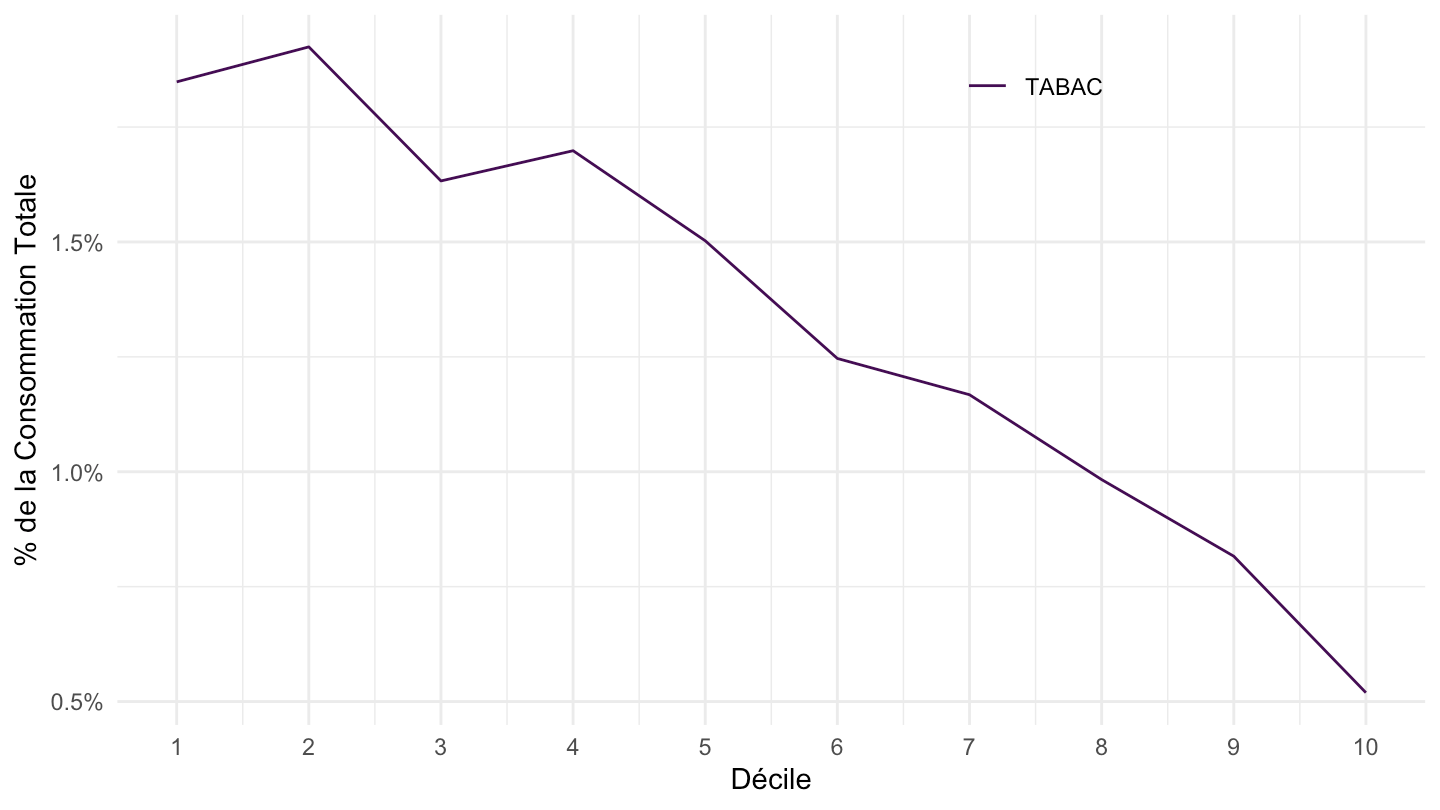
a6 |>
  filter(NOMENCLATURE %in% c("0813", "0812", "10", "CTOTALE")) |>
  mutate(DECUC = DECUC |> as.numeric()) |>
  group_by(DECUC) |>
  mutate(CONSO = CONSO/CONSO[NOMENCLATURE == "CTOTALE"]) |>
  filter(NOMENCLATURE != "CTOTALE") |>
  ggplot() + geom_line(aes(x = DECUC, y = CONSO, color = Nomenclature)) +
  theme_minimal() + xlab("Décile") + ylab("% de la Consommation Totale") +
  scale_y_continuous(breaks = 0.01*seq(-30, 50, 0.5),
                     labels = percent_format(accuracy = .1)) +
  scale_x_continuous(breaks = seq(0, 10, 1)) +
  scale_color_manual(values = viridis(4)[1:3]) +
  theme(legend.position = c(0.7, 0.9),
        legend.title = element_blank())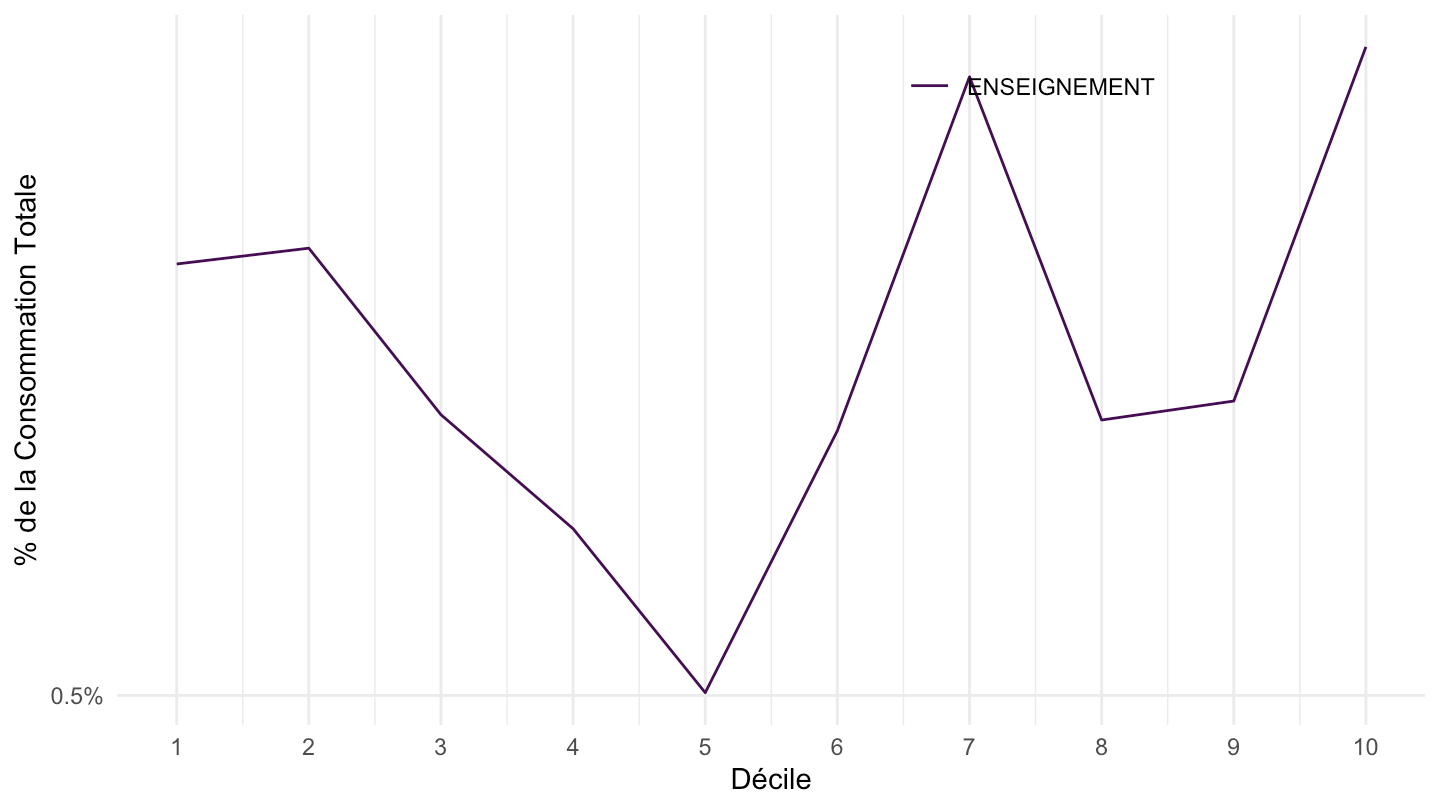
a6 |>
  filter(NOMENCLATURE %in% c("10", "10131", "1012", "CTOTALE")) |>
  mutate(DECUC = DECUC |> as.numeric()) |>
  group_by(DECUC) |>
  mutate(CONSO = CONSO/CONSO[NOMENCLATURE == "CTOTALE"]) |>
  filter(NOMENCLATURE != "CTOTALE") |>
  ggplot() + geom_line(aes(x = DECUC, y = CONSO, color = Nomenclature)) +
  theme_minimal() + xlab("Décile") + ylab("% de la Consommation Totale") +
  scale_y_continuous(breaks = 0.01*seq(-30, 50, 0.1),
                     labels = percent_format(accuracy = .1)) +
  scale_x_continuous(breaks = seq(0, 10, 1)) +
  scale_color_manual(values = viridis(4)[1:3]) +
  theme(legend.position = c(0.7, 0.9),
        legend.title = element_blank())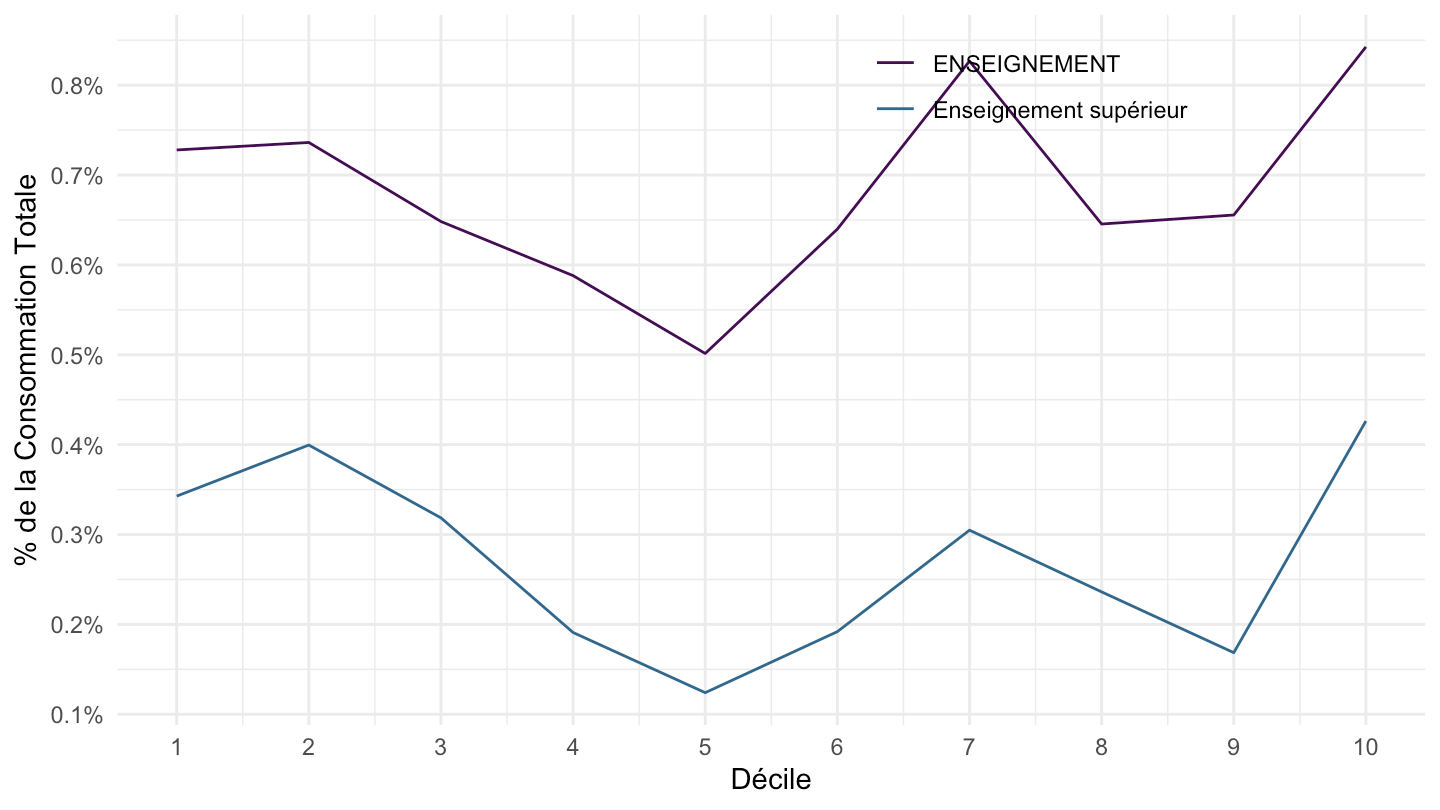
a6 |>
  filter(NOMENCLATURE %in% c("12431", "06", "0611", "CTOTALE")) |>
  mutate(DECUC = DECUC |> as.numeric()) |>
  group_by(DECUC) |>
  mutate(CONSO = CONSO/CONSO[NOMENCLATURE == "CTOTALE"]) |>
  filter(NOMENCLATURE != "CTOTALE") |>
  ggplot() + geom_line(aes(x = DECUC, y = CONSO, color = Nomenclature)) +
  theme_minimal() + xlab("Décile") + ylab("% de la Consommation Totale") +
  scale_y_continuous(breaks = 0.01*seq(-30, 50, 0.5),
                     labels = percent_format(accuracy = .1)) +
  scale_x_continuous(breaks = seq(0, 10, 1)) +
  scale_color_manual(values = viridis(4)[1:3]) +
  theme(legend.position = c(0.7, 0.9),
        legend.title = element_blank())