
Last observation: 2023 (N = 1074)
First observation: 1959 (N = 708)
Last data update: 02 août 2026, 11:05
Last compile: 07 oct. 2026, 03:27
Les tableaux détaillés présentent la consommation effective des ménages depuis 1959 jusqu’à l’année du compte provisoire, déclinée aux niveaux diffusables les plus fins des nomenclatures de produits (Nomenclature agrégée), de fonction (COICOP) et de durabilité.
Pour chaque nomenclature (produit, fonction durabilité), les résultats détaillés ont le format suivant :
T_CONSO_EFF_FONCTION |>
  group_by(variable) |>
  summarise(Nobs = n()) |>
print_table_conditional()| variable | Nobs |
|---|---|
| COEFFCOUR | 11605 |
| IPRIX2020 | 11605 |
| IVAL | 11426 |
| IVOL | 11426 |
| MEUR2020 | 11605 |
| MEURcour | 11605 |
T_CONSO_EFF_FONCTION |>
  filter(nchar(fonction) == 2) |>
  group_by(fonction, Fonction) |>
  summarise(Nobs = n()) |>
print_table_conditional()| fonction | Fonction | Nobs |
|---|---|---|
| _Z | Total de la consommation effective des ménages | 388 |
T_CONSO_EFF_FONCTION |>
  filter(nchar(fonction) == 4) |>
  group_by(fonction, Fonction) |>
  summarise(Nobs = n()) |>
print_table_conditional()| fonction | Fonction | Nobs |
|---|---|---|
| CP01 | Produits alimentaires et boissons non alcoolisées | 388 |
| CP02 | Boissons alcoolisées, tabac et stupéfiants | 388 |
| CP03 | Articles d’habillement et chaussures | 388 |
| CP04 | Logement, eau, gaz, électricité et autres combustibles | 388 |
| CP05 | Meubles, articles de ménage et entretien courant du foyer | 388 |
| CP06 | Santé | 388 |
| CP07 | Transports | 388 |
| CP08 | Information et communication | 388 |
| CP09 | Loisirs, sport et culture | 388 |
| CP10 | Services de l’enseignement | 388 |
| CP11 | Restaurants et services d’hébergement | 388 |
| CP12 | Assurance et services financiers | 388 |
| CP13 | Soins corporels, protection sociale et biens et services divers | 388 |
| CP14 | Dépenses de consommation individuelle à la charge des institutions sans but lucratif au service des ménages (ISBLSM) | 388 |
| CP15 | Dépenses de consommation individuelle à la charge des administrations publiques | 388 |
| CP16 | Solde territorial | 388 |
T_CONSO_EFF_FONCTION |>
  filter(nchar(fonction) == 6) |>
  group_by(fonction, Fonction) |>
  summarise(Nobs = n()) |>
print_table_conditional()T_CONSO_EFF_FONCTION |>
filter(nchar(fonction) == 8) |>
group_by(fonction, Fonction) |>
summarise(Nobs = n()) |>
print_table_conditional()| fonction | Fonction | Nobs |
|---|---|---|
| CPDEPHSI | Dépense de consommation des ménages hors SIFIM | 388 |
T_CONSO_EFF_FONCTION |>
  filter(!(nchar(fonction) %in% c(2, 4, 6))) |>
  group_by(fonction, Fonction) |>
  summarise(Nobs = n()) |>
print_table_conditional()T_CONSO_EFF_FONCTION |>
group_by(year) |>
summarise(Nobs = n()) |>
arrange(desc(year)) |>
print_table_conditional()T_CONSO_EFF_FONCTION |>
filter(variable == "MEURcour") |>
year_to_date2() |>
left_join(gdp, by = "date") |>
filter(date == as.Date("2020-01-01")) |>
select(-date) %>%
mutate(`% du PIB` = (100*value/(gdp)) |> round(digits = 2),
value = round(value) |> paste0(" Mds€")) |>
select(-gdp) %>%
{if (is_html_output()) datatable(., filter = 'top', rownames = F) else .}T_CONSO_EFF_FONCTION |>
filter(variable == "MEURcour") |>
year_to_date2() |>
left_join(gdp, by = "date") |>
filter(date == as.Date("2020-01-01")) |>
select(-date) |>
arrange(-value) %>%
mutate(`% du PIB` = (100*value/(gdp)) |> round(digits = 2),
value = round(value) |> paste0(" Mds€")) |>
select(-gdp) |>
print_table_conditional()T_CONSO_EFF_FONCTION |>
filter(variable == "MEURcour") |>
year_to_date2() |>
filter(fonction %in% c("CP041", "CP042", "CP045")) |>
left_join(gdp, by = "date") |>
ggplot() + theme_minimal() + ylab("Consommation (Milliards€)") + xlab("") +
geom_line(aes(x = date, y = value/1000, color = Fonction)) +
theme(legend.title = element_blank(),
legend.position = c(0.3, 0.91)) +
scale_x_date(breaks = seq(1950, 2100, 5) |> paste0("-01-01") |> as.Date(),
labels = date_format("%Y")) +
scale_y_continuous(breaks = seq(0, 500, 20),
labels = dollar_format(acc = 1, pre = "", su = " Mds€"))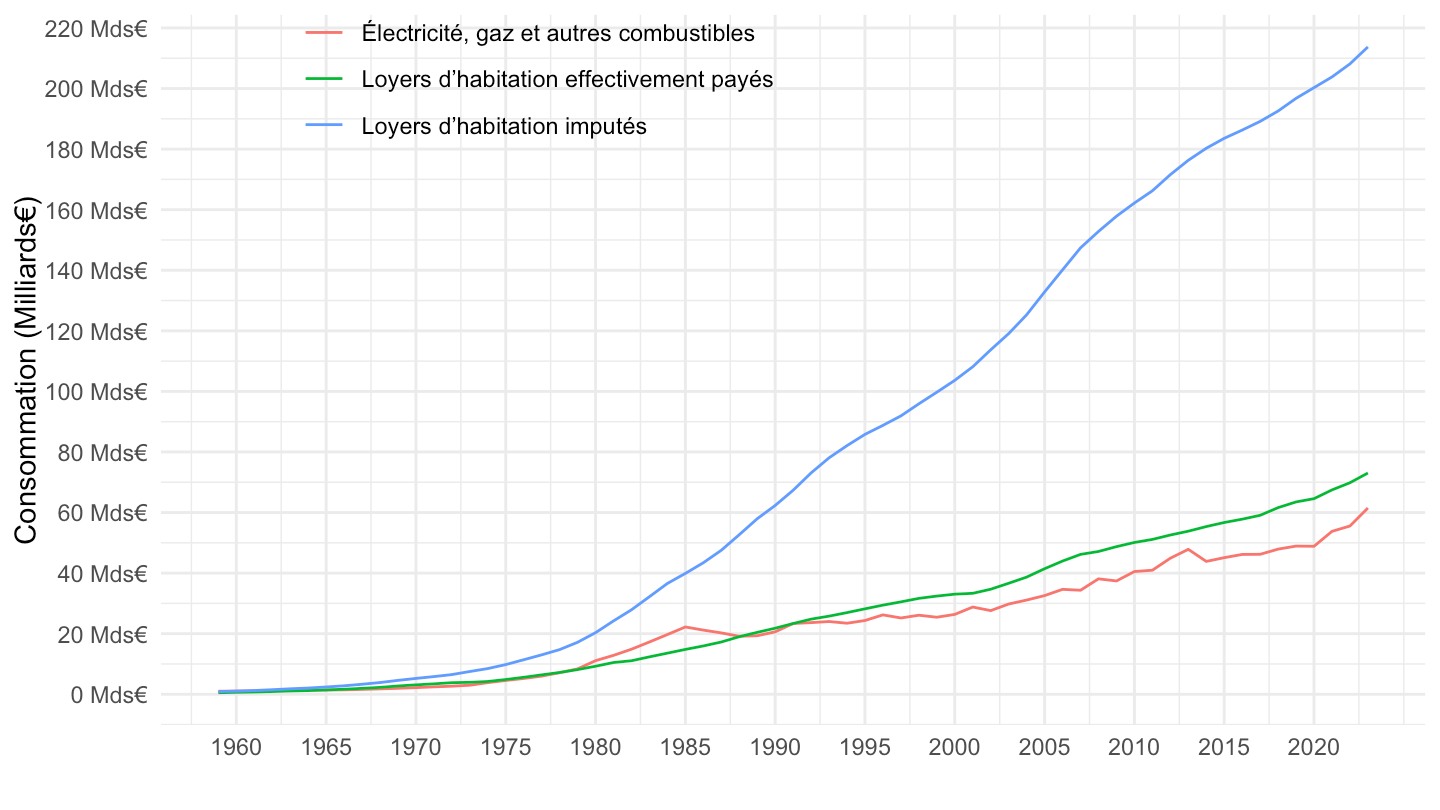
T_CONSO_EFF_FONCTION |>
  filter(variable == "MEURcour") |>
  year_to_date2() |>
  filter(fonction %in% c("CP041", "CP042", "CP045")) |>
  left_join(gdp, by = "date") |>
  ggplot() + theme_minimal() + ylab("Consommation (% du PIB)") + xlab("") +
  geom_line(aes(x = date, y = value/(gdp), color = Fonction)) +
  theme(legend.title = element_blank(),
        legend.position = c(0.3, 0.91)) +
  scale_x_date(breaks = seq(1950, 2100, 5) |> paste0("-01-01") |> as.Date(),
               labels = date_format("%Y")) +

  scale_y_continuous(breaks = 0.01*seq(0, 100, 0.5),
                     labels = scales::percent_format(accuracy = 0.1))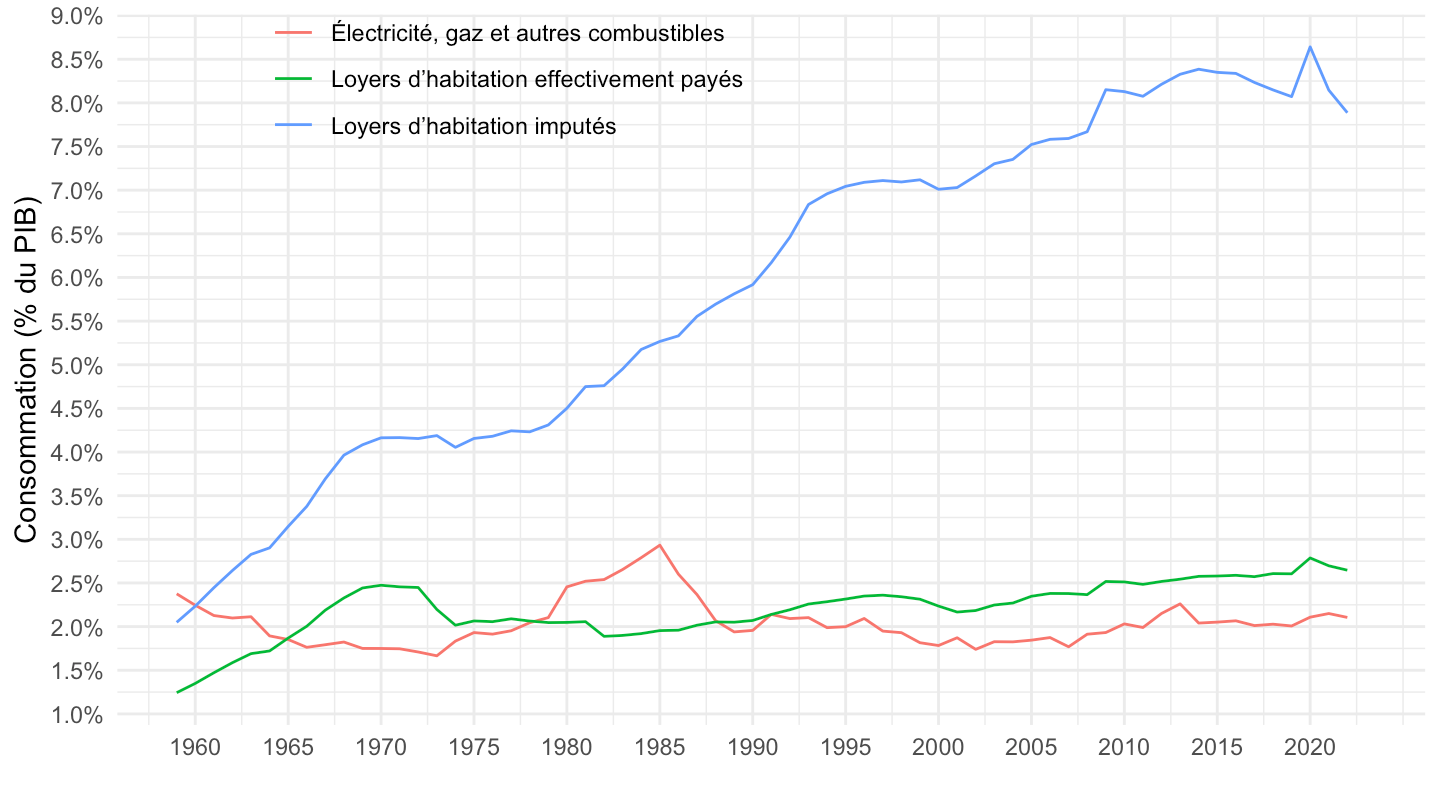
T_CONSO_EFF_FONCTION |>
  filter(variable == "MEURcour") |>
  year_to_date2() |>
  filter(fonction %in% c("CP043", "CP044")) |>
  left_join(gdp, by = "date") |>
  ggplot() + theme_minimal() + ylab("Consommation (% du PIB)") + xlab("") +
  geom_line(aes(x = date, y = value/(gdp), color = Fonction)) +
  theme(legend.title = element_blank(),
        legend.position = c(0.6, 0.2)) +
  scale_x_date(breaks = seq(1950, 2100, 5) |> paste0("-01-01") |> as.Date(),
               labels = date_format("%Y")) +

  scale_y_continuous(breaks = 0.01*seq(0, 100, 0.1),
                     labels = scales::percent_format(accuracy = 0.1))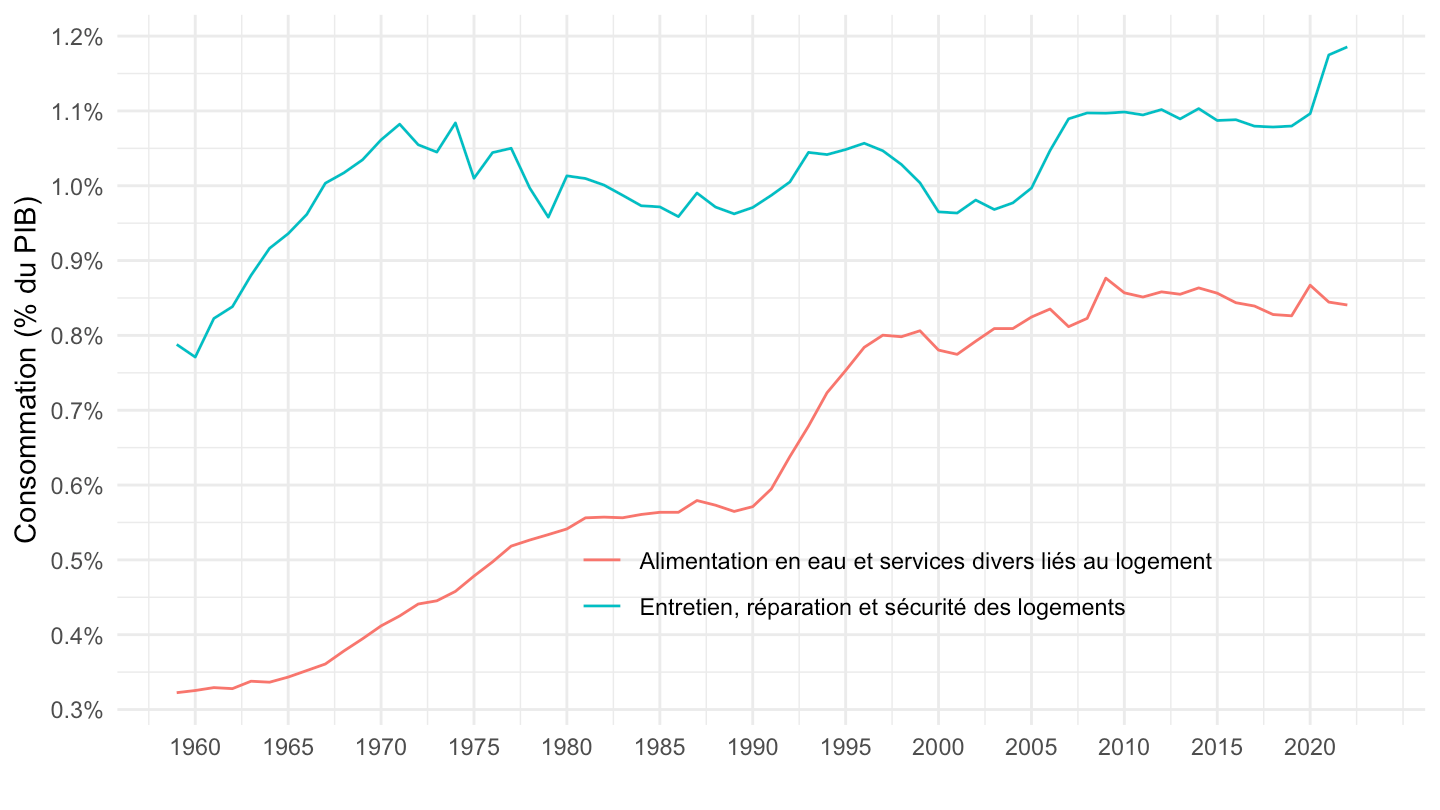
T_CONSO_EFF_FONCTION |>
  filter(variable == "IPRIX2020",
         year %in% c("1990", "2020")) |>
  select(-variable) |>
  spread(year, value) |>
  mutate(`% / an` = round(100*((`2020`/`1990`)^(1/30)-1), 2)) |>
  arrange(`% / an`) |>
print_table_conditional()T_CONSO_EFF_FONCTION |>
filter(variable == "IPRIX2020") |>
year_to_date2() |>
filter(Fonction %in% c("Dépense de consommation des ménages",
"Dépense de consommation des ménages hors SIFIM",
"Consommation effective des ménages")) |>
filter(date >= as.Date("1990-01-01")) |>
group_by(fonction) |>
arrange(date) |>
mutate(value = 100*value/value[1]) |>
ggplot() + theme_minimal() + xlab("") + ylab("") +
geom_line(aes(x = date, y = value, color = Fonction)) +
scale_x_date(breaks = seq(1960, 2100, 5) |> paste0("-01-01") |> as.Date(),
labels = date_format("%Y")) +
scale_y_log10(breaks = seq(100, 300, 10)) +
theme(legend.position = c(0.25, 0.9),
legend.title = element_blank())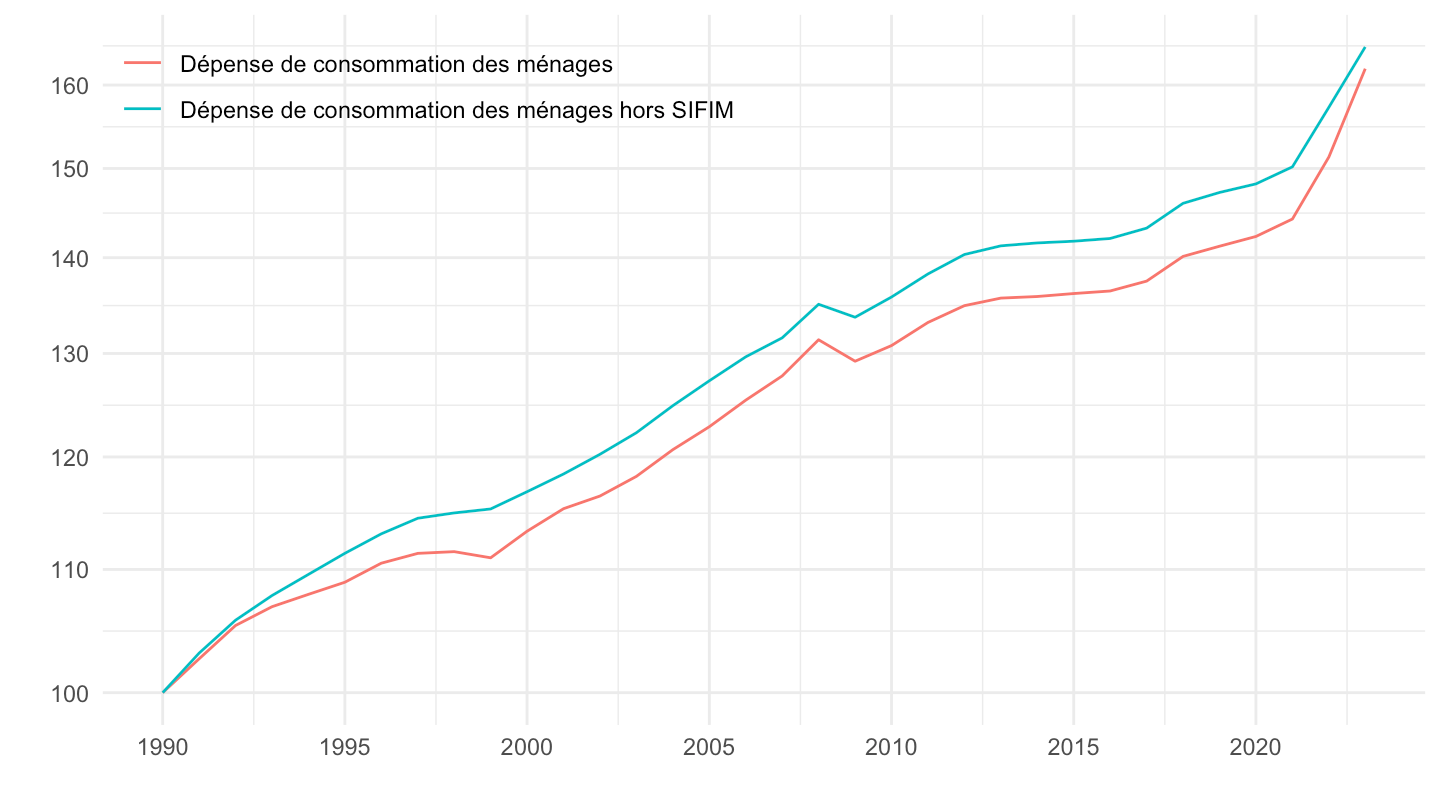
T_CONSO_EFF_FONCTION |>
  filter(variable == "IPRIX2020") |>
  year_to_date2() |>
  filter(fonction %in% c("CP041", "CP042"))  |>
  filter(date >= as.Date("1990-01-01")) |>
  group_by(fonction) |>
  arrange(date) |>
  mutate(value = 100*value/value[1]) |>
  ggplot() + theme_minimal() + xlab("") + ylab("") +
  geom_line(aes(x = date, y = value, color = Fonction)) +
  scale_x_date(breaks = seq(1960, 2100, 5) |> paste0("-01-01") |> as.Date(),
               labels = date_format("%Y")) +
  scale_y_log10(breaks = seq(100, 300, 10)) +

  theme(legend.position = c(0.25, 0.9),
        legend.title = element_blank())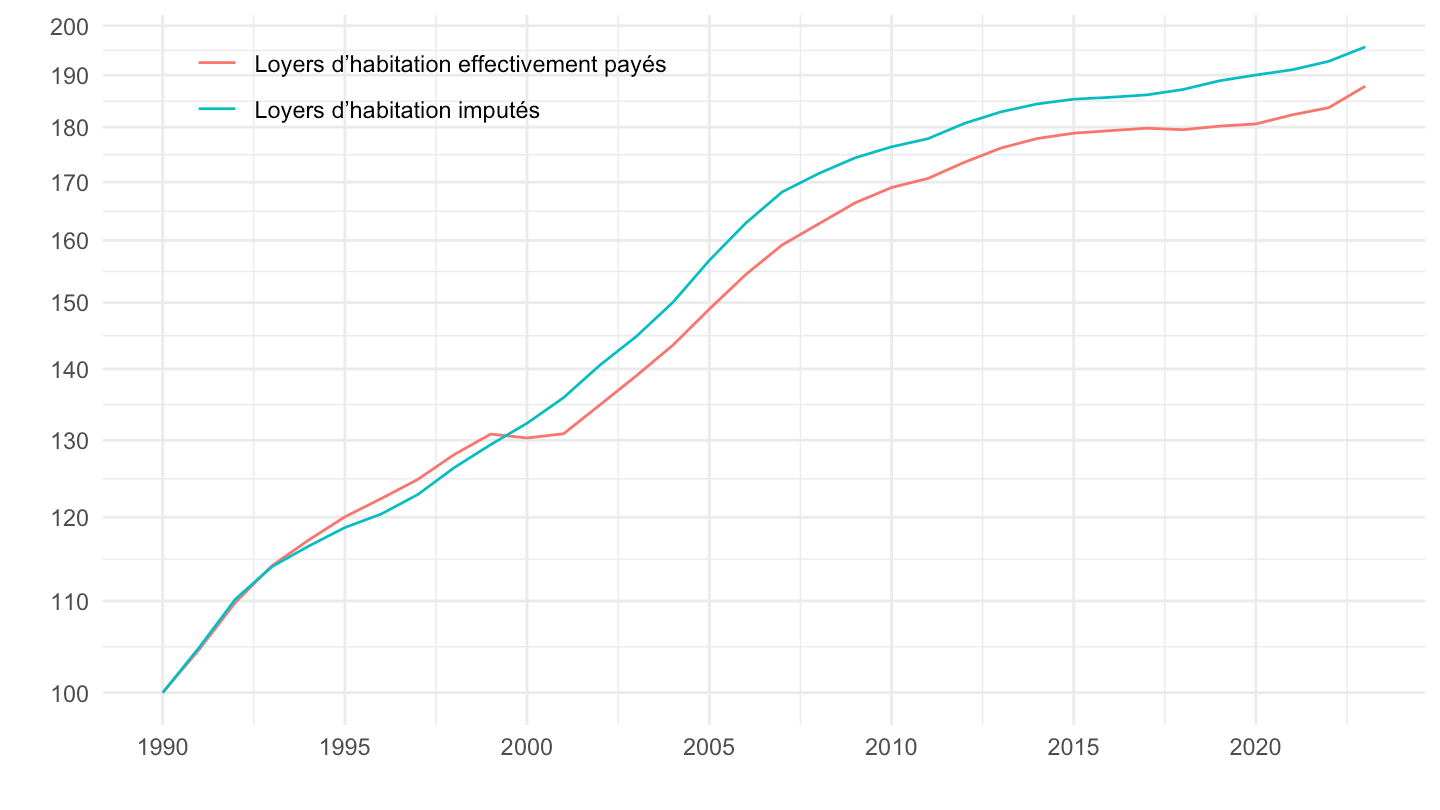
T_CONSO_EFF_FONCTION |>
  filter(variable == "IPRIX2020") |>
  year_to_date2() |>
  filter(fonction %in% c("CP041", "CP042"))  |>
  filter(date >= as.Date("1996-01-01")) |>
  group_by(fonction) |>
  arrange(date) |>
  mutate(value = 100*value/value[1]) |>
  ggplot() + theme_minimal() + xlab("") + ylab("") +
  geom_line(aes(x = date, y = value, color = Fonction)) +
  scale_x_date(breaks = seq(1996, 2100, 2) |> paste0("-01-01") |> as.Date(),
               labels = date_format("%Y")) +
  scale_y_log10(breaks = seq(100, 300, 10)) +

  theme(legend.position = c(0.25, 0.9),
        legend.title = element_blank())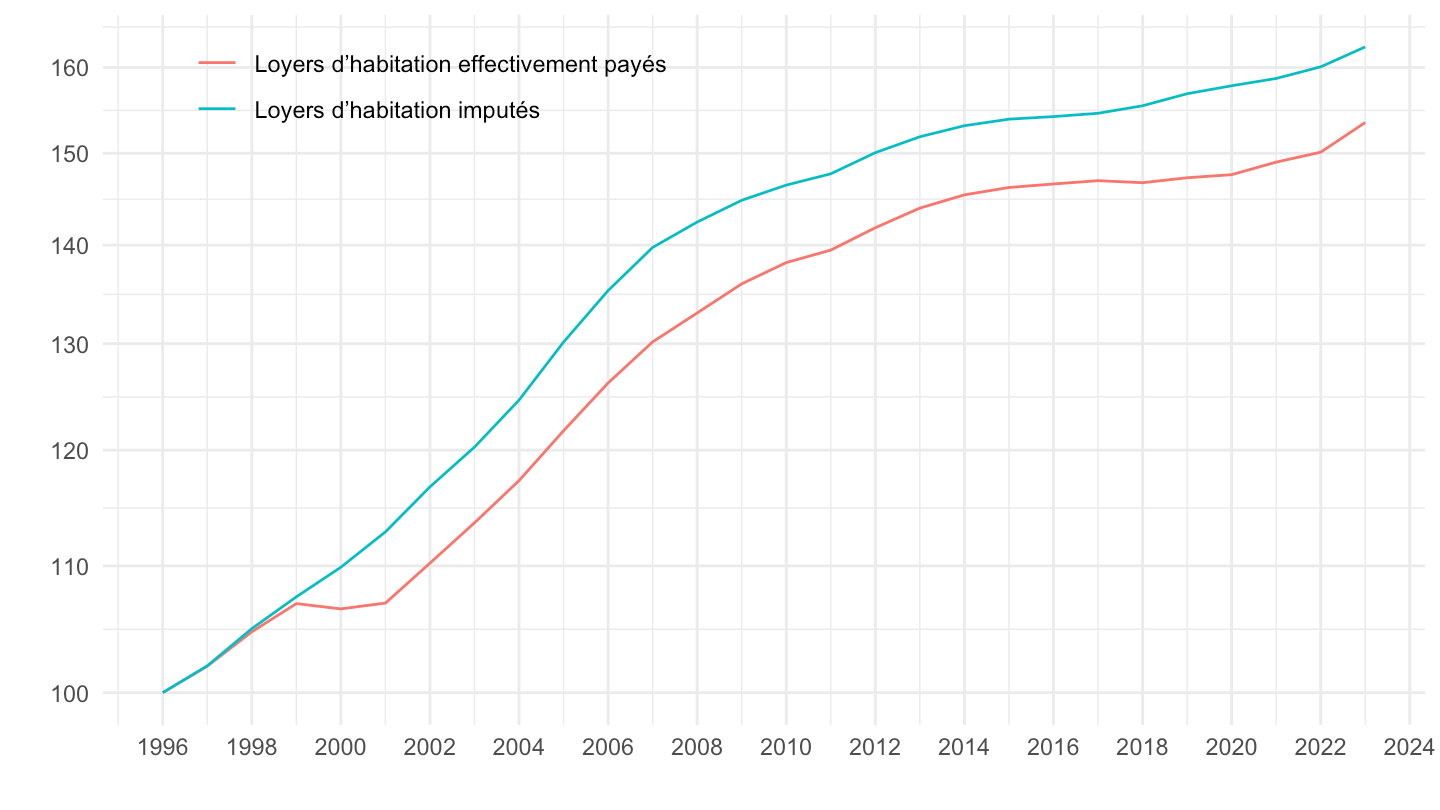
T_CONSO_EFF_FONCTION |>
  filter(variable == "IPRIX2020") |>
  year_to_date2() |>
  filter(fonction %in% c("CP082", "CP0913", "CP0912", "CP0911", "CP1261"))  |>
  filter(date >= as.Date("1972-01-01")) |>
  group_by(fonction) |>
  arrange(date) |>
  mutate(value = 100*value/value[1]) |>
  ggplot() + theme_minimal() + xlab("") + ylab("") +
  geom_line(aes(x = date, y = value, color = Fonction)) +
  scale_x_date(breaks = seq(1960, 2100, 5) |> paste0("-01-01") |> as.Date(),
               labels = date_format("%Y")) +
  scale_y_log10(breaks = c(0.1, 1, 2, 3, 5, 10, 20, 30, 50, 100, 200, 400, 800, 1600)) +
  theme(legend.position = c(0.35, 0.2),
        legend.title = element_blank())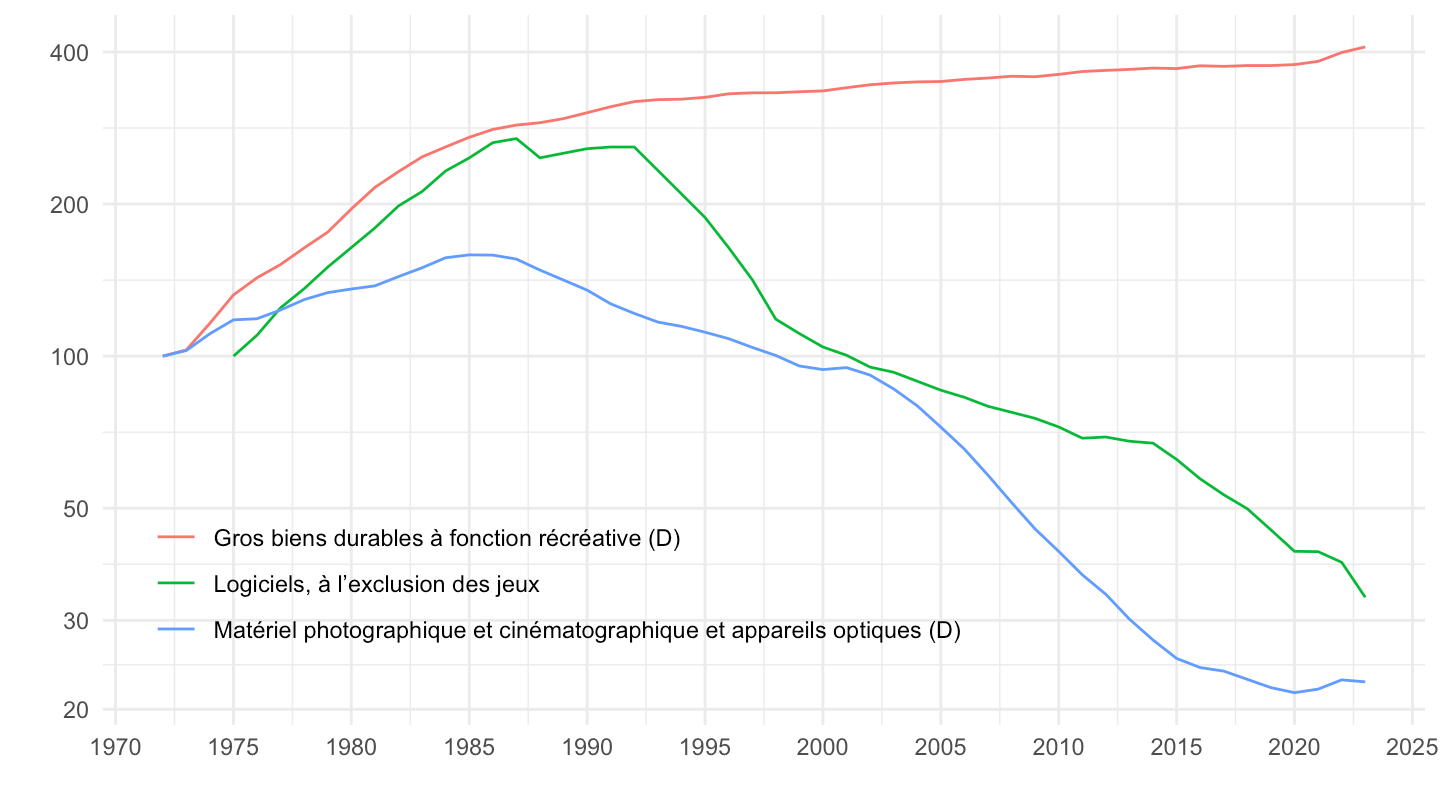
T_CONSO_EFF_FONCTION |>
  filter(variable == "IPRIX2020") |>
  year_to_date2() |>
  filter(fonction %in% c("CP082", "CP0913", "CP0912", "CP0911", "CP1261"))  |>
  filter(date >= as.Date("1990-01-01")) |>
  group_by(fonction) |>
  arrange(date) |>
  mutate(value = 100*value/value[1]) |>
  ggplot() + theme_minimal() + xlab("") + ylab("") +
  geom_line(aes(x = date, y = value, color = Fonction)) +
  scale_x_date(breaks = seq(1960, 2100, 5) |> paste0("-01-01") |> as.Date(),
               labels = date_format("%Y")) +
  scale_y_log10(breaks = c(0.1, 1, 2, 3, 5, 10, 20, 30, 50, 100)) +
  theme(legend.position = c(0.35, 0.2),
        legend.title = element_blank())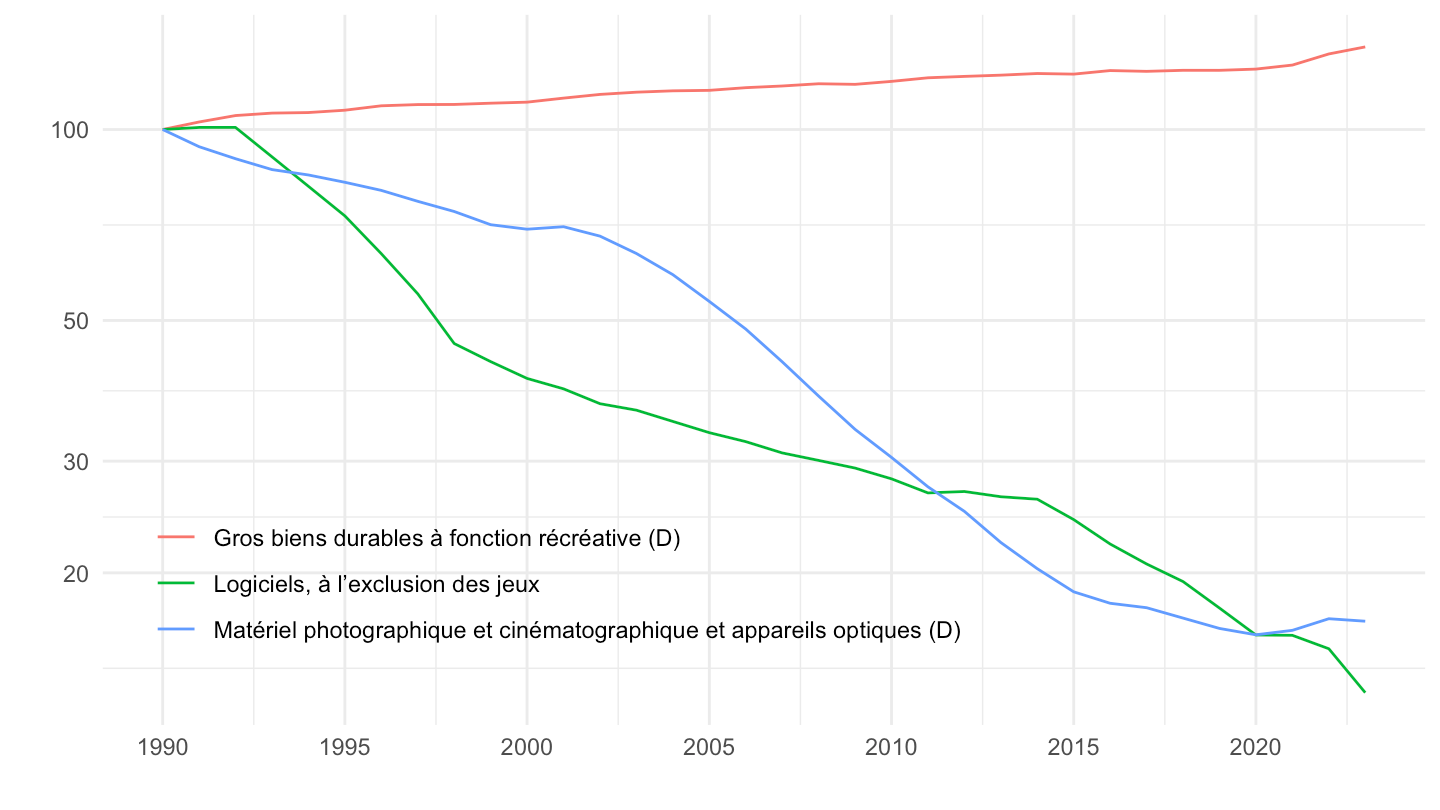
T_CONSO_EFF_FONCTION |>
  filter(variable == "IPRIX2020") |>
  year_to_date2() |>
  filter(fonction %in% c("CP082", "CP0913", "CP0912", "CP0911", "CP1261"))  |>
  filter(date >= as.Date("1996-01-01")) |>
  group_by(fonction) |>
  arrange(date) |>
  mutate(value = 100*value/value[1]) |>
  ggplot() + theme_minimal() + xlab("") + ylab("") +
  geom_line(aes(x = date, y = value, color = Fonction)) +
  scale_x_date(breaks = seq(1960, 2100, 2) |> paste0("-01-01") |> as.Date(),
               labels = date_format("%Y")) +
  scale_y_log10(breaks = c(0.1, 1, 2, 3, 5, 10, 20, 30, 50, 100)) +
  theme(legend.position = c(0.35, 0.2),
        legend.title = element_blank())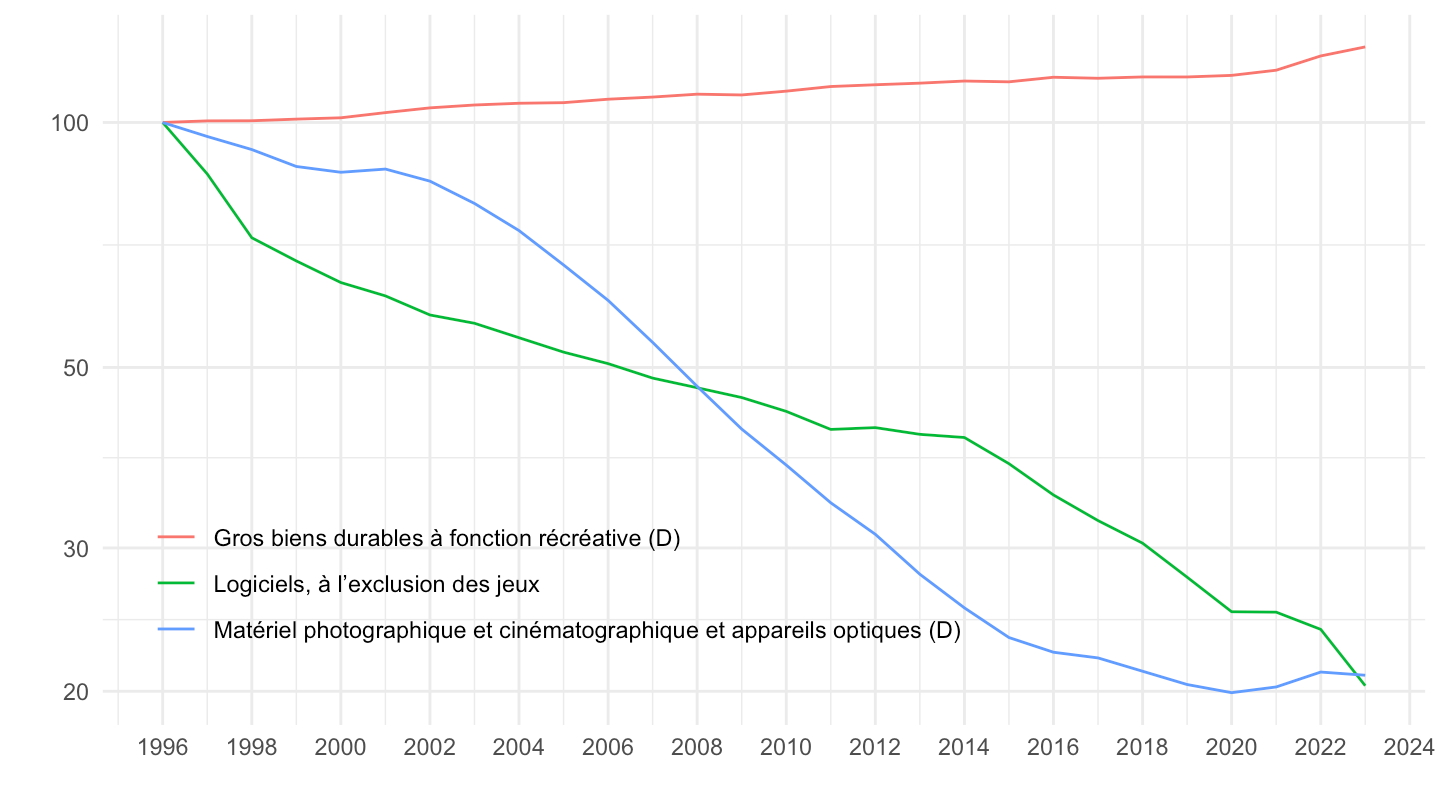
T_CONSO_EFF_FONCTION |>
  filter(variable == "COEFFCOUR",
         year %in% c("1960", "1990", "2020")) |>
  select(-variable) |>
  spread(year, value) |>
  arrange(-`2020`) |>
print_table_conditional()T_CONSO_EFF_FONCTION |>
filter(variable == "COEFFCOUR",
fonction %in% c("CP091", "CP082", "CP126")) |>
year_to_date2() |>
mutate(value = value / 100) |>
ggplot() + ylab("Pondération (% de la conso effective totale)") + xlab("") + theme_minimal() +
geom_line(aes(x = date, y = value, color = paste0(fonction, " - ", Fonction))) +
scale_x_date(breaks = seq(1920, 2100, 5) |> paste0("-01-01") |> as.Date(),
labels = date_format("%Y")) +
theme(legend.position = c(0.28, 0.93),
legend.title = element_blank()) +
scale_y_continuous(breaks = 0.01*seq(0, 300, .5),
labels = percent_format(accuracy = .1))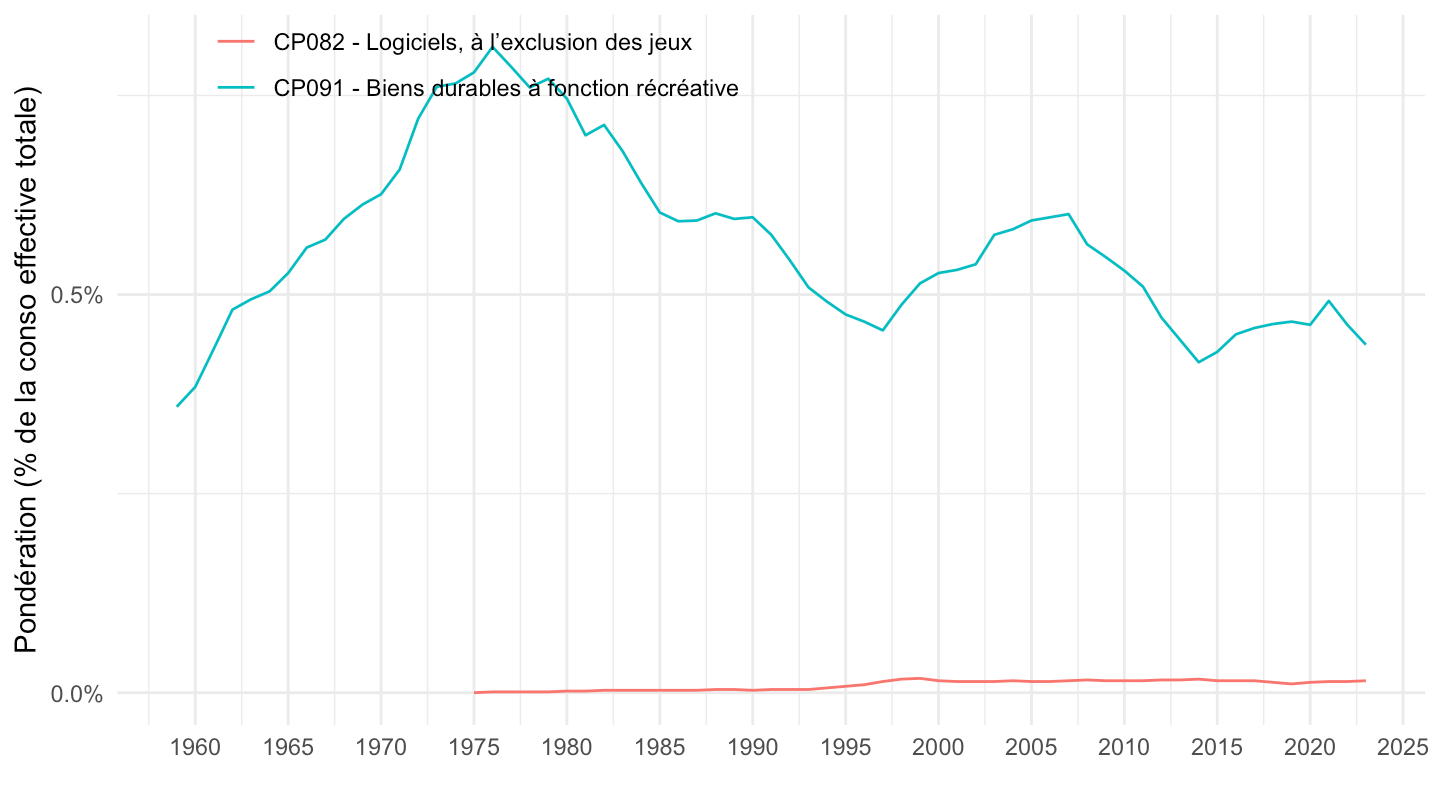
T_CONSO_EFF_FONCTION |>
  filter(variable == "COEFFCOUR",
         fonction %in% c("CP14", "CP01..CP12+CP15")) |>
  year_to_date2() |>
  mutate(value = value / 100) |>
  ggplot() + ylab("Pondération (% de la conso effective totale)") + xlab("") + theme_minimal() +
  geom_line(aes(x = date, y = value, color = paste0(fonction, " - ", Fonction))) +

  scale_x_date(breaks = seq(1920, 2100, 5) |> paste0("-01-01") |> as.Date(),
               labels = date_format("%Y")) +
  theme(legend.position = c(0.4, 0.6),
        legend.title = element_blank()) +
  scale_y_continuous(breaks = 0.01*seq(0, 100, 5),
                     labels = percent_format(accuracy = 1))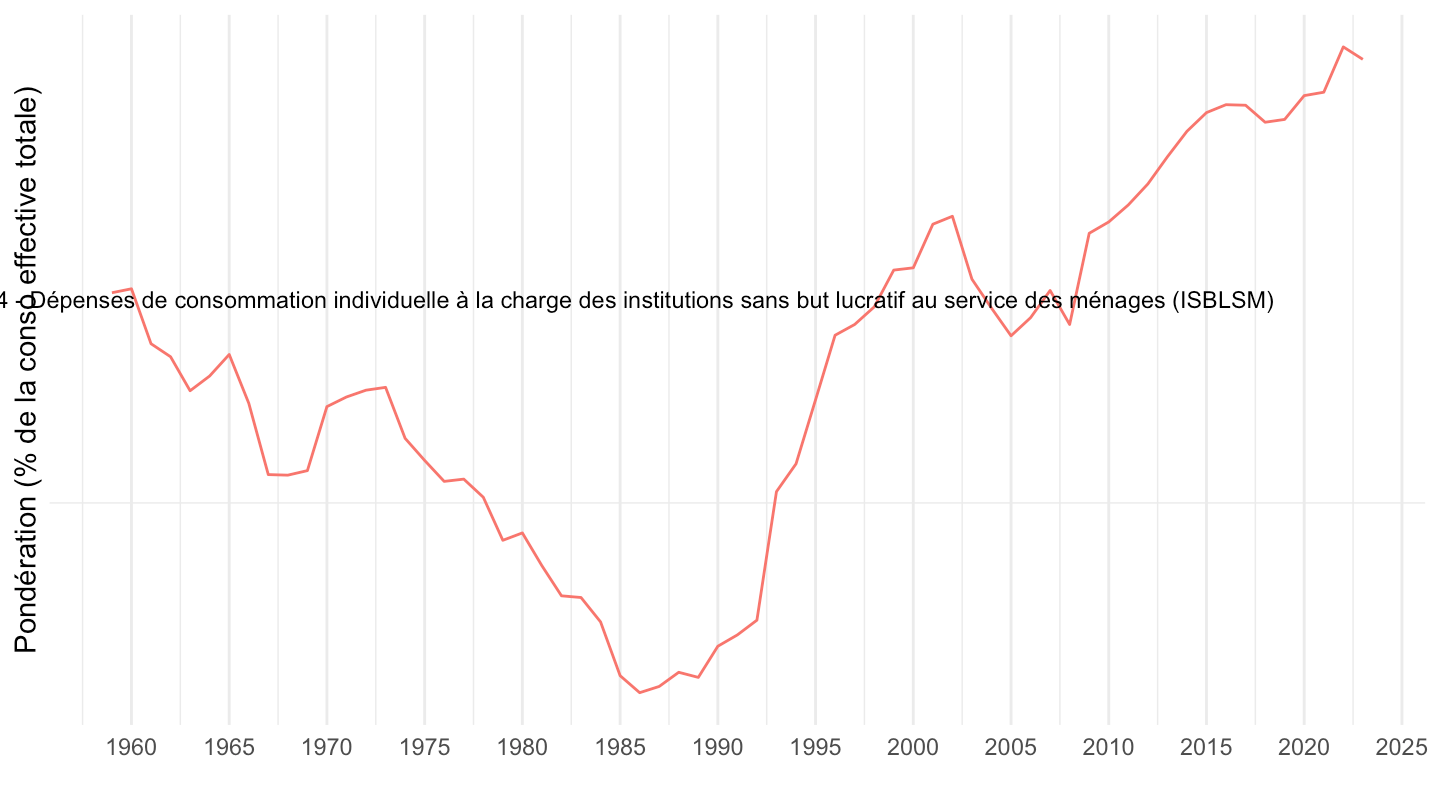
T_CONSO_EFF_FONCTION |>
  filter(variable == "COEFFCOUR",
         fonction %in% c("CP141", "CP142", "CP143", "CP144", "CP145")) |>
  year_to_date2() |>
  mutate(value = value / 100) |>
  ggplot() + ylab("Pondération (% de la conso effective totale)") + xlab("") + theme_minimal() +
  geom_line(aes(x = date, y = value, color = paste0(fonction, " - ", Fonction))) +
  #
  scale_x_date(breaks = seq(1920, 2100, 5) |> paste0("-01-01") |> as.Date(),
               labels = date_format("%Y")) +
  theme(legend.position = c(0.2, 0.88),
        legend.title = element_blank()) +
  scale_y_continuous(breaks = 0.01*seq(0, 100, 1),
                     labels = percent_format(accuracy = 1))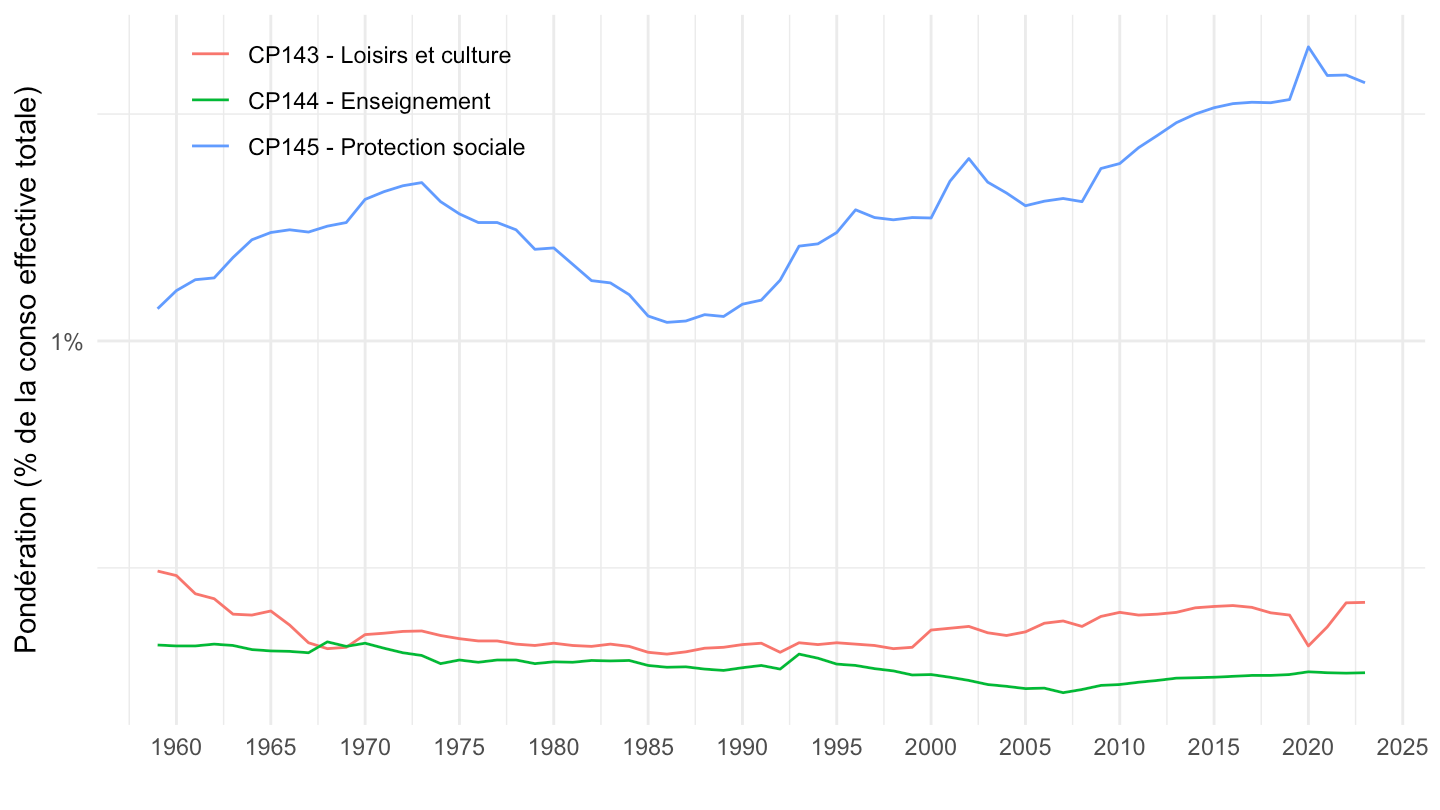
T_CONSO_EFF_FONCTION |>
  filter(variable == "COEFFCOUR",
         fonction %in% c("CP041", "CP042", "CP045")) |>
  year_to_date2() |>
  mutate(value = value / 100) |>
  ggplot() + ylab("Pondération (% de la conso effective totale)") + xlab("") + theme_minimal() +
  geom_line(aes(x = date, y = value, color = paste0(fonction, " - ", Fonction))) +
  #
  scale_x_date(breaks = seq(1920, 2100, 5) |> paste0("-01-01") |> as.Date(),
               labels = date_format("%Y")) +
  theme(legend.position = c(0.28, 0.93),
        legend.title = element_blank()) +
  scale_y_continuous(breaks = 0.01*seq(0, 300, .5),
                     labels = percent_format(accuracy = .1))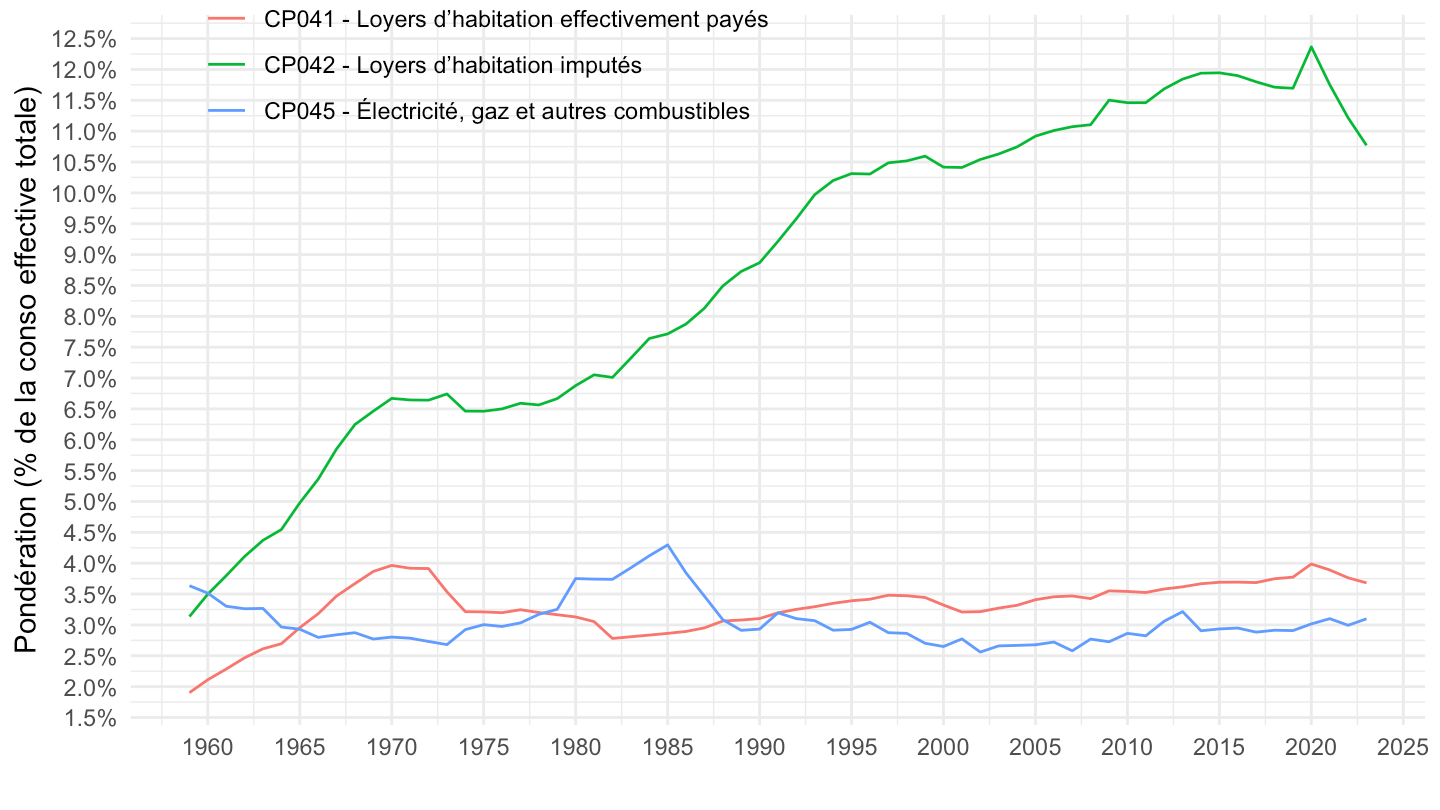
T_CONSO_EFF_FONCTION |>
  filter(variable == "COEFFCOUR",
         fonction %in% c("CP041", "CP042", "CP045", "CPDEP")) |>
  year_to_date2() |>
  group_by(date) |>
  mutate(value = value/value[fonction =="CPDEP"]) |>
  ungroup() |>
  filter(fonction != "CPDEP") |>
  ggplot() + ylab("Pondération (% de la consommation finale)") + xlab("") + theme_minimal() +
  geom_line(aes(x = date, y = value, color = paste0(fonction, " - ", Fonction))) +
  #
  scale_x_date(breaks = seq(1920, 2100, 5) |> paste0("-01-01") |> as.Date(),
               labels = date_format("%Y")) +
  theme(legend.position = c(0.28, 0.93),
        legend.title = element_blank()) +
  scale_y_continuous(breaks = 0.01*seq(0, 300, .5),
                     labels = percent_format(accuracy = .1))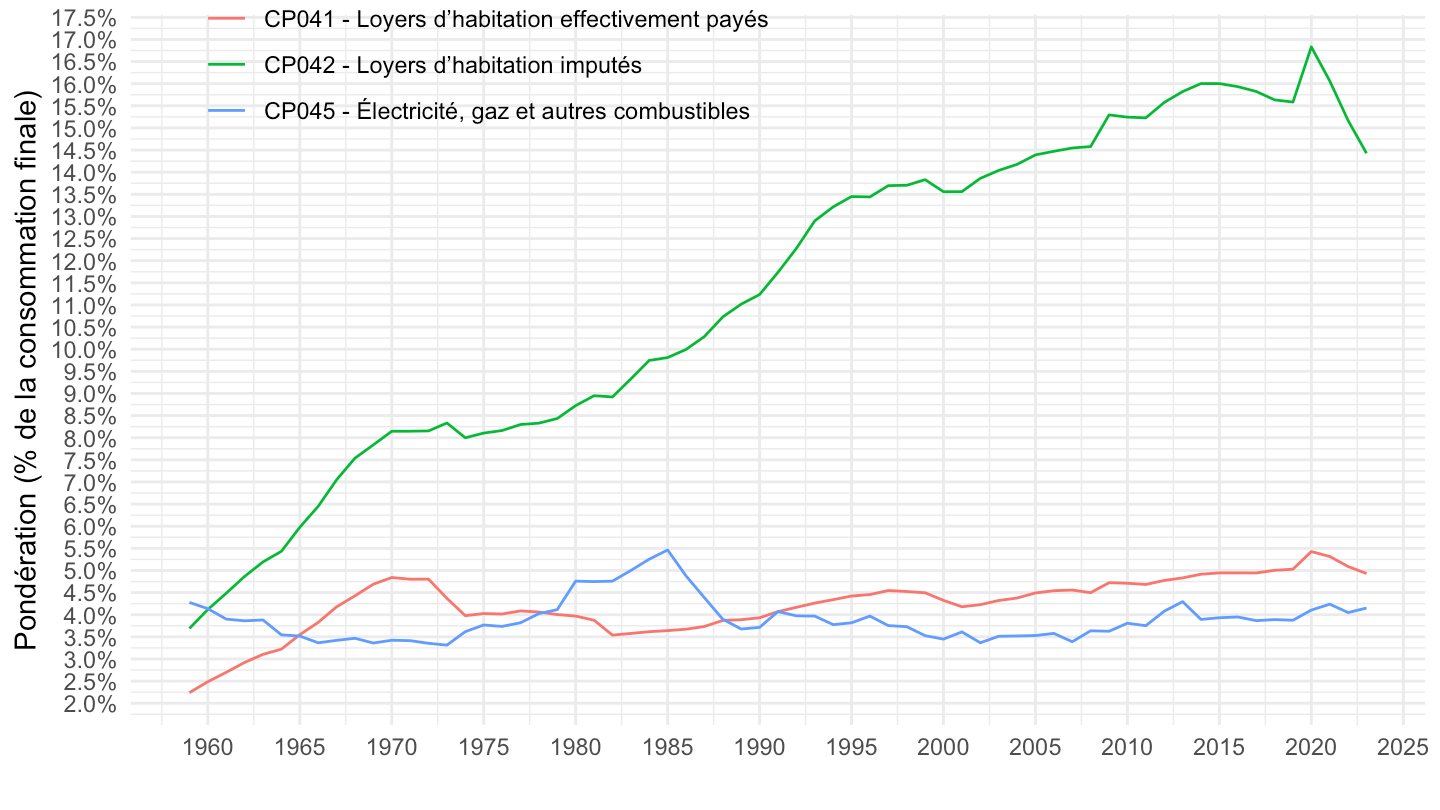
T_CONSO_EFF_FONCTION |>
  filter(variable == "COEFFCOUR",
         fonction %in% c("CP142", "06", "CP1253", "CPDEP")) |>
  year_to_date2() |>
  mutate(value = value / 100) |>
  ggplot() + ylab("Pondération (% de la conso effective totale)") + xlab("") + theme_minimal() +
  geom_line(aes(x = date, y = value, color = paste0(fonction, " - ", Fonction))) +

  scale_x_date(breaks = seq(1920, 2100, 5) |> paste0("-01-01") |> as.Date(),
               labels = date_format("%Y")) +
  theme(legend.position = c(0.25, 0.93),
        legend.title = element_blank()) +
  scale_y_continuous(breaks = 0.01*seq(0, 300, .5),
                     labels = percent_format(accuracy = .1))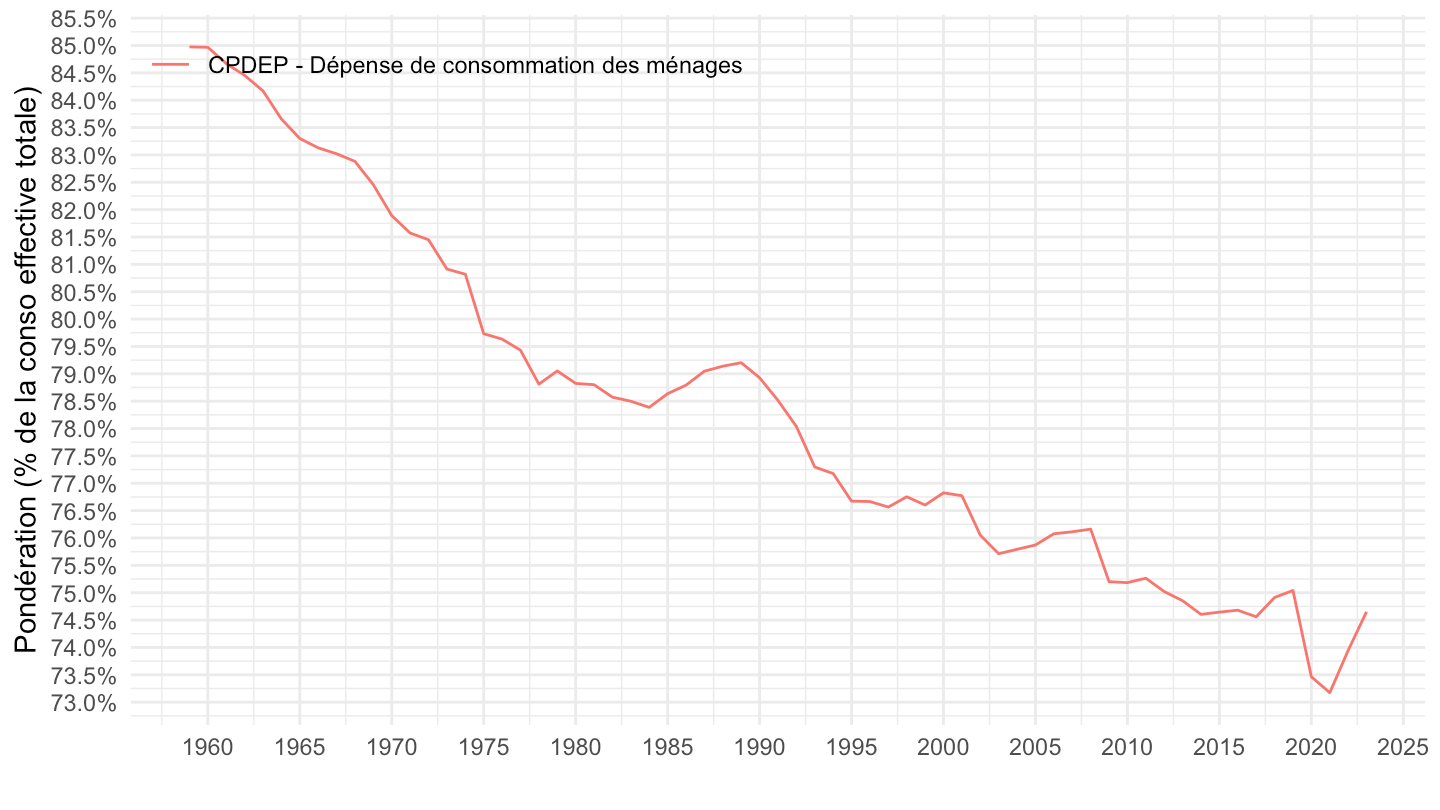
T_CONSO_EFF_FONCTION |>
  filter(variable == "COEFFCOUR",
         year %in% c("1960", "1990", "2020")) |>
  select(-variable) |>
  group_by(year) |>
  arrange(fonction) |>
  mutate(value = round(100*value/value[fonction =="CPDEP"],2)) |>
  spread(year, value) |>
print_table_conditional()T_CONSO_EFF_FONCTION |>
filter(variable == "COEFFCOUR",
year %in% c("1960", "1990", "2020"),
nchar(fonction) == 4 | fonction =="CPDEP") |>
select(-variable) |>
group_by(year) |>
arrange(fonction) |>
mutate(value = round(100*value/value[fonction =="CPDEP"],2)) |>
spread(year, value) |>
print_table_conditional()| fonction | Fonction | 1960 | 1990 | 2020 |
|---|---|---|---|---|
| CP01 | Produits alimentaires et boissons non alcoolisées | 23.15 | 13.75 | 13.63 |
| CP02 | Boissons alcoolisées, tabac et stupéfiants | 7.91 | 3.50 | 4.28 |
| CP03 | Articles d’habillement et chaussures | 12.19 | 7.14 | 3.20 |
| CP04 | Logement, eau, gaz, électricité et autres combustibles | 12.76 | 21.81 | 30.19 |
| CP05 | Meubles, articles de ménage et entretien courant du foyer | 8.48 | 5.63 | 4.51 |
| CP06 | Santé | 2.37 | 3.30 | 3.94 |
| CP07 | Transports | 10.39 | 14.38 | 10.91 |
| CP08 | Information et communication | 1.43 | 3.40 | 4.16 |
| CP09 | Loisirs, sport et culture | 6.48 | 7.39 | 6.29 |
| CP10 | Services de l’enseignement | 0.55 | 0.63 | 0.78 |
| CP11 | Restaurants et services d’hébergement | 5.83 | 6.04 | 5.66 |
| CP12 | Assurance et services financiers | 2.83 | 7.47 | 6.44 |
| CP13 | Soins corporels, protection sociale et biens et services divers | 4.80 | 6.22 | 6.08 |
| CP14 | Dépenses de consommation individuelle à la charge des institutions sans but lucratif au service des ménages (ISBLSM) | 3.39 | 2.85 | 4.38 |
| CP15 | Dépenses de consommation individuelle à la charge des administrations publiques | 14.31 | 23.85 | 31.74 |
| CP16 | Solde territorial | 0.84 | -0.66 | -0.08 |
| CPDEP | Dépense de consommation des ménages | 100.00 | 100.00 | 100.00 |
T_CONSO_EFF_FONCTION |>
  filter(variable == "COEFFCOUR",
         year %in% c("1960", "1990", "2020"),
         nchar(fonction) == 5 | fonction =="CPDEP") |>
  select(-variable) |>
  group_by(year) |>
  arrange(fonction) |>
  mutate(value = round(100*value/value[fonction =="CPDEP"],2)) |>
  spread(year, value) |>
print_table_conditional()T_CONSO_EFF_FONCTION |>
filter(variable == "COEFFCOUR",
year %in% c("1960", "1990", "2020"),
nchar(fonction) == 6 | fonction =="CPDEP") |>
select(-variable) |>
group_by(year) |>
arrange(fonction) |>
mutate(value = round(100*value/value[fonction =="CPDEP"],2)) |>
spread(year, value) |>
print_table_conditional()deflateur <- T_CONSO_EFF_FONCTION |>
filter(variable == "IPRIX2020",
year %in% c("1990", "2020"),
nchar(fonction) %in% c(4, 5, 6)) |>
mutate(fonction = gsub("\\.", "", fonction)) |>
select(fonction, Fonction, year, value) |>
spread(year, value) |>
mutate(`Déflateur (%)` = round(100*((`2020`/`1990`)^(1/30)-1),2)) |>
select(-`1990`, -`2020`)
deflateur |>
print_table_conditional()deflateur_poids <- T_CONSO_EFF_FONCTION |>
filter(variable == "COEFFCOUR",
year %in% c("2020"),
nchar(fonction) %in% c(4, 5, 6)) |>
mutate(fonction = gsub("\\.", "", fonction)) |>
select(fonction, Fonction, year, value) |>
spread(year, value) |>
rename(`Déflateur Poids` = `2020`)
deflateur_poids |>
print_table_conditional()IPC <- `IPC-2015` |>
filter(INDICATEUR == "IPC",
MENAGES_IPC == "ENSEMBLE",
FREQ == "M",
REF_AREA == "FE",
NATURE == "INDICE",
TIME_PERIOD %in% c("1990-01", "2020-01")) |>
left_join(COICOP2016, by = "COICOP2016") |>
select(fonction = COICOP2016, Fonction = Coicop2016, TIME_PERIOD, OBS_VALUE) |>
filter(!(fonction %in% c("SO", "00"))) |>
spread(TIME_PERIOD, OBS_VALUE) |>
mutate(`IPC (%)` = round(100*((`2020-01`/`1990-01`)^(1/30)-1),2)) |>
select(-`1990-01`, -`2020-01`)
IPC |>
print_table_conditional()IPC_poids <- `IPC-2015` |>
filter(INDICATEUR == "IPC",
REF_AREA == "FE",
MENAGES_IPC == "ENSEMBLE",
NATURE == "POND",
TIME_PERIOD %in% c("2020")) |>
left_join(COICOP2016, by = "COICOP2016") |>
select(fonction = COICOP2016, Fonction = Coicop2016, TIME_PERIOD, OBS_VALUE) |>
filter(!(fonction %in% c("SO", "00"))) |>
mutate(OBS_VALUE = OBS_VALUE/100) |>
spread(TIME_PERIOD, OBS_VALUE) |>
rename(`IPC Poids` = `2020`)
IPC_poids |>
print_table_conditional()deflateur |>
inner_join(IPC, by = "fonction") |>
mutate(Difference = `Déflateur (%)`-`IPC (%)`) |>
arrange(Difference) |>
print_table_conditional()| fonction | Fonction.x | Déflateur (%) | Fonction.y | IPC (%) | Difference |
|---|---|---|---|---|---|
| character(0) | c(":--------:", ":----------:", ":-------------:", ":----------:", ":-------:", ":----------:") | character(0) | c(":--------:", ":----------:", ":-------------:", ":----------:", ":-------:", ":----------:") | character(0) | c(":--------:", ":----------:", ":-------------:", ":----------:", ":-------:", ":----------:") |
deflateur |>
  inner_join(IPC, by = "fonction") |>
  filter(nchar(fonction) == 2) |>
  mutate(Difference = `Déflateur (%)`-`IPC (%)`) |>
  arrange(Difference) |>
print_table_conditional()| fonction | Fonction.x | Déflateur (%) | Fonction.y | IPC (%) | Difference |
|---|---|---|---|---|---|
| character(0) | c(":--------:", ":----------:", ":-------------:", ":----------:", ":-------:", ":----------:") | character(0) | c(":--------:", ":----------:", ":-------------:", ":----------:", ":-------:", ":----------:") | character(0) | c(":--------:", ":----------:", ":-------------:", ":----------:", ":-------:", ":----------:") |
deflateur |>
  inner_join(IPC, by = "fonction") |>
  filter(nchar(fonction) == 3) |>
  mutate(Difference = `Déflateur (%)`-`IPC (%)`) |>
  arrange(Difference) |>
print_table_conditional()| fonction | Fonction.x | Déflateur (%) | Fonction.y | IPC (%) | Difference |
|---|---|---|---|---|---|
| character(0) | c(":--------:", ":----------:", ":-------------:", ":----------:", ":-------:", ":----------:") | character(0) | c(":--------:", ":----------:", ":-------------:", ":----------:", ":-------:", ":----------:") | character(0) | c(":--------:", ":----------:", ":-------------:", ":----------:", ":-------:", ":----------:") |
deflateur |>
  inner_join(IPC, by = "fonction") |>
  filter(nchar(fonction) == 4) |>
  mutate(Difference = `Déflateur (%)`-`IPC (%)`) |>
  arrange(Difference) |>
print_table_conditional()| fonction | Fonction.x | Déflateur (%) | Fonction.y | IPC (%) | Difference |
|---|---|---|---|---|---|
| character(0) | c(":--------:", ":----------:", ":-------------:", ":----------:", ":-------:", ":----------:") | character(0) | c(":--------:", ":----------:", ":-------------:", ":----------:", ":-------:", ":----------:") | character(0) | c(":--------:", ":----------:", ":-------------:", ":----------:", ":-------:", ":----------:") |
deflateur_poids |>
  inner_join(IPC_poids, by = "fonction") |>
  mutate(Difference = `Déflateur Poids`-`IPC Poids`) |>
  arrange(Difference) |>
print_table_conditional()| fonction | Fonction.x | Déflateur Poids | Fonction.y | IPC Poids | Difference |
|---|---|---|---|---|---|
| character(0) | c(":--------:", ":----------:", ":---------------:", ":----------:", ":---------:", ":----------:") | character(0) | c(":--------:", ":----------:", ":---------------:", ":----------:", ":---------:", ":----------:") | character(0) | c(":--------:", ":----------:", ":---------------:", ":----------:", ":---------:", ":----------:") |
T_CONSO_EFF_FONCTION |>
  filter(Fonction %in% c("Dépense de consommation des ménages"),
         variable == "IPRIX2020") |>
  year_to_date2() |>
  filter(date >= as.Date("1996-01-01")) |>
  select(variable = Fonction, date, value) |>
  mutate(variable = paste0("Déflateur de la ", variable)) |>
  bind_rows(`IPC-2015` |>
              filter(INDICATEUR == "IPC",
                     MENAGES_IPC == "ENSEMBLE",
                     COICOP2016 %in% c("00"),
                     FREQ == "A",
                     PRIX_CONSO == "SO",
                     REF_AREA == "FE",
                     NATURE == "INDICE") |>
              year_to_date() |>
              mutate(variable = "Indice des Prix à la Consommation (IPC)") |>
              select(variable, date, value = OBS_VALUE)) |>
  bind_rows(`IPCH-2015` |>
              filter(INDICATEUR == "IPCH",
                     COICOP2016 %in% c("00"),
                     FREQ == "A",
                     REF_AREA == "FE",
                     NATURE == "INDICE") |>
              year_to_date() |>
              mutate(variable = "Indice des Prix à la Consommation Harmonisé (IPCH)") |>
              select(variable, date, value = OBS_VALUE)) |>
  group_by(variable) |>
  filter(date >= as.Date("1996-01-01")) |>
  mutate(value = 100*value/value[date == as.Date("1996-01-01")]) |>
  mutate(variable = gsub("Indice des prix à la consommation - Base 2015 - Ensemble des ménages - France - ", "", variable)) |>
  ggplot() + ylab("Indice des prix") + xlab("") + theme_minimal() +
  geom_line(aes(x = date, y = value, color = variable)) +
  #
  scale_x_date(breaks = seq(1920, 2100, 2) |> paste0("-01-01") |> as.Date(),
               labels = date_format("%Y")) +
  theme(legend.position = c(0.35, 0.8),
        legend.title = element_blank()) +
  scale_y_log10(breaks = seq(0, 500, 10),
                     labels = dollar_format(accuracy = 1, prefix = ""))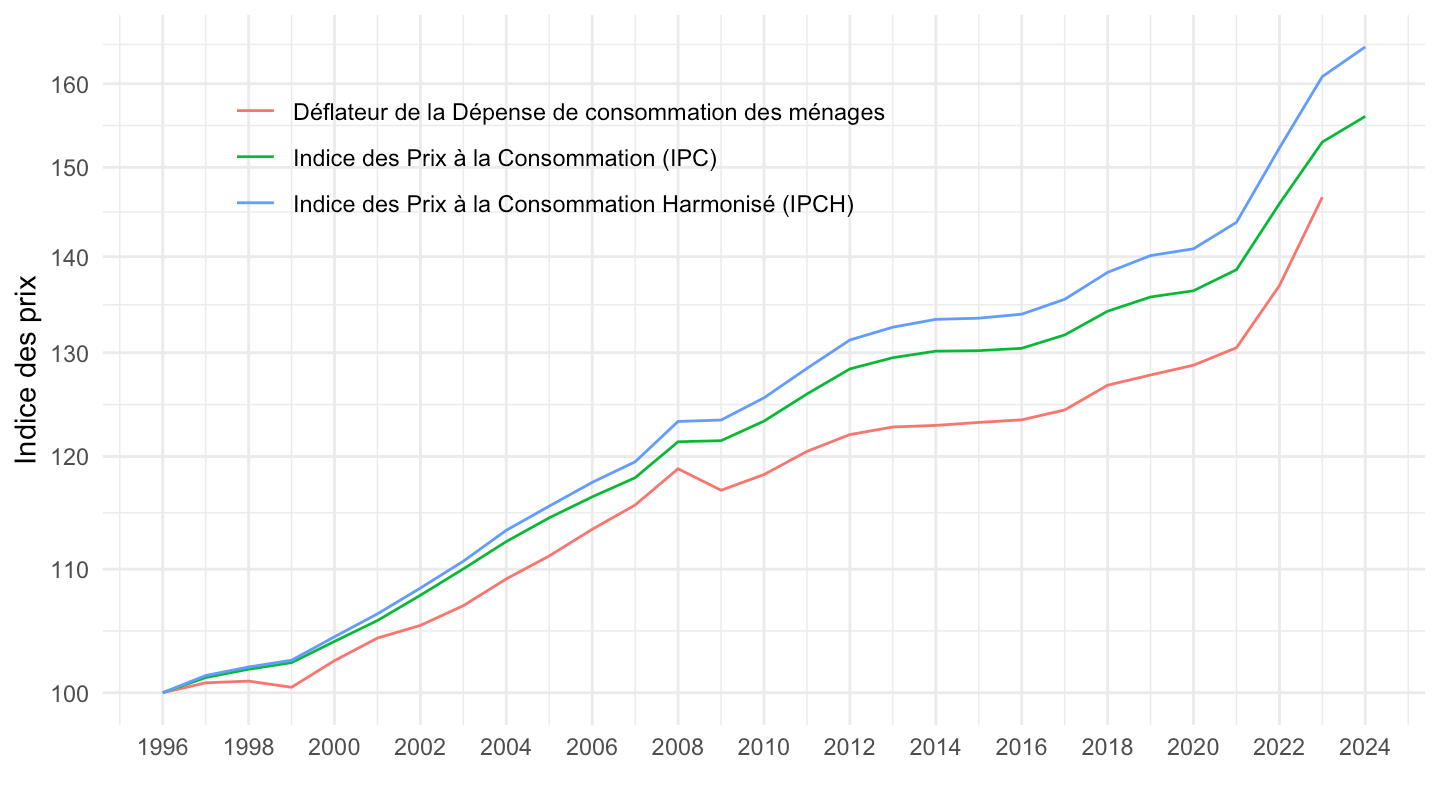
T_CONSO_EFF_FONCTION |>
  filter(Fonction %in% c("Consommation effective des ménages",
                         "Dépense de consommation des ménages",
                         "Dépense de consommation des ménages hors SIFIM"),
         variable == "IPRIX2020") |>
  mutate(Fonction = ifelse(fonction =="Consommation effective des ménages",
                           "Dépense de consommation effective des ménages",
                           Fonction)) |>
  year_to_date2() |>
  filter(date >= as.Date("1996-01-01")) |>
  select(variable = Fonction, date, value) |>
  mutate(variable = paste0("Déflateur de la ", variable)) |>
  bind_rows(`IPC-2015` |>
              filter(INDICATEUR == "IPC",
                     MENAGES_IPC == "ENSEMBLE",
                     COICOP2016 %in% c("00"),
                     FREQ == "A",
                     PRIX_CONSO == "SO",
                     REF_AREA == "FE",
                     NATURE == "INDICE") |>
              year_to_date() |>
              mutate(variable = "Indice des Prix à la Consommation (IPC)") |>
              select(variable, date, value = OBS_VALUE)) |>
  bind_rows(`IPCH-2015` |>
              filter(INDICATEUR == "IPCH",
                     COICOP2016 %in% c("00"),
                     FREQ == "A",
                     REF_AREA == "FE",
                     NATURE == "INDICE") |>
              year_to_date() |>
              mutate(variable = "Indice des Prix à la Consommation Harmonisé (IPCH)") |>
              select(variable, date, value = OBS_VALUE)) |>
  group_by(variable) |>
  filter(date >= as.Date("1996-01-01")) |>
  mutate(value = 100*value/value[date == as.Date("1996-01-01")]) |>
  mutate(variable = gsub("Indice des prix à la consommation - Base 2015 - Ensemble des ménages - France - ", "", variable)) |>
  ggplot() + ylab("Indice des prix") + xlab("") + theme_minimal() +
  geom_line(aes(x = date, y = value, color = variable)) +
  #
  scale_x_date(breaks = seq(1920, 2100, 2) |> paste0("-01-01") |> as.Date(),
               labels = date_format("%Y")) +
  theme(legend.position = c(0.35, 0.8),
        legend.title = element_blank()) +
  scale_y_log10(breaks = seq(0, 500, 10),
                     labels = dollar_format(accuracy = 1, prefix = ""))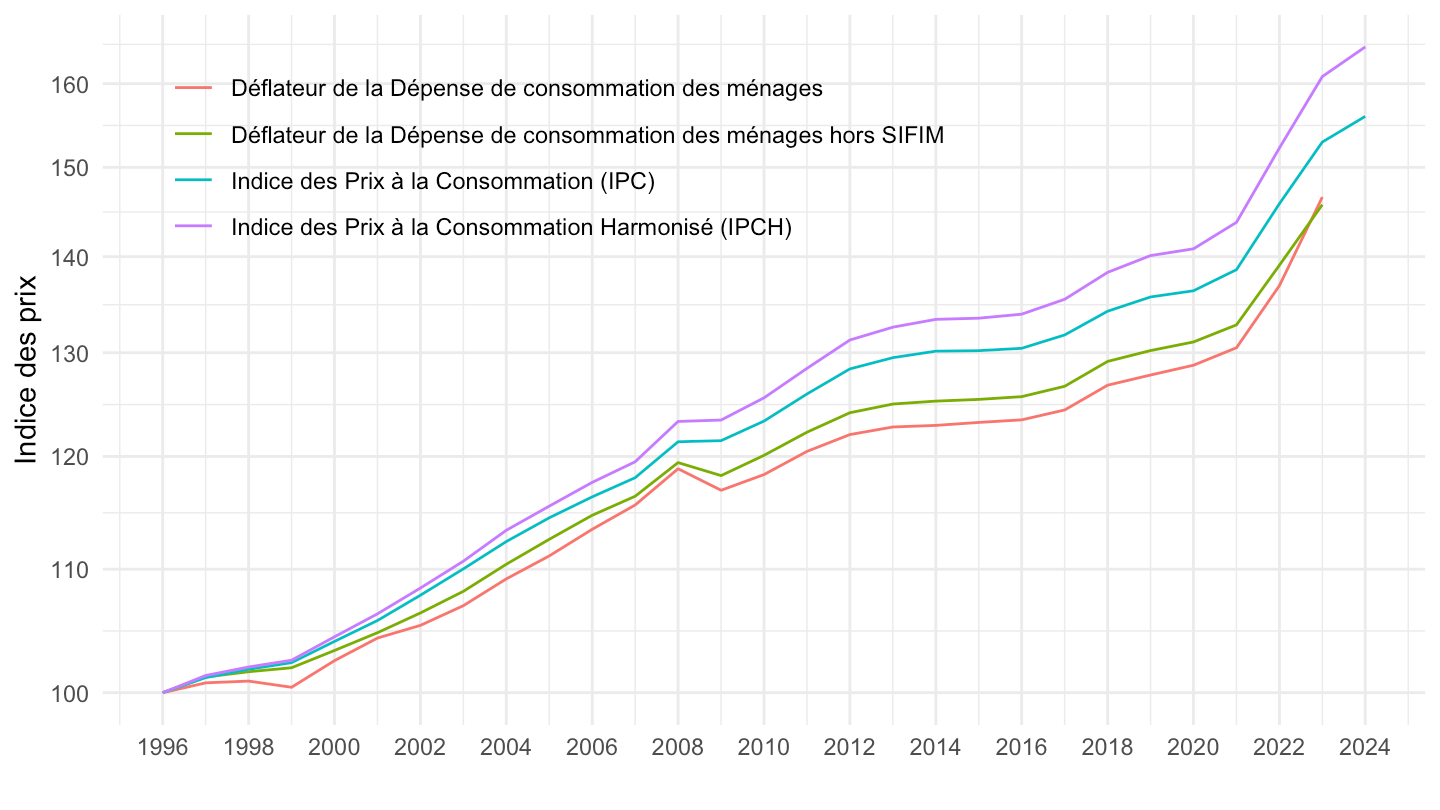
T_CONSO_EFF_FONCTION |>
  filter(Fonction %in% c("Consommation effective des ménages",
                         "Dépense de consommation des ménages",
                         "Dépense de consommation des ménages hors SIFIM"),
         variable == "IPRIX2020") |>
  mutate(Fonction = ifelse(fonction =="Consommation effective des ménages",
                           "Dépense de consommation effective des ménages",
                           Fonction)) |>
  year_to_date2() |>
  filter(date >= as.Date("2000-01-01")) |>
  select(variable = Fonction, date, value) |>
  mutate(variable = paste0("Déflateur de la ", variable)) |>
  bind_rows(`IPC-2015` |>
              filter(INDICATEUR == "IPC",
                     MENAGES_IPC == "ENSEMBLE",
                     COICOP2016 %in% c("00"),
                     FREQ == "M",
                     PRIX_CONSO == "SO",
                     REF_AREA == "FE",
                     NATURE == "INDICE") |>
              month_to_date() |>
              filter(month(date) == 1) |>
              mutate(variable = "Indice des Prix à la Consommation (IPC)") |>
              select(variable, date, value = OBS_VALUE)) |>
  bind_rows(`IPCH-2015` |>
              filter(INDICATEUR == "IPCH",
                     COICOP2016 %in% c("00"),
                     FREQ == "M",
                     REF_AREA == "FE",
                     NATURE == "INDICE") |>
              month_to_date() |>
              filter(month(date) == 1) |>
              mutate(variable = "Indice des Prix à la Consommation Harmonisé (IPCH)") |>
              select(variable, date, value = OBS_VALUE)) |>
  group_by(variable) |>
  filter(date >= as.Date("2000-01-01")) |>
  mutate(value = 100*value/value[date == as.Date("2000-01-01")]) |>
  mutate(variable = gsub("Indice des prix à la consommation - Base 2015 - Ensemble des ménages - France - ", "", variable)) |>
  ggplot() + ylab("Indice des prix") + xlab("") + theme_minimal() +
  geom_line(aes(x = date, y = value, color = variable)) +
  #
  scale_x_date(breaks = seq(1920, 2100, 2) |> paste0("-01-01") |> as.Date(),
               labels = date_format("%Y")) +
  theme(legend.position = c(0.3, 0.8),
        legend.title = element_blank()) +
  scale_y_log10(breaks = seq(0, 500, 10),
                     labels = dollar_format(accuracy = 1, prefix = ""))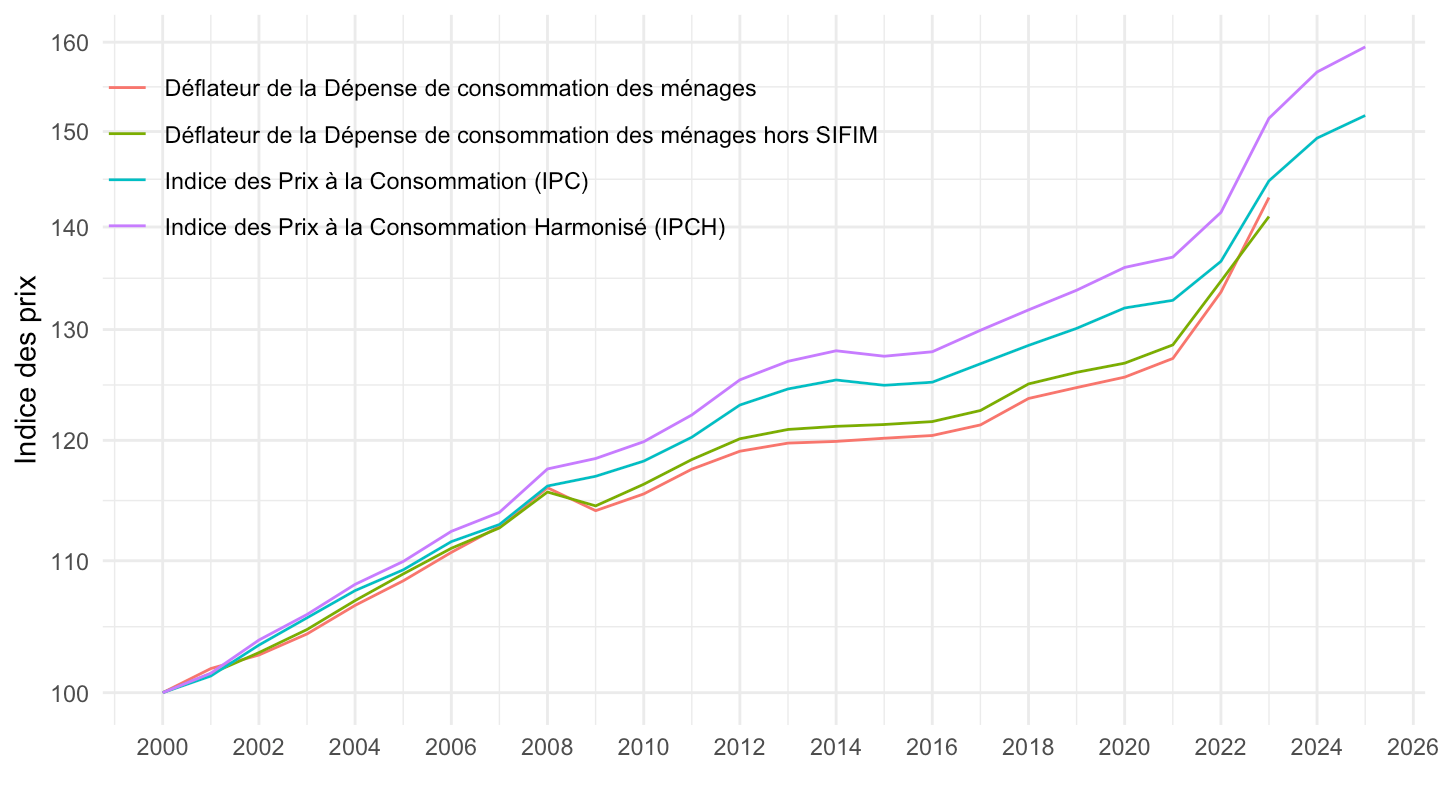
T_CONSO_EFF_FONCTION |>
  filter(Fonction %in% c("Consommation effective des ménages",
                         "Dépense de consommation des ménages",
                         "Dépense de consommation des ménages hors SIFIM"),
         variable == "IPRIX2020") |>
  mutate(Fonction = ifelse(fonction =="Consommation effective des ménages",
                           "Dépense de consommation effective des ménages",
                           Fonction)) |>
  year_to_date2() |>
  filter(date >= as.Date("2017-01-01")) |>
  select(variable = Fonction, date, value) |>
  mutate(variable = paste0("Déflateur de la ", variable)) |>
  bind_rows(`IPC-2015` |>
              filter(INDICATEUR == "IPC",
                     MENAGES_IPC == "ENSEMBLE",
                     COICOP2016 %in% c("00"),
                     FREQ == "M",
                     PRIX_CONSO == "SO",
                     REF_AREA == "FE",
                     NATURE == "INDICE") |>
              month_to_date() |>
              filter(month(date) == 1) |>
              mutate(variable = "Indice des Prix à la Consommation (IPC)") |>
              select(variable, date, value = OBS_VALUE)) |>
  bind_rows(`IPCH-2015` |>
              filter(INDICATEUR == "IPCH",
                     COICOP2016 %in% c("00"),
                     FREQ == "M",
                     REF_AREA == "FE",
                     NATURE == "INDICE") |>
              month_to_date() |>
              filter(month(date) == 1) |>
              mutate(variable = "Indice des Prix à la Consommation Harmonisé (IPCH)") |>
              select(variable, date, value = OBS_VALUE)) |>
  group_by(variable) |>
  filter(date >= as.Date("2017-01-01")) |>
  mutate(value = 100*value/value[date == as.Date("2017-01-01")]) |>
  mutate(variable = gsub("Indice des prix à la consommation - Base 2015 - Ensemble des ménages - France - ", "", variable)) |>
  ggplot() + ylab("Indice des prix") + xlab("") + theme_minimal() +
  geom_line(aes(x = date, y = value, color = variable)) +
  #
  scale_x_date(breaks = seq(1920, 2100, 1) |> paste0("-01-01") |> as.Date(),
               labels = date_format("%Y")) +
  theme(legend.position = c(0.35, 0.8),
        legend.title = element_blank()) +
  scale_y_log10(breaks = seq(0, 500, 1),
                     labels = dollar_format(accuracy = 1, prefix = ""))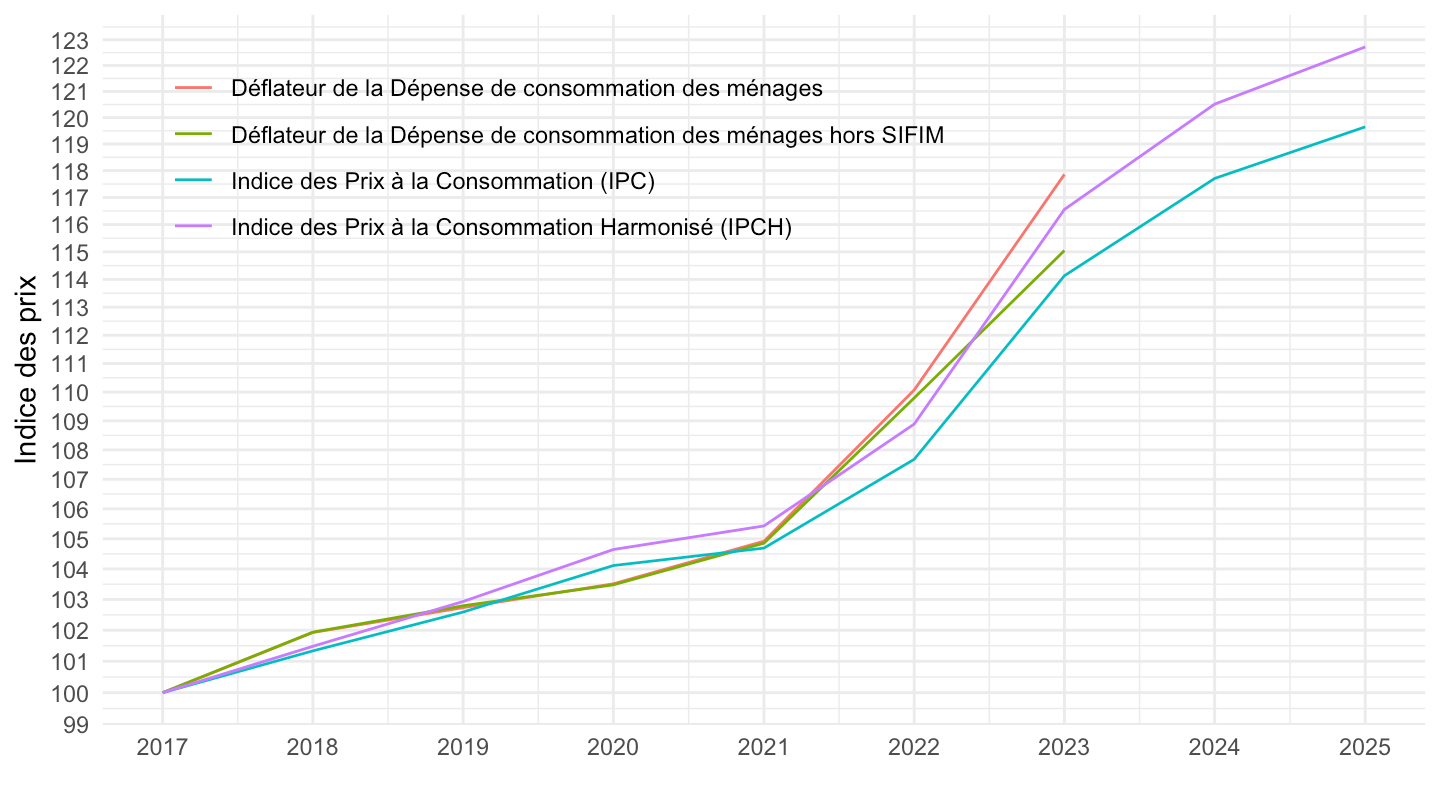
T_CONSO_EFF_FONCTION |>
  filter(Fonction %in% c("Consommation effective des ménages",
                         "Dépense de consommation des ménages",
                         "Dépense de consommation des ménages hors SIFIM"),
         variable == "IPRIX2020") |>
  year_to_date2() |>
  filter(date >= as.Date("1990-01-01")) |>
  select(variable = Fonction, date, value) |>
  bind_rows(`IPC-2015` |>
              filter(INDICATEUR == "IPC",
                     MENAGES_IPC == "ENSEMBLE",
                     COICOP2016 %in% c("00"),
                     FREQ == "M",
                     REF_AREA == "FE",
                     NATURE == "INDICE") |>
              month_to_date() |>
  filter(month(date) == 1) |>
  select(variable = TITLE_FR, date, value = OBS_VALUE)
  ) |>
  group_by(variable) |>
  mutate(value = 100*value/value[date == as.Date("1990-01-01")]) |>
  mutate(variable = gsub("Indice des prix à la consommation - Base 2015 - Ensemble des ménages - France - ", "", variable)) |>
  ggplot() + ylab("Indice des prix") + xlab("") + theme_minimal() +
  geom_line(aes(x = date, y = value, color = variable)) +
  #
  scale_x_date(breaks = seq(1920, 2100, 5) |> paste0("-01-01") |> as.Date(),
               labels = date_format("%Y")) +
  theme(legend.position = c(0.25, 0.8),
        legend.title = element_blank()) +
  scale_y_log10(breaks = seq(0, 500, 10),
                     labels = dollar_format(accuracy = 1, prefix = ""))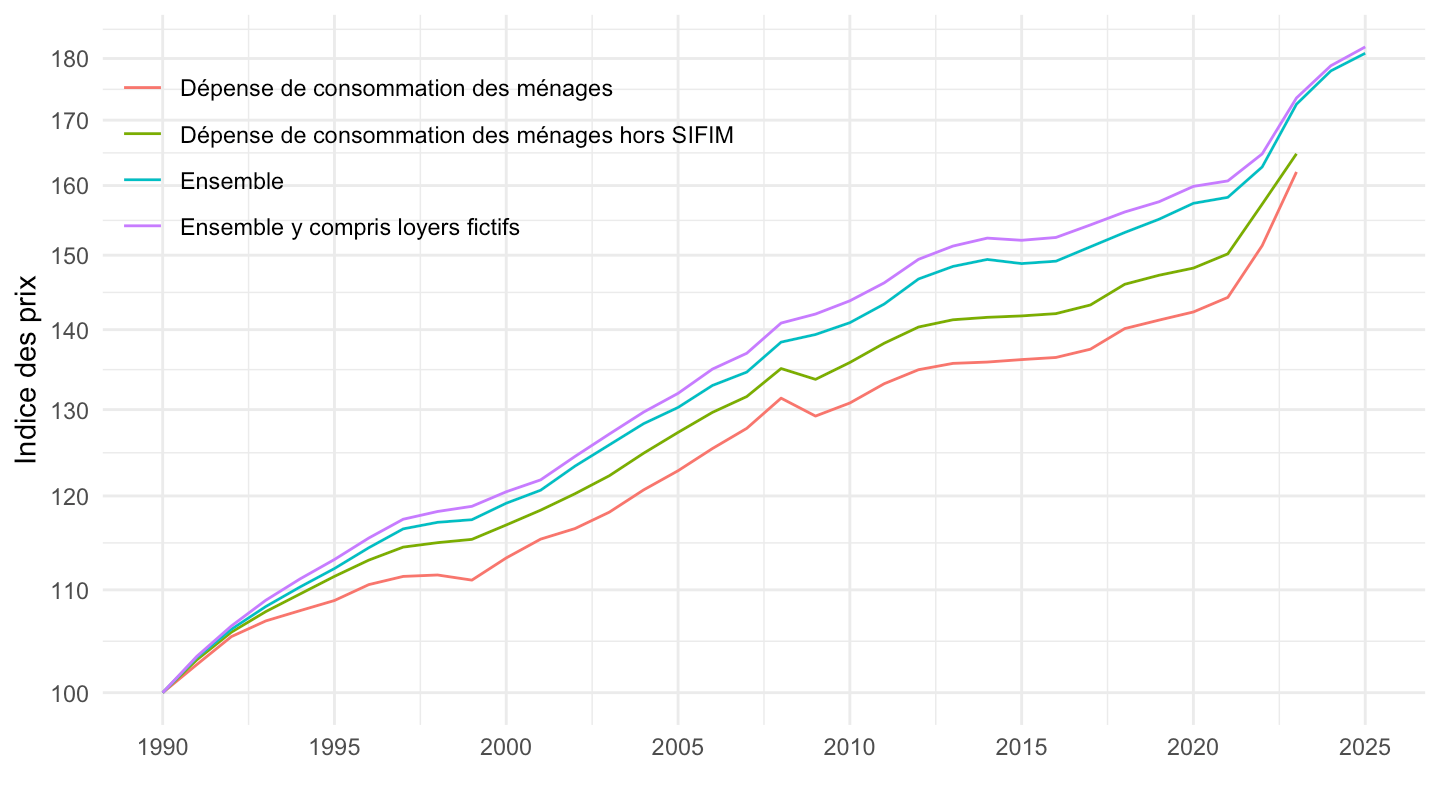
T_CONSO_EFF_FONCTION |>
  filter(Fonction %in% c("Consommation effective des ménages",
                         "Dépense de consommation des ménages",
                         "Dépense de consommation des ménages hors SIFIM"),
         variable == "IPRIX2020") |>
  year_to_date2() |>
  filter(date >= as.Date("1996-01-01")) |>
  select(variable = Fonction, date, value) |>
  bind_rows(`IPC-2015` |>
              filter(INDICATEUR == "IPC",
                     MENAGES_IPC == "ENSEMBLE",
                     COICOP2016 %in% c("00"),
                     FREQ == "A",
                     REF_AREA == "FE",
                     NATURE == "INDICE") |>
              year_to_date() |>
              filter(date >= as.Date("1996-01-01")) |>
              select(variable = TITLE_FR, date, value = OBS_VALUE)
            ) |>
  group_by(variable) |>
  mutate(value = 100*value/value[date == as.Date("1996-01-01")]) |>
  mutate(variable = gsub("Indice des prix à la consommation - Base 2015 - Ensemble des ménages - France - ", "", variable)) |>
  ggplot() + ylab("Indice des prix") + xlab("") + theme_minimal() +
  geom_line(aes(x = date, y = value, color = variable)) +
  #
  scale_x_date(breaks = seq(1920, 2100, 2) |> paste0("-01-01") |> as.Date(),
               labels = date_format("%Y")) +
  theme(legend.position = c(0.25, 0.8),
        legend.title = element_blank()) +
  scale_y_log10(breaks = seq(0, 500, 10),
                     labels = dollar_format(accuracy = 1, prefix = ""))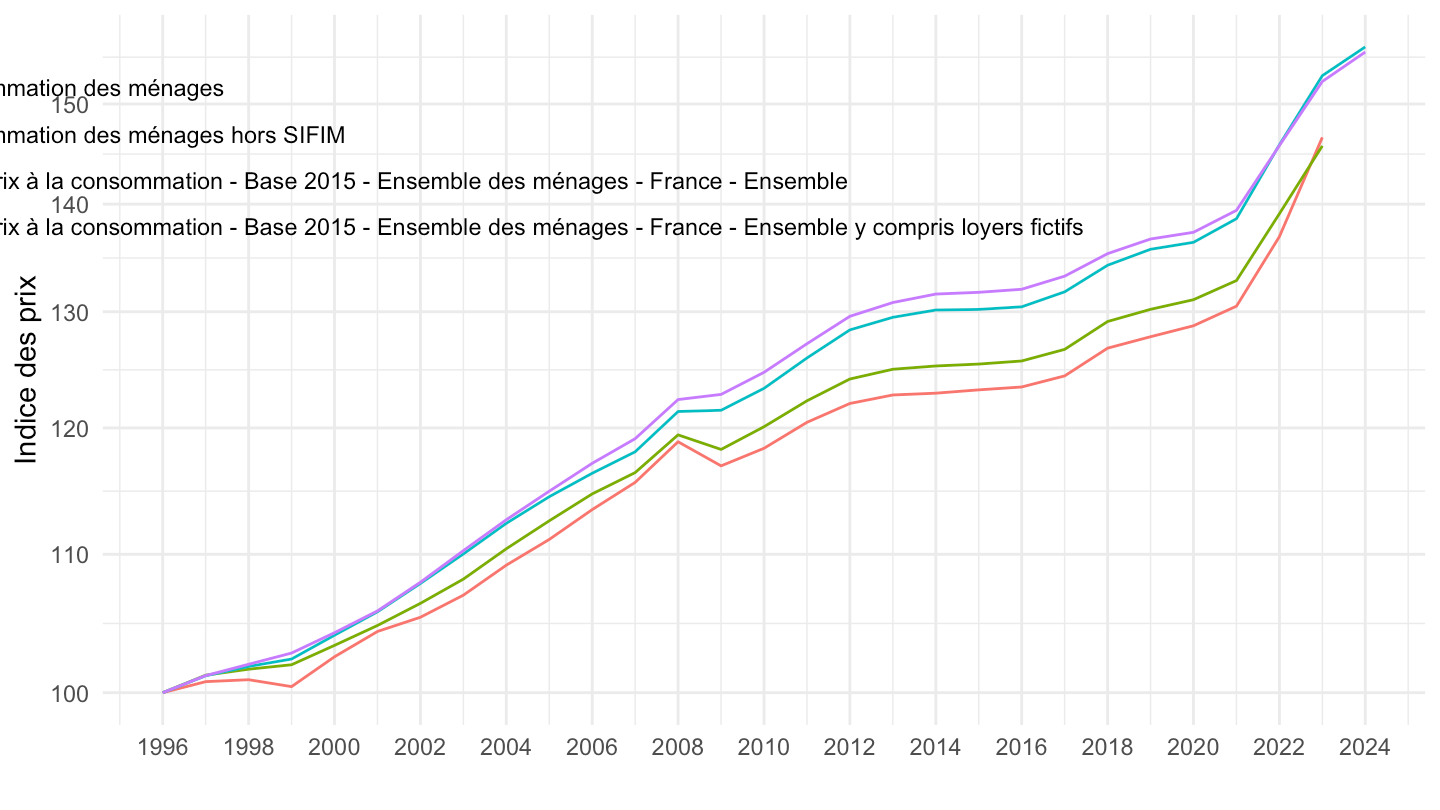
T_CONSO_EFF_FONCTION |>
  filter(fonction =="CP01",
         variable == "IPRIX2020") |>
  year_to_date2() |>
  filter(date >= as.Date("1990-01-01")) |>
  mutate(variable = "Deflateur de la Consommation") |>
  select(variable, date, value) |>
  bind_rows(`IPC-2015` |>
              filter(INDICATEUR == "IPC",
                     MENAGES_IPC == "ENSEMBLE",
                     COICOP2016 %in% c("01"),
                     FREQ == "A",
                     REF_AREA == "FE",
                     NATURE == "INDICE") |>
              year_to_date() |>
              select(date, value = OBS_VALUE) |>
              mutate(variable = "Indice des Prix à la Consommation")) |>
  bind_rows(`IPCH-2015` |>
              filter(INDICATEUR == "IPCH",
                     COICOP2016 %in% c("01"),
                     FREQ == "A",
                     REF_AREA == "FE",
                     NATURE == "INDICE") |>
              year_to_date() |>
              select(date, value = OBS_VALUE) |>
              mutate(variable = "Indice des Prix à la Consommation Harmonisé")) |>
  group_by(variable) |>
  mutate(value = 100*value/value[date == as.Date("1996-01-01")]) |>
  ggplot() + ylab("Indice des prix") + xlab("") + theme_minimal() +
  geom_line(aes(x = date, y = value, color = variable)) +

  scale_x_date(breaks = seq(1920, 2100, 5) |> paste0("-01-01") |> as.Date(),
               labels = date_format("%Y")) +
  theme(legend.position = c(0.75, 0.3),
        legend.title = element_blank()) +
  scale_y_log10(breaks = seq(0, 500, 10),
                     labels = dollar_format(accuracy = 1, prefix = ""))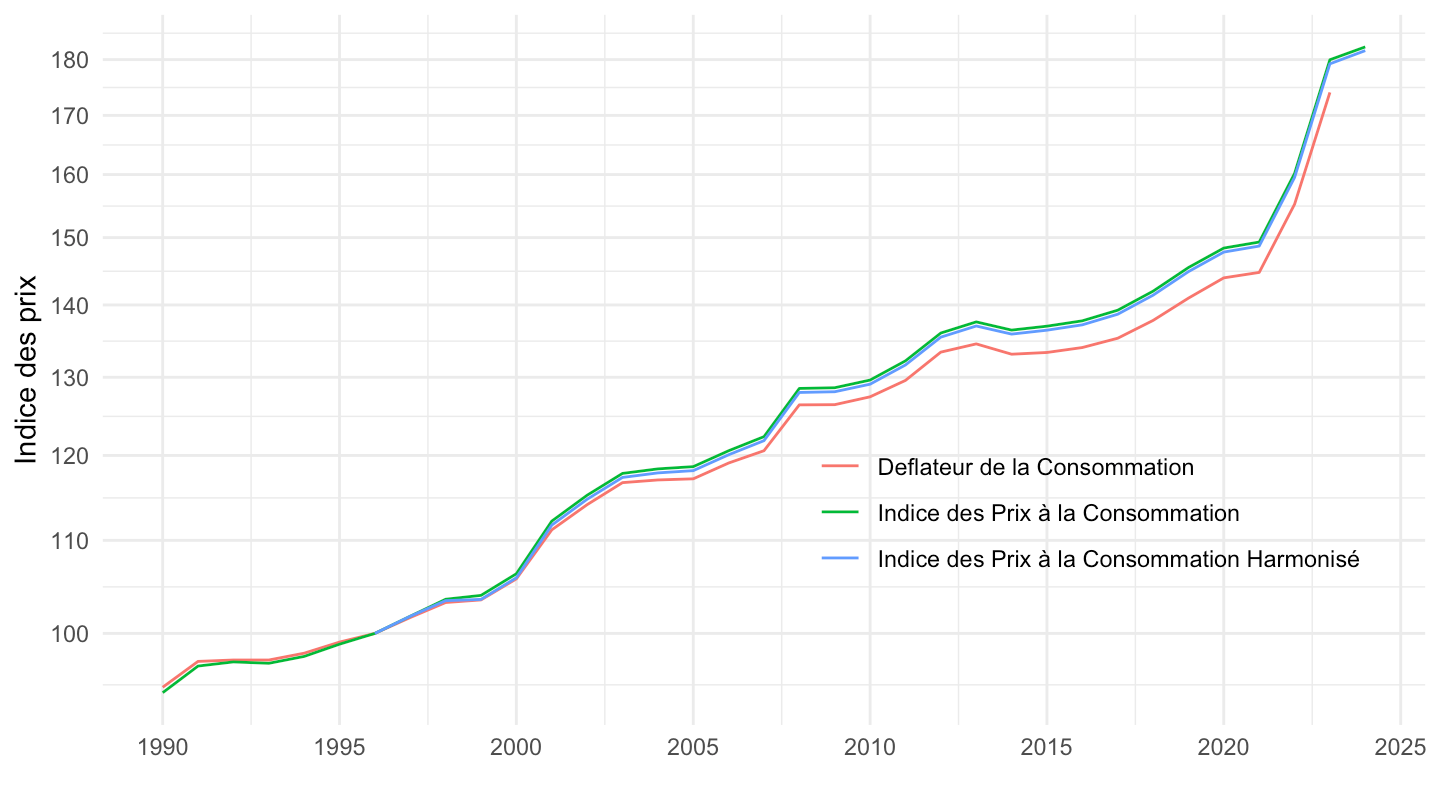
T_CONSO_EFF_FONCTION |>
  filter(fonction =="CP02",
         variable == "IPRIX2020") |>
  year_to_date2() |>
  filter(date >= as.Date("1990-01-01")) |>
  mutate(variable = "Deflateur de la Consommation") |>
  select(variable, date, value) |>
  bind_rows(`IPC-2015` |>
              filter(INDICATEUR == "IPC",
                     MENAGES_IPC == "ENSEMBLE",
                     COICOP2016 %in% c("02"),
                     FREQ == "A",
                     REF_AREA == "FE",
                     NATURE == "INDICE") |>
              year_to_date() |>
              select(date, value = OBS_VALUE) |>
              mutate(variable = "Indice des Prix à la Consommation")) |>
  bind_rows(`IPCH-2015` |>
              filter(INDICATEUR == "IPCH",
                     COICOP2016 %in% c("02"),
                     FREQ == "A",
                     REF_AREA == "FE",
                     NATURE == "INDICE") |>
              year_to_date() |>
              select(date, value = OBS_VALUE) |>
              mutate(variable = "Indice des Prix à la Consommation Harmonisé")) |>
  group_by(variable) |>
  mutate(value = 100*value/value[date == as.Date("1996-01-01")]) |>
  ggplot() + ylab("Indice des prix") + xlab("") + theme_minimal() +
  geom_line(aes(x = date, y = value, color = variable)) +

  scale_x_date(breaks = seq(1920, 2100, 5) |> paste0("-01-01") |> as.Date(),
               labels = date_format("%Y")) +
  theme(legend.position = c(0.75, 0.3),
        legend.title = element_blank()) +
  scale_y_log10(breaks = seq(0, 500, 10),
                     labels = dollar_format(accuracy = 1, prefix = ""))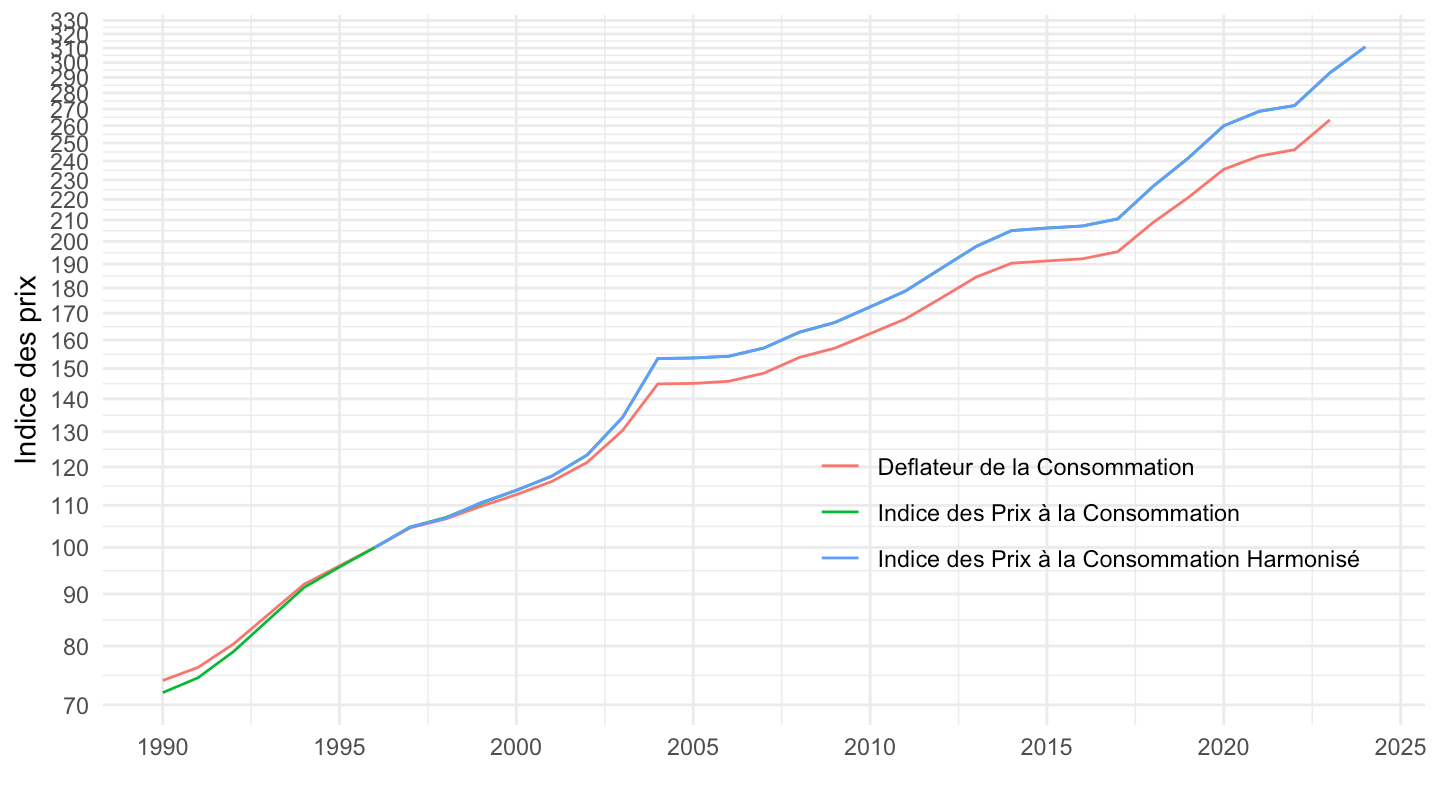
T_CONSO_EFF_FONCTION |>
  filter(fonction =="CP03",
         variable == "IPRIX2020") |>
  year_to_date2() |>
  filter(date >= as.Date("1990-01-01")) |>
  mutate(variable = "Deflateur de la Consommation") |>
  select(variable, date, value) |>
  bind_rows(`IPC-2015` |>
              filter(INDICATEUR == "IPC",
                     MENAGES_IPC == "ENSEMBLE",
                     COICOP2016 %in% c("03"),
                     FREQ == "A",
                     REF_AREA == "FE",
                     NATURE == "INDICE") |>
              year_to_date() |>
              select(date, value = OBS_VALUE) |>
              mutate(variable = "Indice des Prix à la Consommation")) |>
  bind_rows(`IPCH-2015` |>
              filter(INDICATEUR == "IPCH",
                     COICOP2016 %in% c("03"),
                     FREQ == "A",
                     REF_AREA == "FE",
                     NATURE == "INDICE") |>
              year_to_date() |>
              select(date, value = OBS_VALUE) |>
              mutate(variable = "Indice des Prix à la Consommation Harmonisé")) |>
  group_by(variable) |>
  mutate(value = 100*value/value[date == as.Date("1996-01-01")]) |>
  ggplot() + ylab("Indice des prix (03 - Habillement et chaussures)") + xlab("") + theme_minimal() +
  geom_line(aes(x = date, y = value, color = variable)) +

  scale_x_date(breaks = seq(1920, 2100, 5) |> paste0("-01-01") |> as.Date(),
               labels = date_format("%Y")) +
  theme(legend.position = c(0.75, 0.3),
        legend.title = element_blank()) +
  scale_y_log10(breaks = seq(0, 500, 1),
                     labels = dollar_format(accuracy = 1, prefix = ""))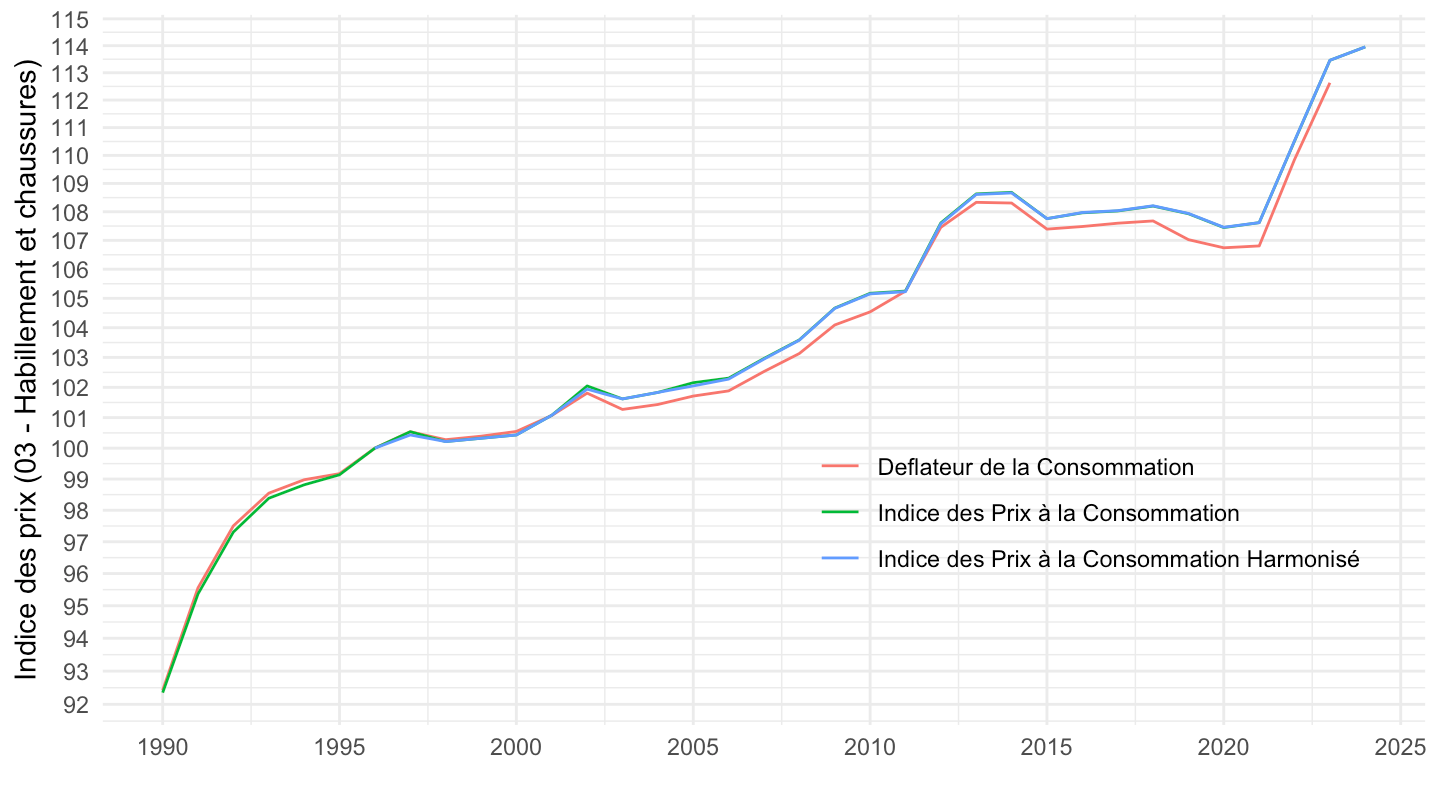
T_CONSO_EFF_FONCTION |>
  filter(fonction =="CP04",
         variable == "IPRIX2020") |>
  year_to_date2() |>
  filter(date >= as.Date("1990-01-01")) |>
  mutate(variable = "Deflateur de la Consommation") |>
  select(variable, date, value) |>
  bind_rows(`IPC-2015` |>
              filter(INDICATEUR == "IPC",
                     MENAGES_IPC == "ENSEMBLE",
                     COICOP2016 %in% c("04"),
                     FREQ == "A",
                     REF_AREA == "FE",
                     NATURE == "INDICE") |>
              year_to_date() |>
              select(date, value = OBS_VALUE) |>
              mutate(variable = "Indice des Prix à la Consommation")) |>
  bind_rows(`IPCH-2015` |>
              filter(INDICATEUR == "IPCH",
                     COICOP2016 %in% c("04"),
                     FREQ == "A",
                     REF_AREA == "FE",
                     NATURE == "INDICE") |>
              year_to_date() |>
              select(date, value = OBS_VALUE) |>
              mutate(variable = "Indice des Prix à la Consommation Harmonisé")) |>
  group_by(variable) |>
  mutate(value = 100*value/value[date == as.Date("1996-01-01")]) |>
  ggplot() + ylab("Indice des prix (04 - Logement)") + xlab("") + theme_minimal() +
  geom_line(aes(x = date, y = value, color = variable)) +

  scale_x_date(breaks = seq(1920, 2100, 5) |> paste0("-01-01") |> as.Date(),
               labels = date_format("%Y")) +
  theme(legend.position = c(0.75, 0.3),
        legend.title = element_blank()) +
  scale_y_log10(breaks = seq(0, 500, 10),
                     labels = dollar_format(accuracy = 1, prefix = ""))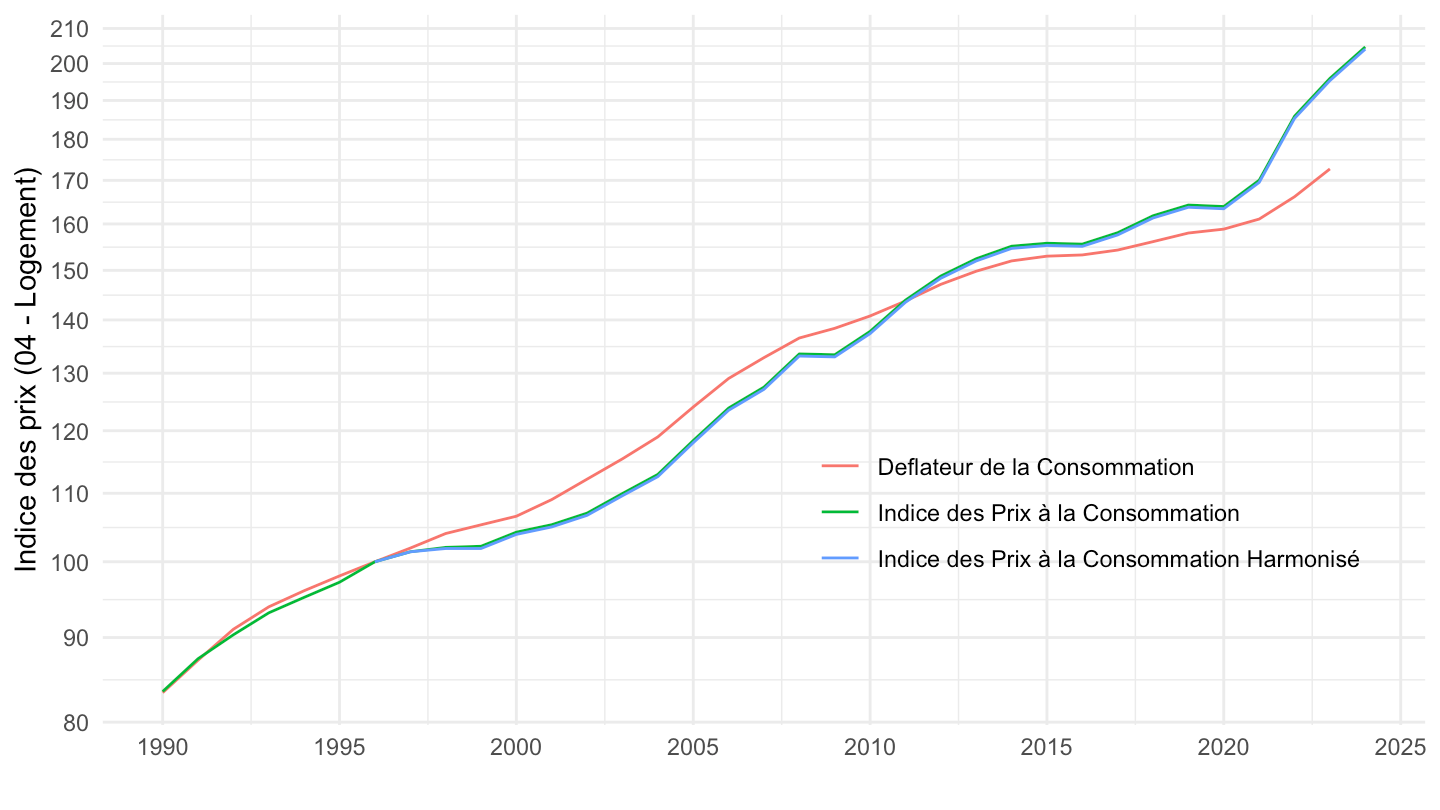
T_CONSO_EFF_FONCTION |>
  filter(fonction =="CP05",
         variable == "IPRIX2020") |>
  year_to_date2() |>
  filter(date >= as.Date("1990-01-01")) |>
  mutate(variable = "Deflateur de la Consommation") |>
  select(variable, date, value) |>
  bind_rows(`IPC-2015` |>
              filter(INDICATEUR == "IPC",
                     MENAGES_IPC == "ENSEMBLE",
                     COICOP2016 %in% c("05"),
                     FREQ == "A",
                     REF_AREA == "FE",
                     NATURE == "INDICE") |>
              year_to_date() |>
              select(date, value = OBS_VALUE) |>
              mutate(variable = "Indice des Prix à la Consommation")) |>
  bind_rows(`IPCH-2015` |>
              filter(INDICATEUR == "IPCH",
                     COICOP2016 %in% c("05"),
                     FREQ == "A",
                     REF_AREA == "FE",
                     NATURE == "INDICE") |>
              year_to_date() |>
              select(date, value = OBS_VALUE) |>
              mutate(variable = "Indice des Prix à la Consommation Harmonisé")) |>
  group_by(variable) |>
  mutate(value = 100*value/value[date == as.Date("1996-01-01")]) |>
  ggplot() + ylab("Indice des prix (05 - Meubles)") + xlab("") + theme_minimal() +
  geom_line(aes(x = date, y = value, color = variable)) +

  scale_x_date(breaks = seq(1920, 2100, 5) |> paste0("-01-01") |> as.Date(),
               labels = date_format("%Y")) +
  theme(legend.position = c(0.75, 0.3),
        legend.title = element_blank()) +
  scale_y_log10(breaks = seq(0, 500, 5),
                     labels = dollar_format(accuracy = 1, prefix = ""))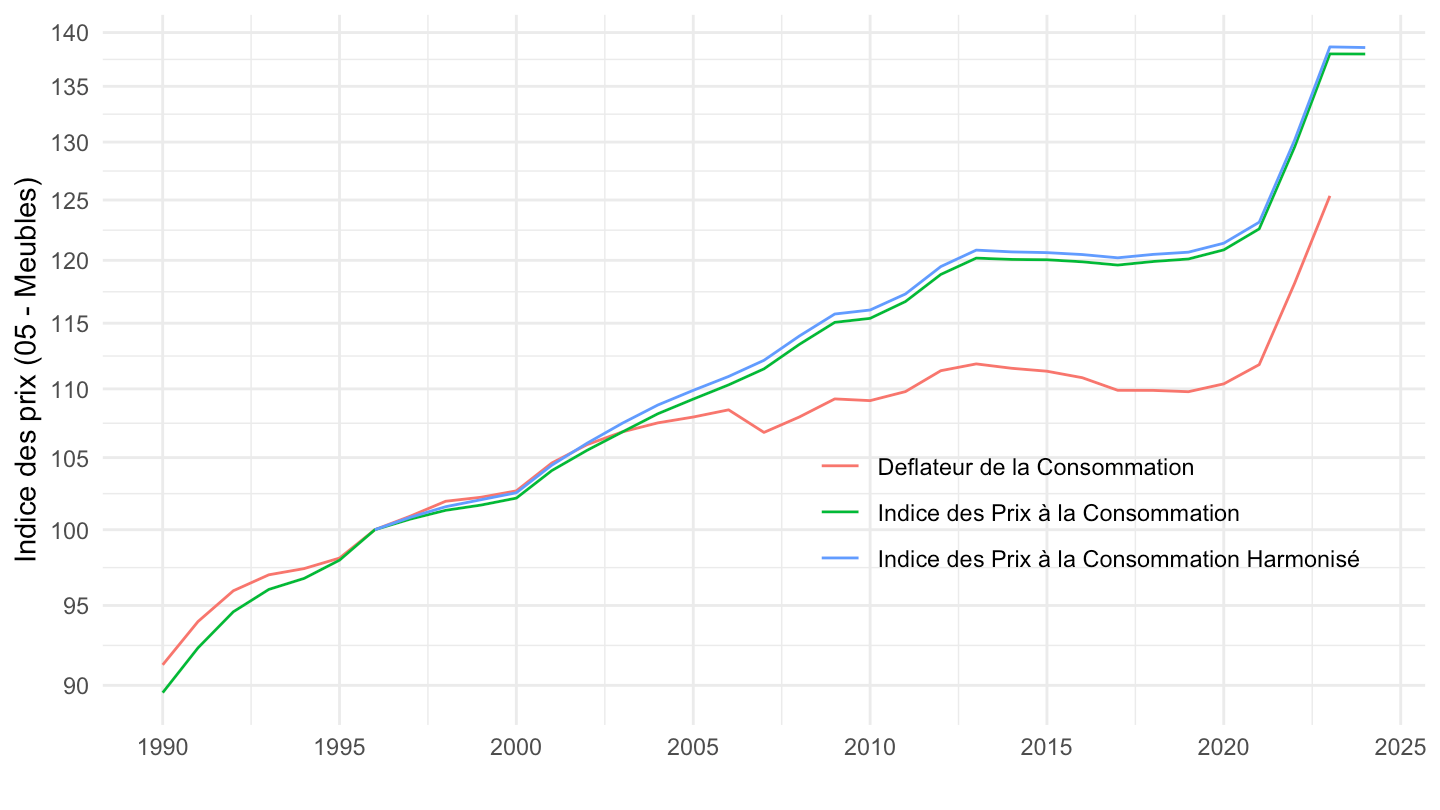
T_CONSO_EFF_FONCTION |>
  filter(fonction =="CP06",
         variable == "IPRIX2020") |>
  year_to_date2() |>
  filter(date >= as.Date("1990-01-01")) |>
  mutate(variable = "Deflateur de la Consommation") |>
  select(variable, date, value) |>
  bind_rows(`IPC-2015` |>
              filter(INDICATEUR == "IPC",
                     MENAGES_IPC == "ENSEMBLE",
                     COICOP2016 %in% c("06"),
                     FREQ == "A",
                     REF_AREA == "FE",
                     NATURE == "INDICE") |>
              year_to_date() |>
              select(date, value = OBS_VALUE) |>
              mutate(variable = "Indice des Prix à la Consommation")) |>
  bind_rows(`IPCH-2015` |>
              filter(INDICATEUR == "IPCH",
                     COICOP2016 %in% c("06"),
                     FREQ == "A",
                     REF_AREA == "FE",
                     NATURE == "INDICE") |>
              year_to_date() |>
              select(date, value = OBS_VALUE) |>
              mutate(variable = "Indice des Prix à la Consommation Harmonisé")) |>
  group_by(variable) |>
  mutate(value = 100*value/value[date == as.Date("1996-01-01")]) |>
  ggplot() + ylab("Indice des prix (06 - Santé)") + xlab("") + theme_minimal() +
  geom_line(aes(x = date, y = value, color = variable)) +

  scale_x_date(breaks = seq(1920, 2100, 5) |> paste0("-01-01") |> as.Date(),
               labels = date_format("%Y")) +
  theme(legend.position = c(0.3, 0.85),
        legend.title = element_blank()) +
  scale_y_log10(breaks = seq(0, 500, 5),
                     labels = dollar_format(accuracy = 1, prefix = ""))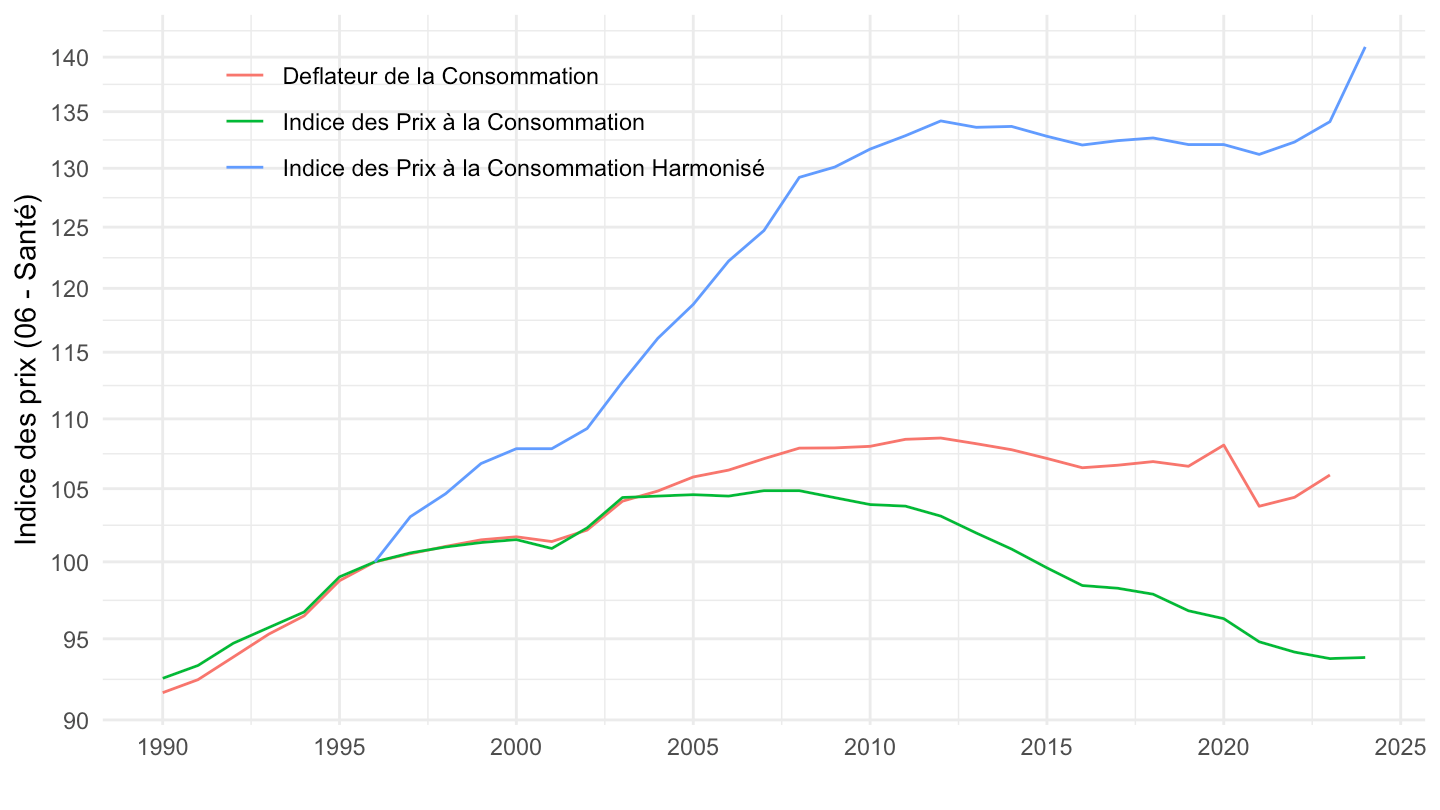
T_CONSO_EFF_FONCTION |>
  filter(fonction =="CP07",
         variable == "IPRIX2020") |>
  year_to_date2() |>
  filter(date >= as.Date("1990-01-01")) |>
  mutate(variable = "Deflateur de la Consommation") |>
  select(variable, date, value) |>
  bind_rows(`IPC-2015` |>
              filter(INDICATEUR == "IPC",
                     MENAGES_IPC == "ENSEMBLE",
                     COICOP2016 %in% c("07"),
                     FREQ == "A",
                     REF_AREA == "FE",
                     NATURE == "INDICE") |>
              year_to_date() |>
              select(date, value = OBS_VALUE) |>
              mutate(variable = "Indice des Prix à la Consommation")) |>
  bind_rows(`IPCH-2015` |>
              filter(INDICATEUR == "IPCH",
                     COICOP2016 %in% c("07"),
                     FREQ == "A",
                     REF_AREA == "FE",
                     NATURE == "INDICE") |>
              year_to_date() |>
              select(date, value = OBS_VALUE) |>
              mutate(variable = "Indice des Prix à la Consommation Harmonisé")) |>
  group_by(variable) |>
  mutate(value = 100*value/value[date == as.Date("1996-01-01")]) |>
  ggplot() + ylab("Indice des prix (07 - Transports)") + xlab("") + theme_minimal() +
  geom_line(aes(x = date, y = value, color = variable)) +

  scale_x_date(breaks = seq(1920, 2100, 5) |> paste0("-01-01") |> as.Date(),
               labels = date_format("%Y")) +
  theme(legend.position = c(0.75, 0.3),
        legend.title = element_blank()) +
  scale_y_log10(breaks = seq(0, 500, 10),
                     labels = dollar_format(accuracy = 1, prefix = ""))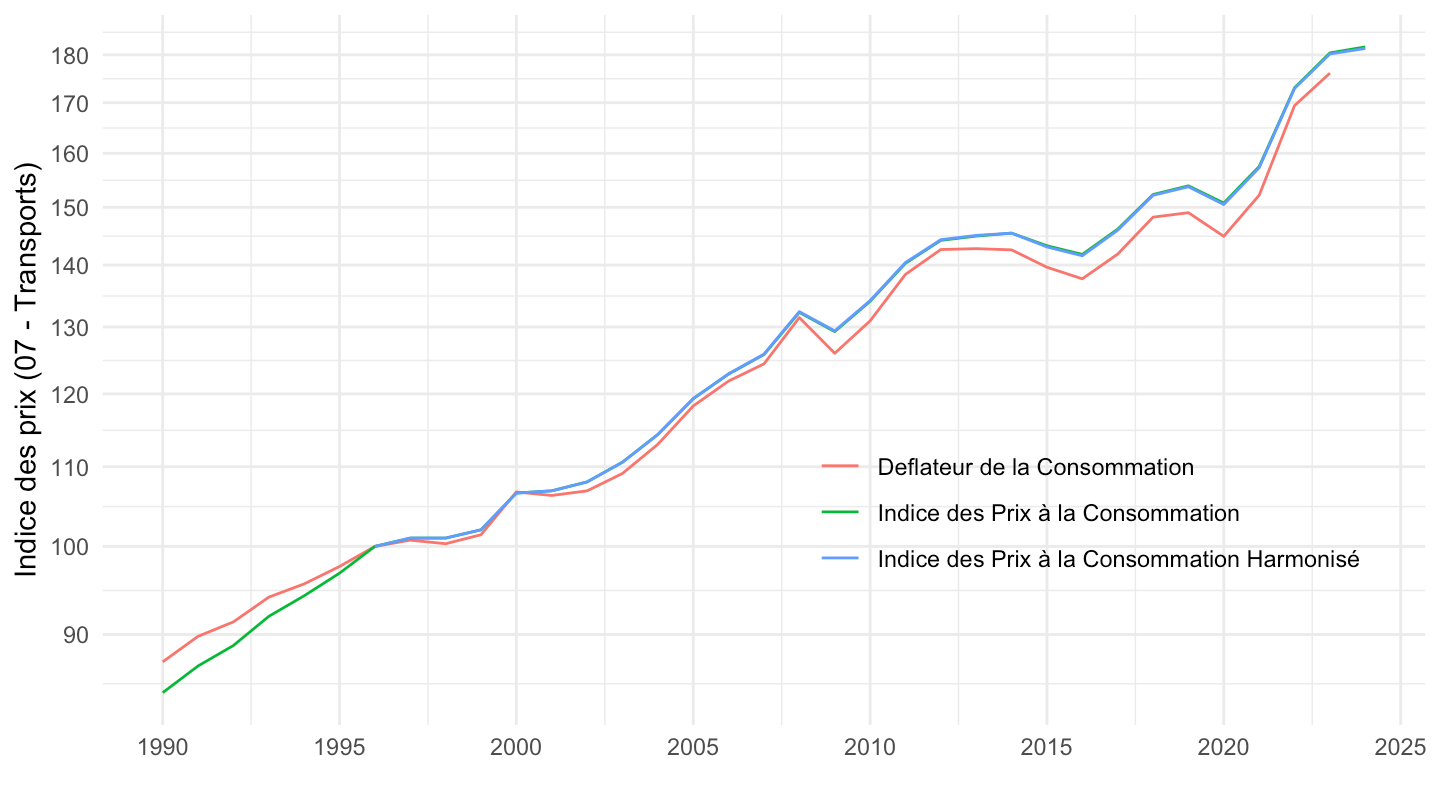
T_CONSO_EFF_FONCTION |>
  filter(fonction =="CP08",
         variable == "IPRIX2020") |>
  year_to_date2() |>
  filter(date >= as.Date("1990-01-01")) |>
  mutate(variable = "Deflateur de la Consommation") |>
  select(variable, date, value) |>
  bind_rows(`IPC-2015` |>
              filter(INDICATEUR == "IPC",
                     MENAGES_IPC == "ENSEMBLE",
                     COICOP2016 %in% c("08"),
                     FREQ == "A",
                     REF_AREA == "FE",
                     NATURE == "INDICE") |>
              year_to_date() |>
              select(date, value = OBS_VALUE) |>
              mutate(variable = "Indice des Prix à la Consommation")) |>
  bind_rows(`IPCH-2015` |>
              filter(INDICATEUR == "IPCH",
                     COICOP2016 %in% c("08"),
                     FREQ == "A",
                     REF_AREA == "FE",
                     NATURE == "INDICE") |>
              year_to_date() |>
              select(date, value = OBS_VALUE) |>
              mutate(variable = "Indice des Prix à la Consommation Harmonisé")) |>
  group_by(variable) |>
  mutate(value = 100*value/value[date == as.Date("1996-01-01")]) |>
  ggplot() + ylab("Indice des prix (08 - Communications)") + xlab("") + theme_minimal() +
  geom_line(aes(x = date, y = value, color = variable)) +

  scale_x_date(breaks = seq(1920, 2100, 5) |> paste0("-01-01") |> as.Date(),
               labels = date_format("%Y")) +
  theme(legend.position = c(0.3, 0.3),
        legend.title = element_blank()) +
  scale_y_log10(breaks = seq(0, 500, 10),
                     labels = dollar_format(accuracy = 1, prefix = ""))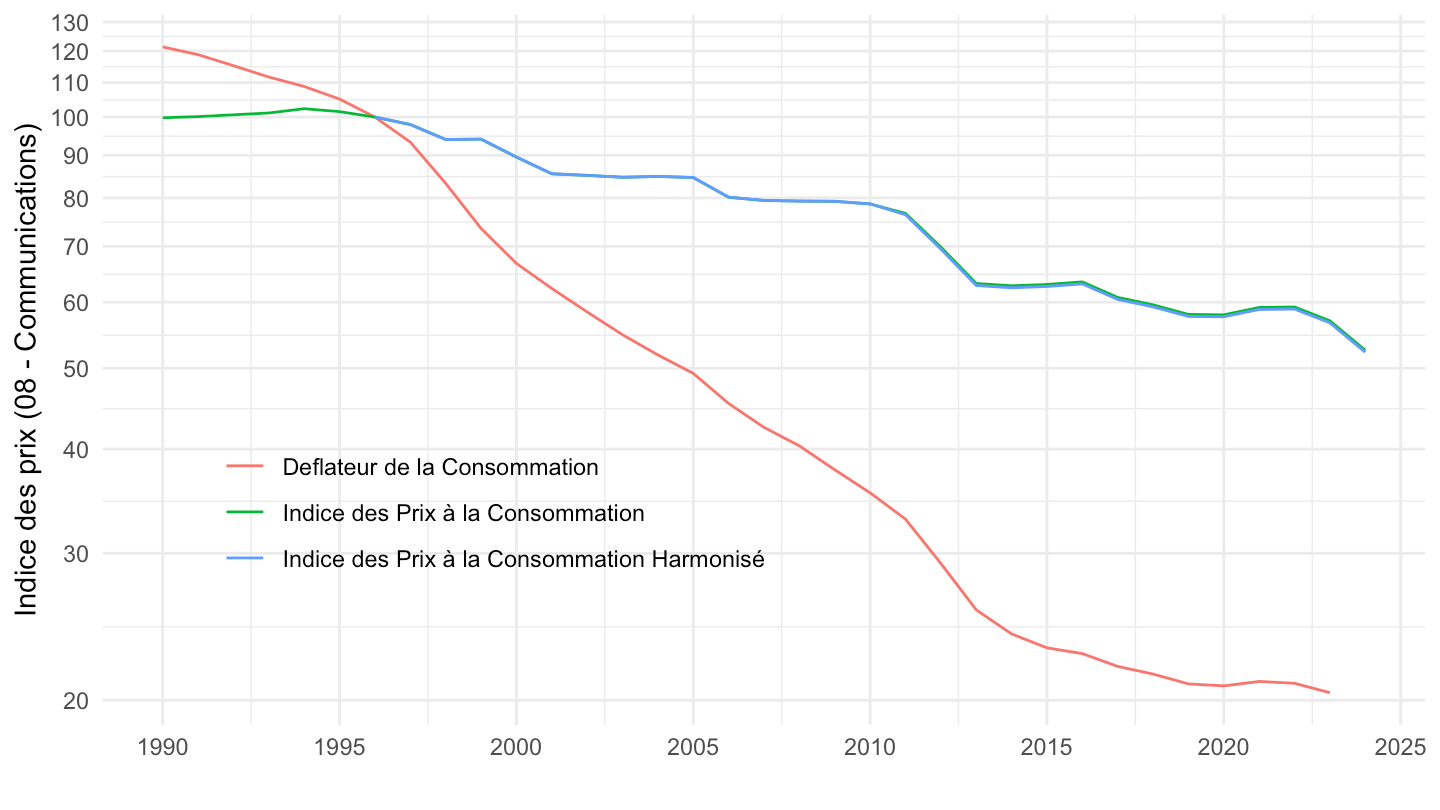
T_CONSO_EFF_FONCTION |>
  filter(fonction =="CP08",
         variable == "IPRIX2020") |>
  year_to_date2() |>
  mutate(variable = "Deflateur de la Consommation") |>
  select(variable, date, value) |>
  bind_rows(`IPC-2015` |>
              filter(INDICATEUR == "IPC",
                     MENAGES_IPC == "ENSEMBLE",
                     COICOP2016 %in% c("08"),
                     FREQ == "A",
                     REF_AREA == "FE",
                     NATURE == "INDICE") |>
              year_to_date() |>
              select(date, value = OBS_VALUE) |>
              mutate(variable = "Indice des Prix à la Consommation (IPC)")) |>
  bind_rows(`IPCH-2015` |>
              filter(INDICATEUR == "IPCH",
                     COICOP2016 %in% c("08"),
                     FREQ == "A",
                     REF_AREA == "FE",
                     NATURE == "INDICE") |>
              year_to_date() |>
              select(date, value = OBS_VALUE) |>
              mutate(variable = "Indice des Prix à la Consommation Harmonisé (IPCH)")) |>
  group_by(variable) |>
  filter(date >= as.Date("1996-01-01")) |>
  mutate(value = 100*value/value[date == as.Date("1996-01-01")]) |>
  ggplot() + ylab("Indice des prix (08 - Communications)") + xlab("") + theme_minimal() +
  geom_line(aes(x = date, y = value, color = variable)) +

  scale_x_date(breaks = seq(1920, 2100, 2) |> paste0("-01-01") |> as.Date(),
               labels = date_format("%Y")) +
  theme(legend.position = c(0.3, 0.3),
        legend.title = element_blank()) +
  scale_y_log10(breaks = seq(0, 500, 10),
                     labels = dollar_format(accuracy = 1, prefix = ""))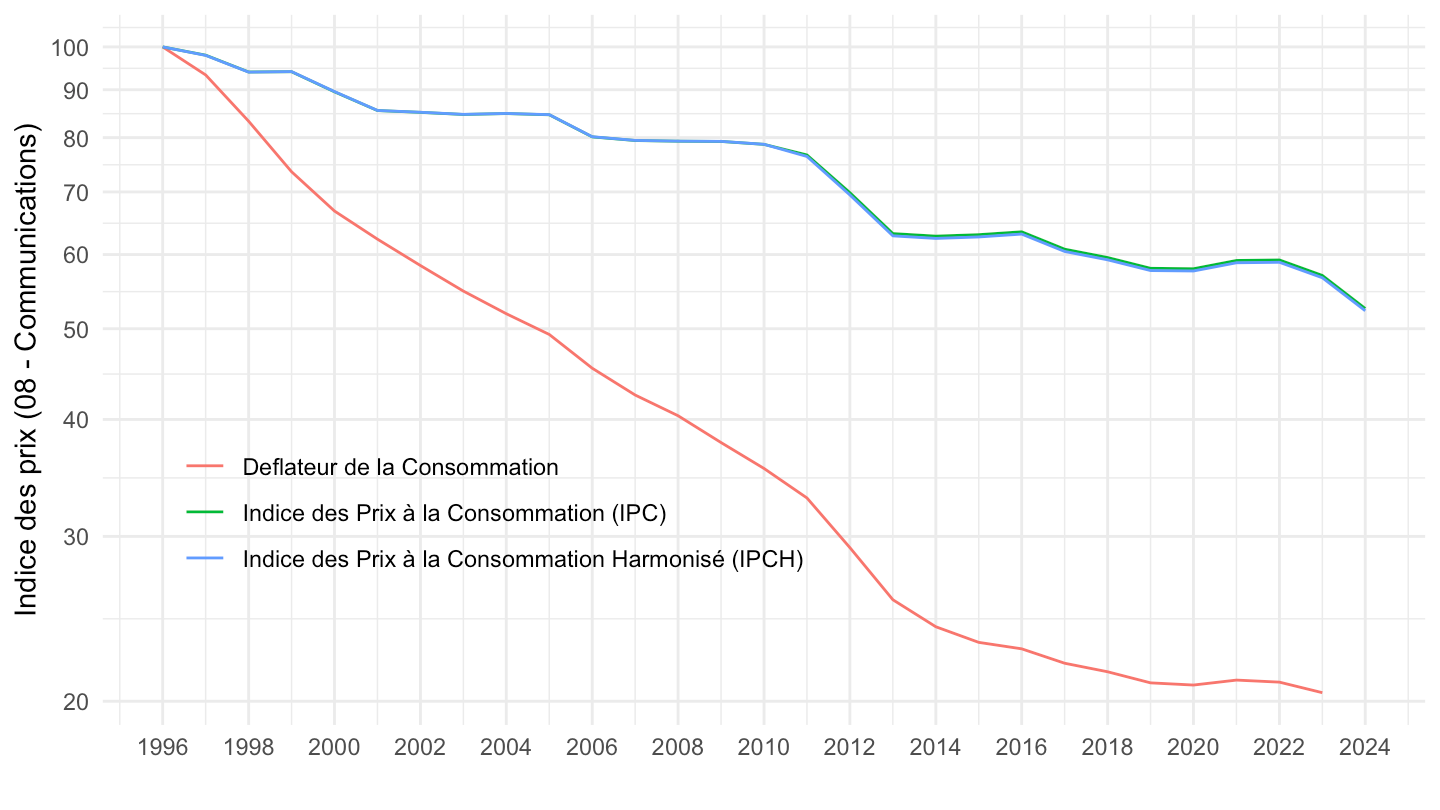
T_CONSO_EFF_FONCTION |>
  filter(fonction =="CP09",
         variable == "IPRIX2020") |>
  year_to_date2() |>
  filter(date >= as.Date("1990-01-01")) |>
  mutate(variable = "Deflateur de la Consommation") |>
  select(variable, date, value) |>
  bind_rows(`IPC-2015` |>
              filter(INDICATEUR == "IPC",
                     MENAGES_IPC == "ENSEMBLE",
                     COICOP2016 %in% c("09"),
                     FREQ == "A",
                     REF_AREA == "FE",
                     NATURE == "INDICE") |>
              year_to_date() |>
              select(date, value = OBS_VALUE) |>
              mutate(variable = "Indice des Prix à la Consommation (IPC)")) |>
  bind_rows(`IPCH-2015` |>
              filter(INDICATEUR == "IPCH",
                     COICOP2016 %in% c("09"),
                     FREQ == "A",
                     REF_AREA == "FE",
                     NATURE == "INDICE") |>
              year_to_date() |>
              select(date, value = OBS_VALUE) |>
              mutate(variable = "Indice des Prix à la Consommation Harmonisé (IPCH)")) |>
  group_by(variable) |>
  mutate(value = 100*value/value[date == as.Date("1996-01-01")]) |>
  ggplot() + ylab("Indice des prix (09 - Loisirs et culture)") + xlab("") + theme_minimal() +
  geom_line(aes(x = date, y = value, color = variable)) +

  scale_x_date(breaks = seq(1920, 2100, 5) |> paste0("-01-01") |> as.Date(),
               labels = date_format("%Y")) +
  theme(legend.position = c(0.75, 0.3),
        legend.title = element_blank()) +
  scale_y_log10(breaks = seq(0, 500, 10),
                     labels = dollar_format(accuracy = 1, prefix = ""))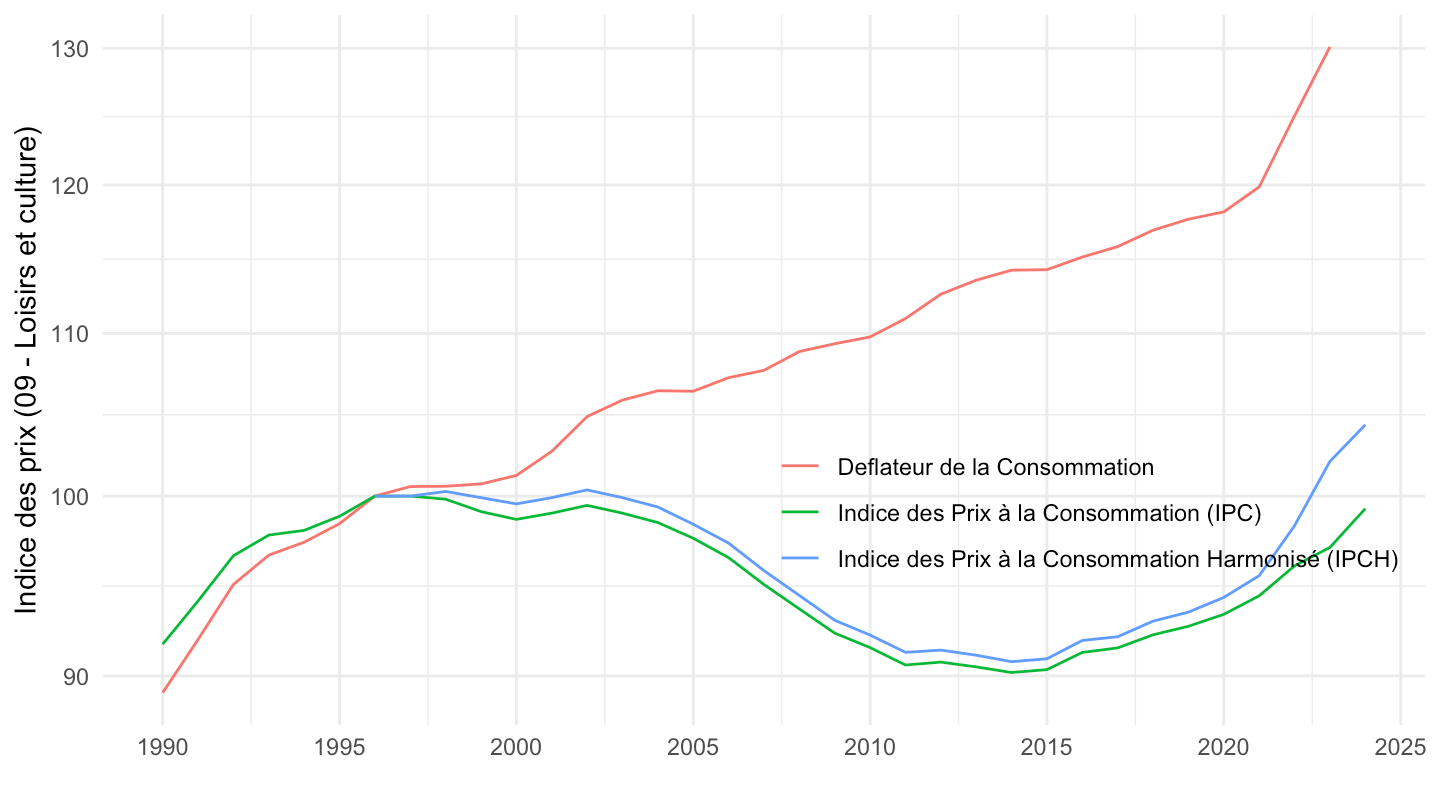
T_CONSO_EFF_FONCTION |>
  filter(fonction =="CP09",
         variable == "IPRIX2020") |>
  year_to_date2() |>
  filter(date >= as.Date("1996-01-01")) |>
  mutate(variable = "Deflateur de la Consommation") |>
  select(variable, date, value) |>
  bind_rows(`IPC-2015` |>
              filter(INDICATEUR == "IPC",
                     MENAGES_IPC == "ENSEMBLE",
                     COICOP2016 %in% c("09"),
                     FREQ == "A",
                     REF_AREA == "FE",
                     NATURE == "INDICE") |>
              year_to_date() |>
              select(date, value = OBS_VALUE) |>
              mutate(variable = "Indice des Prix à la Consommation (IPC)")) |>
  bind_rows(`IPCH-2015` |>
              filter(INDICATEUR == "IPCH",
                     COICOP2016 %in% c("09"),
                     FREQ == "A",
                     REF_AREA == "FE",
                     NATURE == "INDICE") |>
              year_to_date() |>
              select(date, value = OBS_VALUE) |>
              mutate(variable = "Indice des Prix à la Consommation Harmonisé (IPCH)")) |>
  group_by(variable) |>
  mutate(value = 100*value/value[date == as.Date("1996-01-01")]) |>
  ggplot() + ylab("Indice des prix (09)") + xlab("") + theme_minimal() +
  geom_line(aes(x = date, y = value, color = variable)) +

  scale_x_date(breaks = seq(1920, 2100, 2) |> paste0("-01-01") |> as.Date(),
               labels = date_format("%Y")) +
  theme(legend.position = c(0.3, 0.3),
        legend.title = element_blank()) +
  scale_y_log10(breaks = seq(0, 500, 10),
                     labels = dollar_format(accuracy = 1, prefix = ""))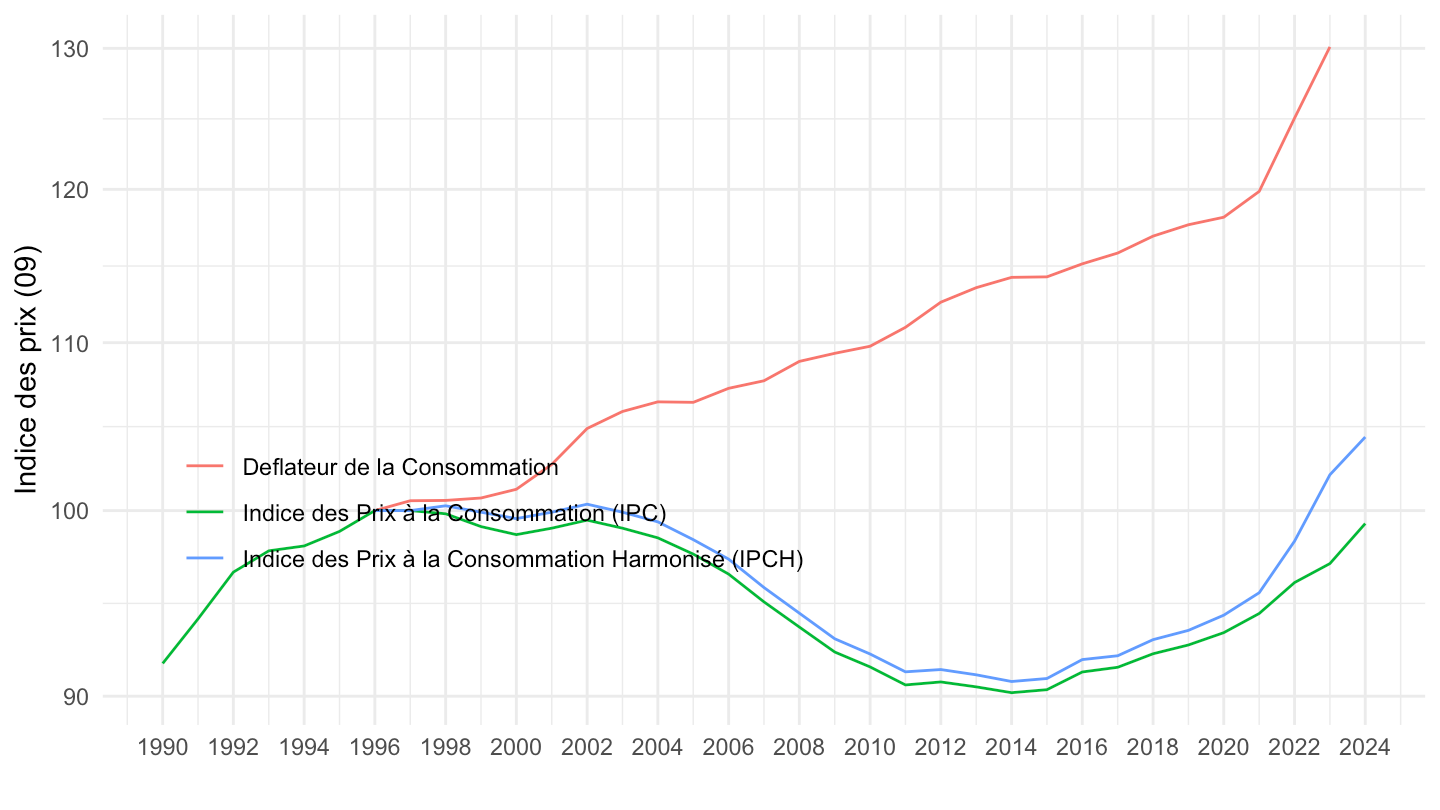
T_CONSO_EFF_FONCTION |>
  filter(fonction =="CP10",
         variable == "IPRIX2020") |>
  year_to_date2() |>
  filter(date >= as.Date("1990-01-01")) |>
  mutate(variable = "Deflateur de la Consommation") |>
  select(variable, date, value) |>
  bind_rows(`IPC-2015` |>
              filter(INDICATEUR == "IPC",
                     MENAGES_IPC == "ENSEMBLE",
                     COICOP2016 %in% c("10"),
                     FREQ == "A",
                     REF_AREA == "FE",
                     NATURE == "INDICE") |>
              year_to_date() |>
              select(date, value = OBS_VALUE) |>
              mutate(variable = "Indice des Prix à la Consommation (IPC)")) |>
  bind_rows(`IPCH-2015` |>
              filter(INDICATEUR == "IPCH",
                     COICOP2016 %in% c("10"),
                     FREQ == "A",
                     REF_AREA == "FE",
                     NATURE == "INDICE") |>
              year_to_date() |>
              select(date, value = OBS_VALUE) |>
              mutate(variable = "Indice des Prix à la Consommation Harmonisé (IPCH)")) |>
  group_by(variable) |>
  mutate(value = 100*value/value[date == as.Date("1996-01-01")]) |>
  ggplot() + ylab("Indice des prix") + xlab("") + theme_minimal() +
  geom_line(aes(x = date, y = value, color = variable)) +

  scale_x_date(breaks = seq(1920, 2100, 5) |> paste0("-01-01") |> as.Date(),
               labels = date_format("%Y")) +
  theme(legend.position = c(0.75, 0.3),
        legend.title = element_blank()) +
  scale_y_log10(breaks = seq(0, 500, 10),
                     labels = dollar_format(accuracy = 1, prefix = ""))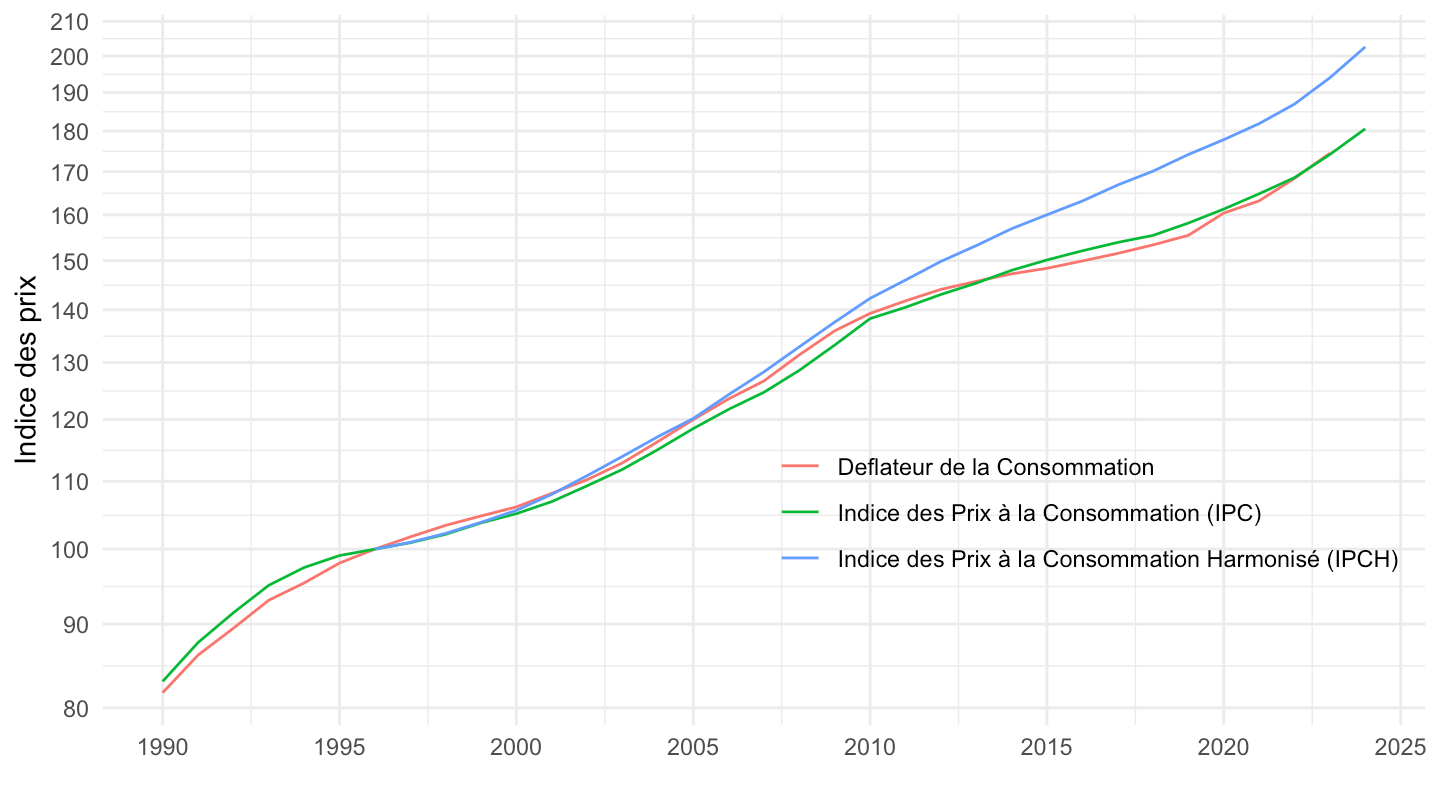
T_CONSO_EFF_FONCTION |>
  filter(fonction =="CP11",
         variable == "IPRIX2020") |>
  year_to_date2() |>
  filter(date >= as.Date("1990-01-01")) |>
  mutate(variable = "Deflateur de la Consommation") |>
  select(variable, date, value) |>
  bind_rows(`IPC-2015` |>
              filter(INDICATEUR == "IPC",
                     MENAGES_IPC == "ENSEMBLE",
                     COICOP2016 %in% c("11"),
                     FREQ == "A",
                     REF_AREA == "FE",
                     NATURE == "INDICE") |>
              year_to_date() |>
              select(date, value = OBS_VALUE) |>
              mutate(variable = "Indice des Prix à la Consommation (IPC)")) |>
  bind_rows(`IPCH-2015` |>
              filter(INDICATEUR == "IPCH",
                     COICOP2016 %in% c("11"),
                     FREQ == "A",
                     REF_AREA == "FE",
                     NATURE == "INDICE") |>
              year_to_date() |>
              select(date, value = OBS_VALUE) |>
              mutate(variable = "Indice des Prix à la Consommation Harmonisé (IPCH)")) |>
  group_by(variable) |>
  mutate(value = 100*value/value[date == as.Date("1996-01-01")]) |>
  ggplot() + ylab("Indice des prix") + xlab("") + theme_minimal() +
  geom_line(aes(x = date, y = value, color = variable)) +

  scale_x_date(breaks = seq(1920, 2100, 5) |> paste0("-01-01") |> as.Date(),
               labels = date_format("%Y")) +
  theme(legend.position = c(0.75, 0.3),
        legend.title = element_blank()) +
  scale_y_log10(breaks = seq(0, 500, 10),
                     labels = dollar_format(accuracy = 1, prefix = ""))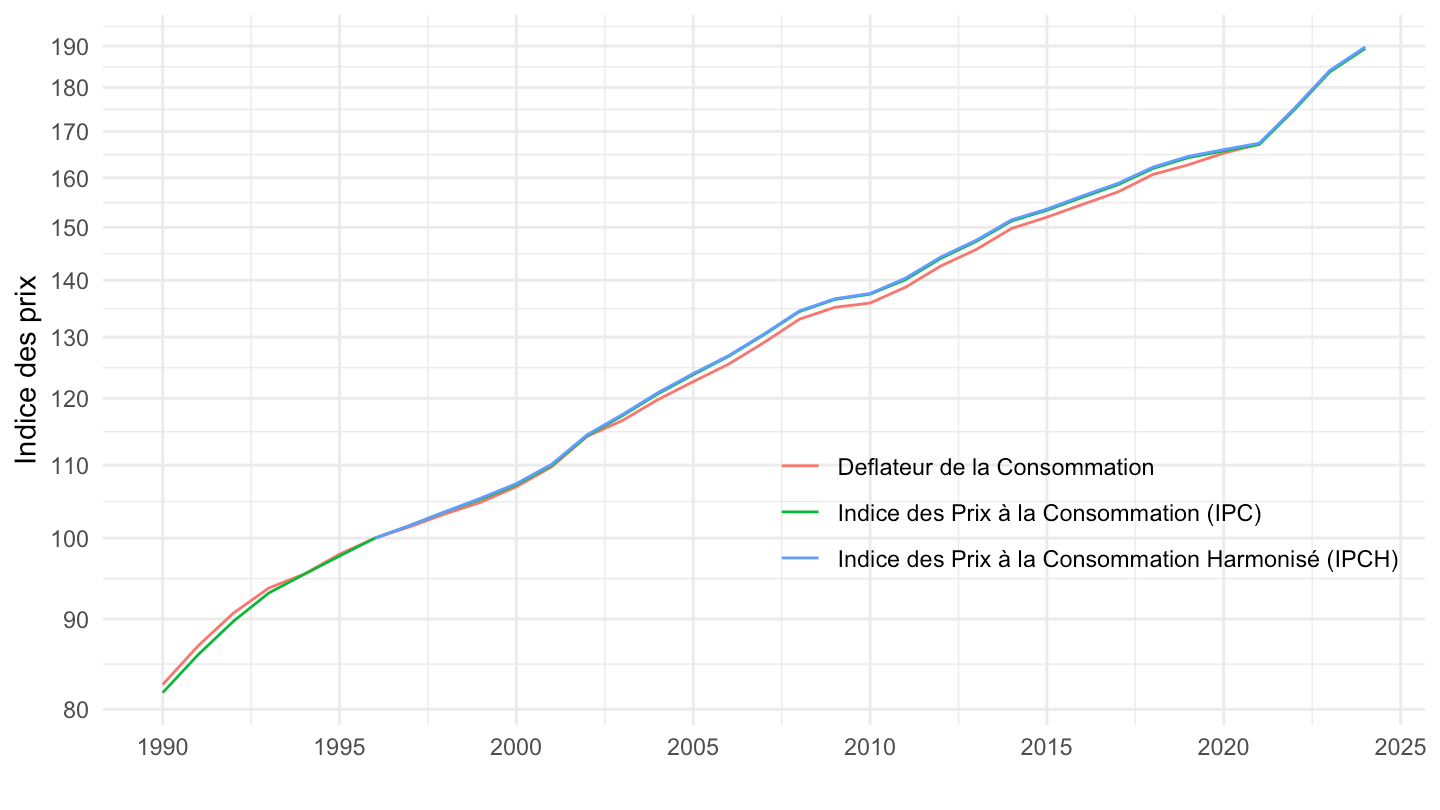
T_CONSO_EFF_FONCTION |>
  filter(fonction =="CP12",
         variable == "IPRIX2020") |>
  year_to_date2() |>
  filter(date >= as.Date("1990-01-01")) |>
  mutate(variable = "Deflateur de la Consommation") |>
  select(variable, date, value) |>
  bind_rows(`IPC-2015` |>
              filter(INDICATEUR == "IPC",
                     MENAGES_IPC == "ENSEMBLE",
                     COICOP2016 %in% c("12"),
                     FREQ == "A",
                     REF_AREA == "FE",
                     NATURE == "INDICE") |>
              year_to_date() |>
              select(date, value = OBS_VALUE) |>
              mutate(variable = "Indice des Prix à la Consommation (IPC)")) |>
  bind_rows(`IPCH-2015` |>
              filter(INDICATEUR == "IPCH",
                     COICOP2016 %in% c("12"),
                     FREQ == "A",
                     REF_AREA == "FE",
                     NATURE == "INDICE") |>
              year_to_date() |>
              select(date, value = OBS_VALUE) |>
              mutate(variable = "Indice des Prix à la Consommation Harmonisé (IPCH)")) |>
  group_by(variable) |>
  mutate(value = 100*value/value[date == as.Date("1996-01-01")]) |>
  ggplot() + ylab("Indice des prix") + xlab("") + theme_minimal() +
  geom_line(aes(x = date, y = value, color = variable)) +

  scale_x_date(breaks = seq(1920, 2100, 5) |> paste0("-01-01") |> as.Date(),
               labels = date_format("%Y")) +
  theme(legend.position = c(0.25, 0.9),
        legend.title = element_blank()) +
  scale_y_log10(breaks = seq(0, 500, 10),
                     labels = dollar_format(accuracy = 1, prefix = ""))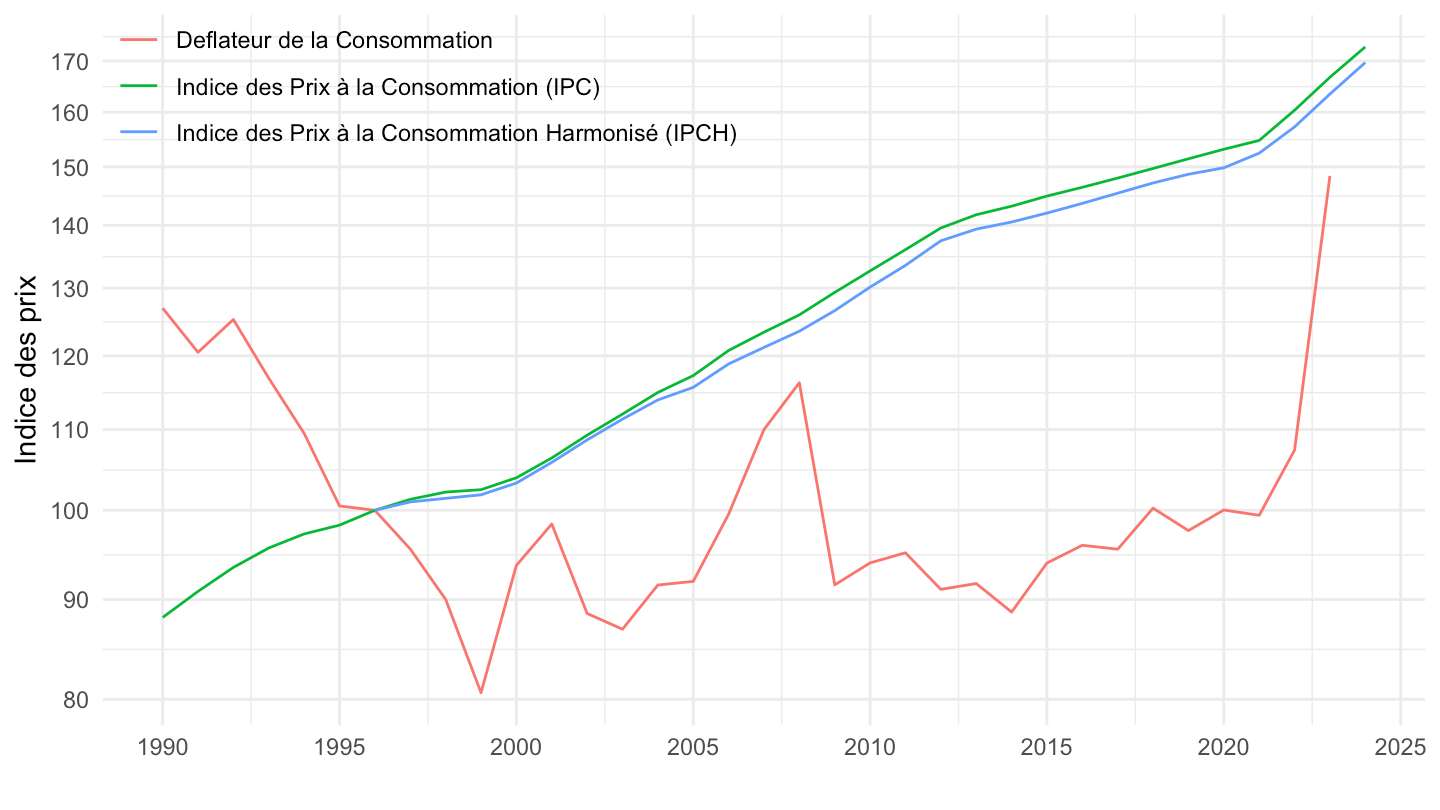
T_CONSO_EFF_FONCTION |>
  filter(fonction =="CP13",
         variable == "IPRIX2020") |>
  year_to_date2() |>
  filter(date >= as.Date("1990-01-01")) |>
  mutate(variable = "Deflateur de la Consommation") |>
  select(variable, date, value) |>
  group_by(variable) |>
  mutate(value = 100*value/value[date == as.Date("1990-01-01")]) |>
  ggplot() + ylab("Indice des prix") + xlab("") + theme_minimal() +
  geom_line(aes(x = date, y = value, color = variable)) +

  scale_x_date(breaks = seq(1920, 2100, 5) |> paste0("-01-01") |> as.Date(),
               labels = date_format("%Y")) +
  theme(legend.position = c(0.25, 0.9),
        legend.title = element_blank()) +
  scale_y_log10(breaks = seq(0, 500, 10),
                     labels = dollar_format(accuracy = 1, prefix = ""))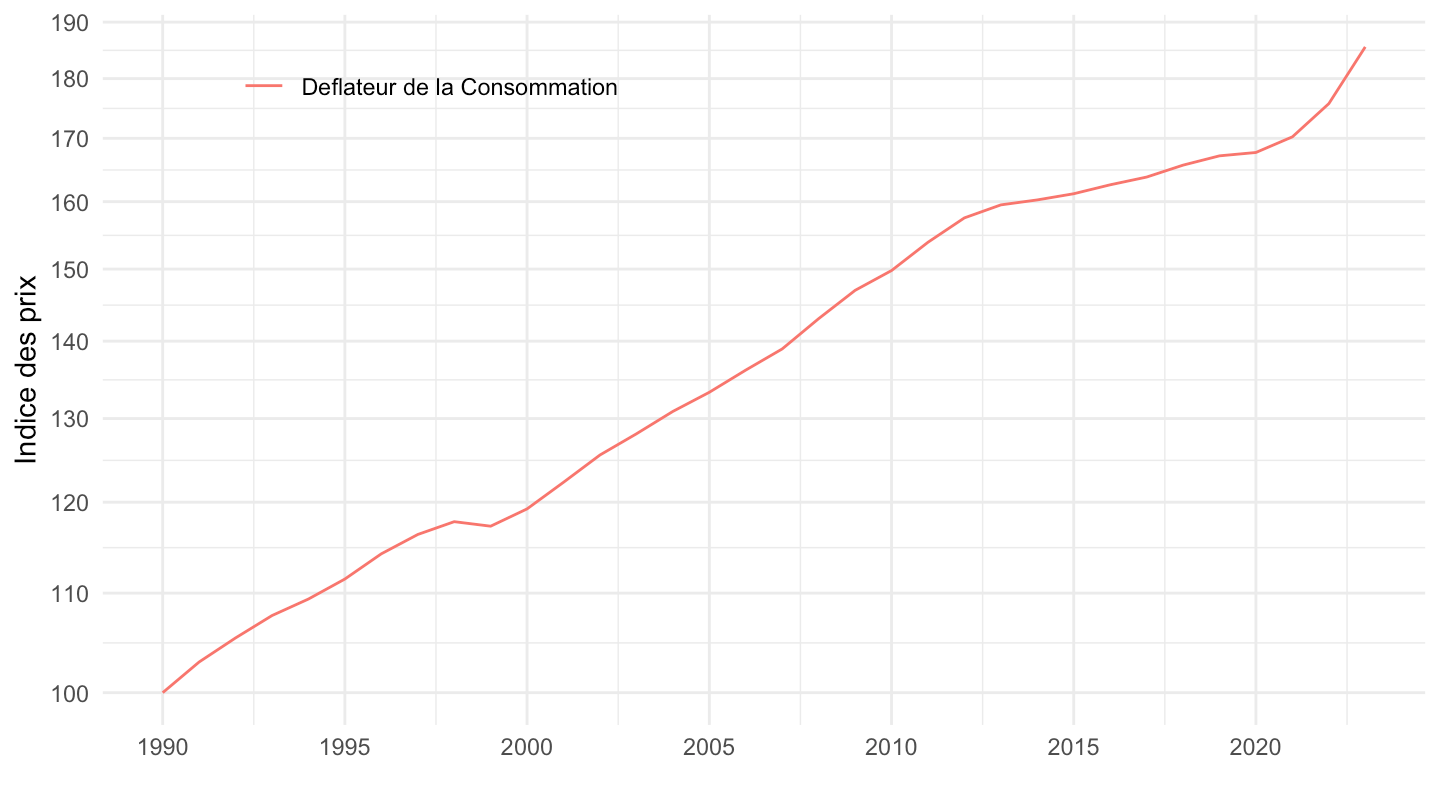
T_CONSO_EFF_FONCTION |>
  filter(fonction =="CP14",
         variable == "IPRIX2020") |>
  year_to_date2() |>
  filter(date >= as.Date("1990-01-01")) |>
  mutate(variable = "Deflateur de la Consommation") |>
  select(variable, date, value) |>
  group_by(variable) |>
  mutate(value = 100*value/value[date == as.Date("1990-01-01")]) |>
  ggplot() + ylab("Indice des prix") + xlab("") + theme_minimal() +
  geom_line(aes(x = date, y = value, color = variable)) +

  scale_x_date(breaks = seq(1920, 2100, 5) |> paste0("-01-01") |> as.Date(),
               labels = date_format("%Y")) +
  theme(legend.position = c(0.25, 0.9),
        legend.title = element_blank()) +
  scale_y_log10(breaks = seq(0, 500, 10),
                     labels = dollar_format(accuracy = 1, prefix = ""))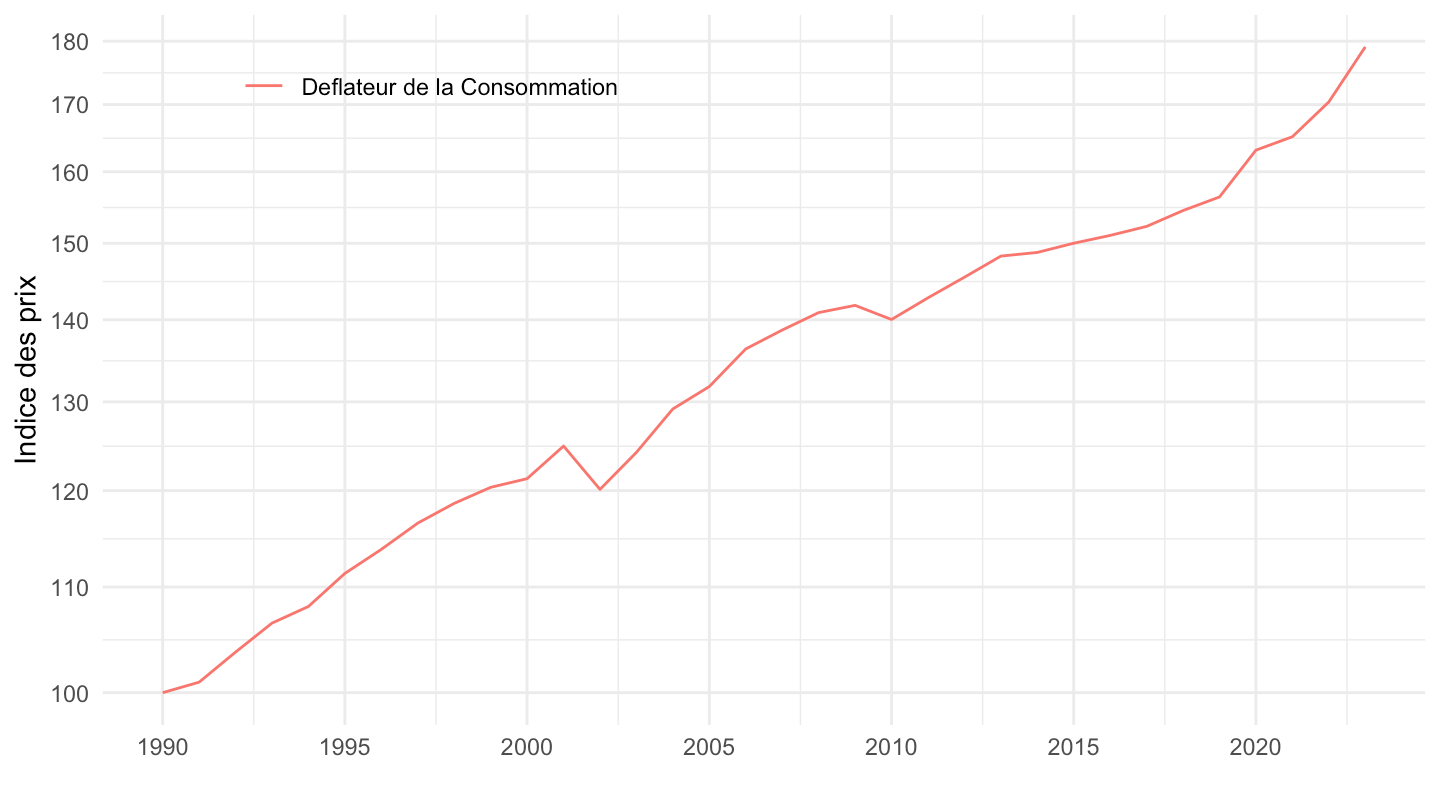
T_CONSO_EFF_FONCTION |>
  filter(fonction =="CP15",
         variable == "IPRIX2020") |>
  year_to_date2() |>
  filter(date >= as.Date("1990-01-01")) |>
  mutate(variable = "Deflateur de la Consommation") |>
  select(variable, date, value) |>
  group_by(variable) |>
  mutate(value = 100*value/value[date == as.Date("1990-01-01")]) |>
  ggplot() + ylab("Indice des prix") + xlab("") + theme_minimal() +
  geom_line(aes(x = date, y = value, color = variable)) +

  scale_x_date(breaks = seq(1920, 2100, 5) |> paste0("-01-01") |> as.Date(),
               labels = date_format("%Y")) +
  theme(legend.position = c(0.25, 0.9),
        legend.title = element_blank()) +
  scale_y_log10(breaks = seq(0, 500, 10),
                     labels = dollar_format(accuracy = 1, prefix = ""))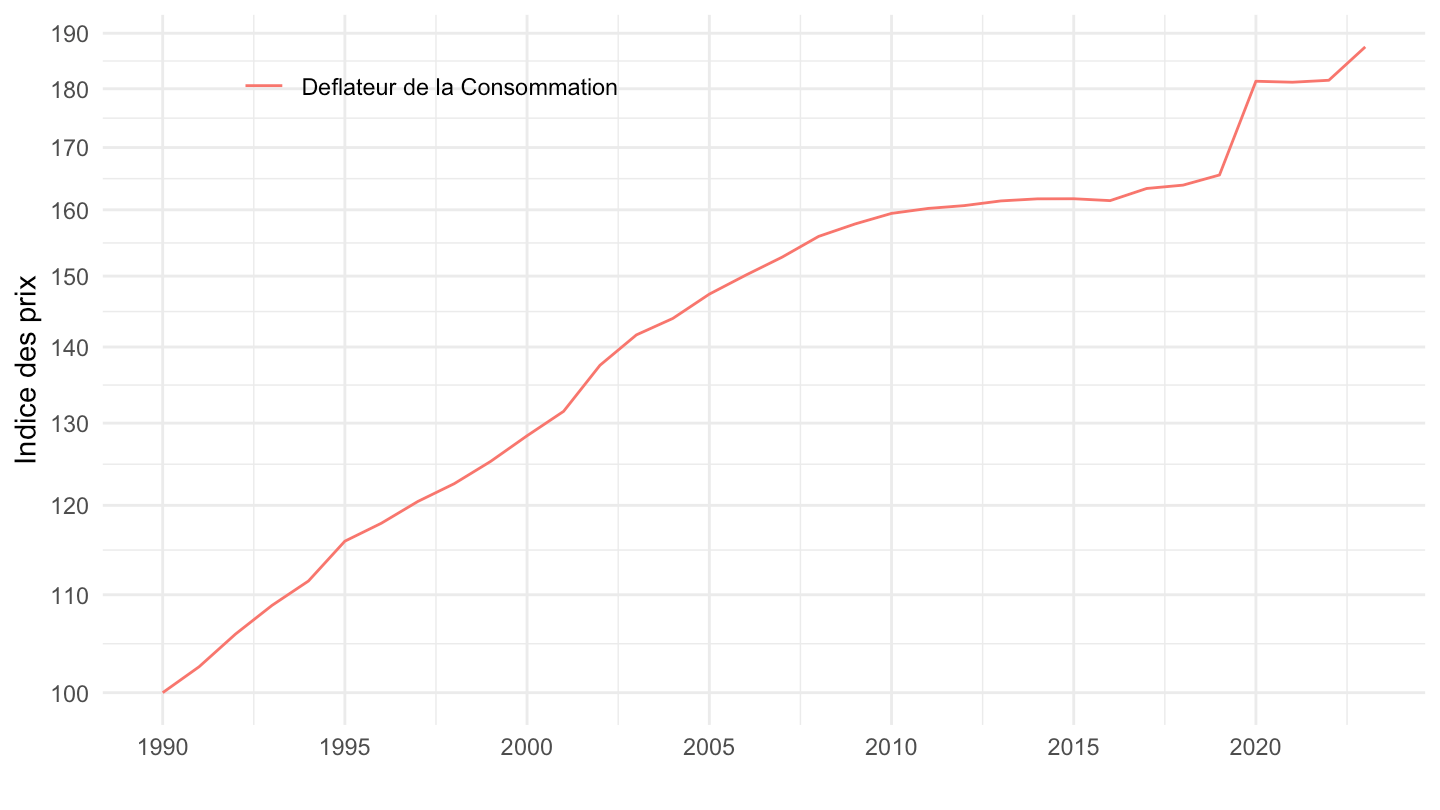
T_CONSO_EFF_FONCTION |>
  filter(fonction =="CP023",
         variable == "IPRIX2020") |>
  year_to_date2() |>
  filter(date >= as.Date("1990-01-01")) |>
  mutate(variable = "Deflateur de la Consommation") |>
  select(variable, date, value) |>
  bind_rows(`IPC-2015` |>
              filter(INDICATEUR == "IPC",
                     MENAGES_IPC == "ENSEMBLE",
                     COICOP2016 %in% c("022"),
                     FREQ == "M",
                     REF_AREA == "FE",
                     NATURE == "INDICE") |>
              month_to_date() |>
              filter(month(date) == 1) |>
              select(date, value = OBS_VALUE) |>
              mutate(variable = "Indice des Prix à la Consommation")) |>
  group_by(variable) |>
  mutate(value = 100*value/value[date == as.Date("1990-01-01")]) |>
  ggplot() + ylab("Indice des prix") + xlab("") + theme_minimal() +
  geom_line(aes(x = date, y = value, color = variable)) +

  scale_x_date(breaks = seq(1920, 2100, 5) |> paste0("-01-01") |> as.Date(),
               labels = date_format("%Y")) +
  theme(legend.position = c(0.25, 0.9),
        legend.title = element_blank()) +
  scale_y_log10(breaks = seq(0, 800, 50),
                     labels = dollar_format(accuracy = 1, prefix = ""))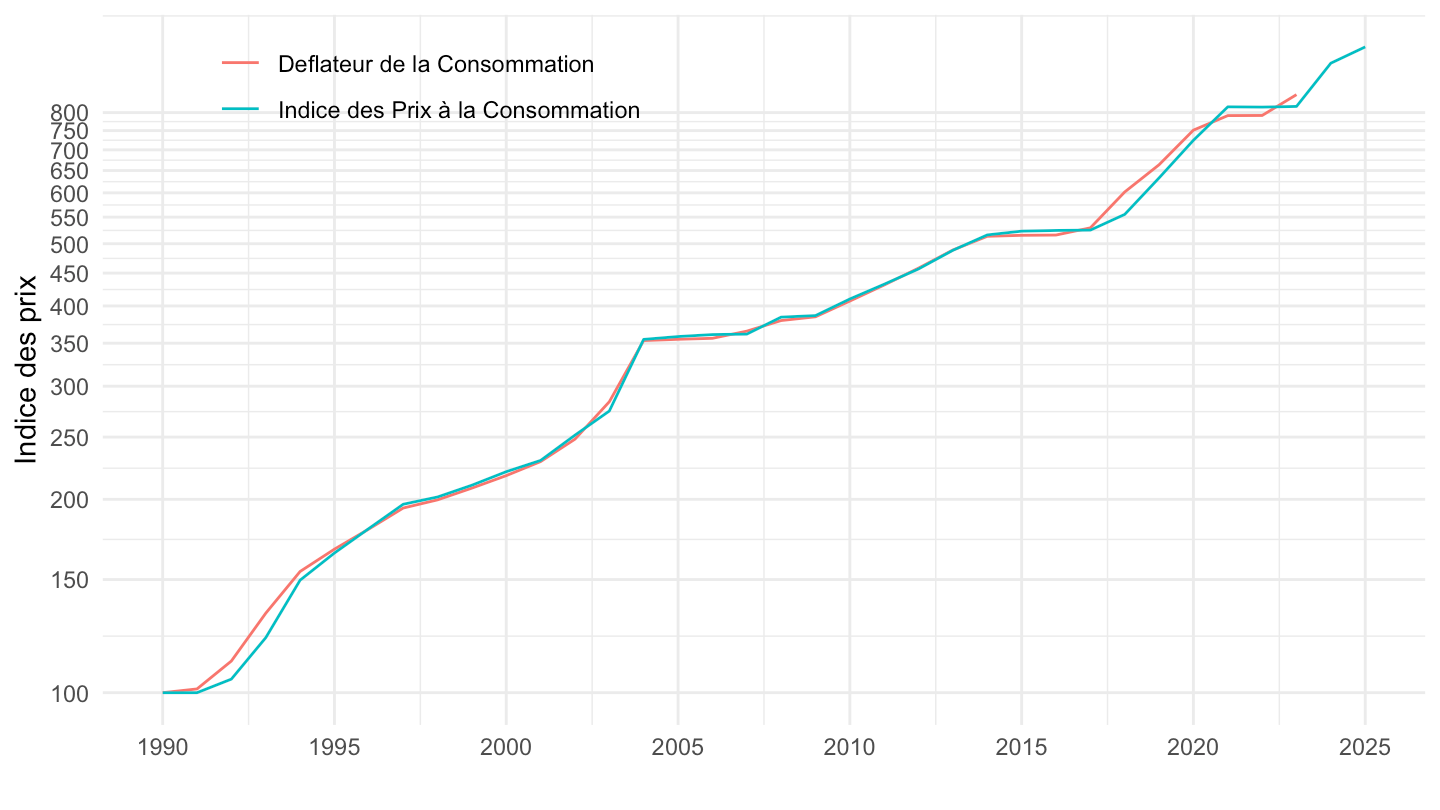
T_CONSO_EFF_FONCTION |>
  filter(fonction =="CP023",
         variable == "IPRIX2020") |>
  year_to_date2() |>
  filter(date >= as.Date("1996-01-01")) |>
  mutate(variable = "Deflateur de la Consommation") |>
  select(variable, date, value) |>
  bind_rows(`IPC-2015` |>
              filter(INDICATEUR == "IPC",
                     MENAGES_IPC == "ENSEMBLE",
                     COICOP2016 %in% c("022"),
                     FREQ == "M",
                     REF_AREA == "FE",
                     NATURE == "INDICE") |>
              month_to_date() |>
              filter(month(date) == 1,
                     date >= as.Date("1996-01-01")) |>
              select(date, value = OBS_VALUE) |>
              mutate(variable = "Indice des Prix à la Consommation")) |>
  group_by(variable) |>
  mutate(value = 100*value/value[date == as.Date("1996-01-01")]) |>
  ggplot() + ylab("Indice des prix") + xlab("") + theme_minimal() +
  geom_line(aes(x = date, y = value, color = variable)) +

  scale_x_date(breaks = seq(1920, 2100, 2) |> paste0("-01-01") |> as.Date(),
               labels = date_format("%Y")) +
  theme(legend.position = c(0.25, 0.9),
        legend.title = element_blank()) +
  scale_y_log10(breaks = seq(0, 800, 50),
                     labels = dollar_format(accuracy = 1, prefix = ""))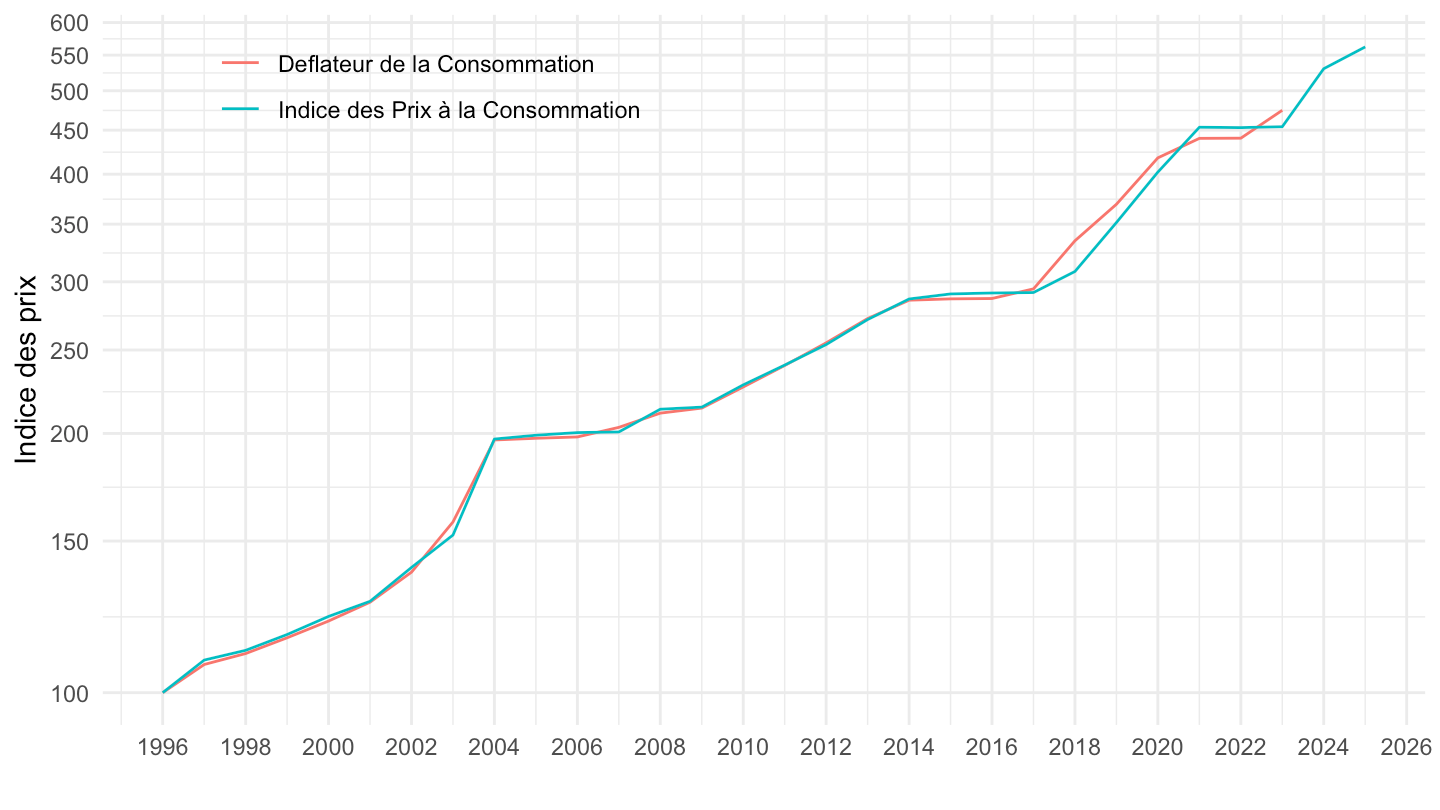
T_CONSO_EFF_FONCTION |>
  filter(fonction =="CP0213",
         variable == "IPRIX2020") |>
  year_to_date2() |>
  filter(date >= as.Date("1990-01-01")) |>
  mutate(variable = "Deflateur de la Consommation") |>
  select(variable, date, value) |>
  bind_rows(`IPC-2015` |>
              filter(INDICATEUR == "IPC",
                     MENAGES_IPC == "ENSEMBLE",
                     COICOP2016 %in% c("0213"),
                     FREQ == "M",
                     REF_AREA == "FE",
                     NATURE == "INDICE") |>
              month_to_date() |>
              filter(month(date) == 1) |>
              select(date, value = OBS_VALUE) |>
              mutate(variable = "Indice des Prix à la Consommation")) |>
  group_by(variable) |>
  mutate(value = 100*value/value[date == as.Date("1990-01-01")]) |>
  ggplot() + ylab("Indice des prix") + xlab("") + theme_minimal() +
  geom_line(aes(x = date, y = value, color = variable)) +

  scale_x_date(breaks = seq(1920, 2100, 5) |> paste0("-01-01") |> as.Date(),
               labels = date_format("%Y")) +
  theme(legend.position = c(0.25, 0.9),
        legend.title = element_blank()) +
  scale_y_log10(breaks = seq(0, 800, 10),
                     labels = dollar_format(accuracy = 1, prefix = ""))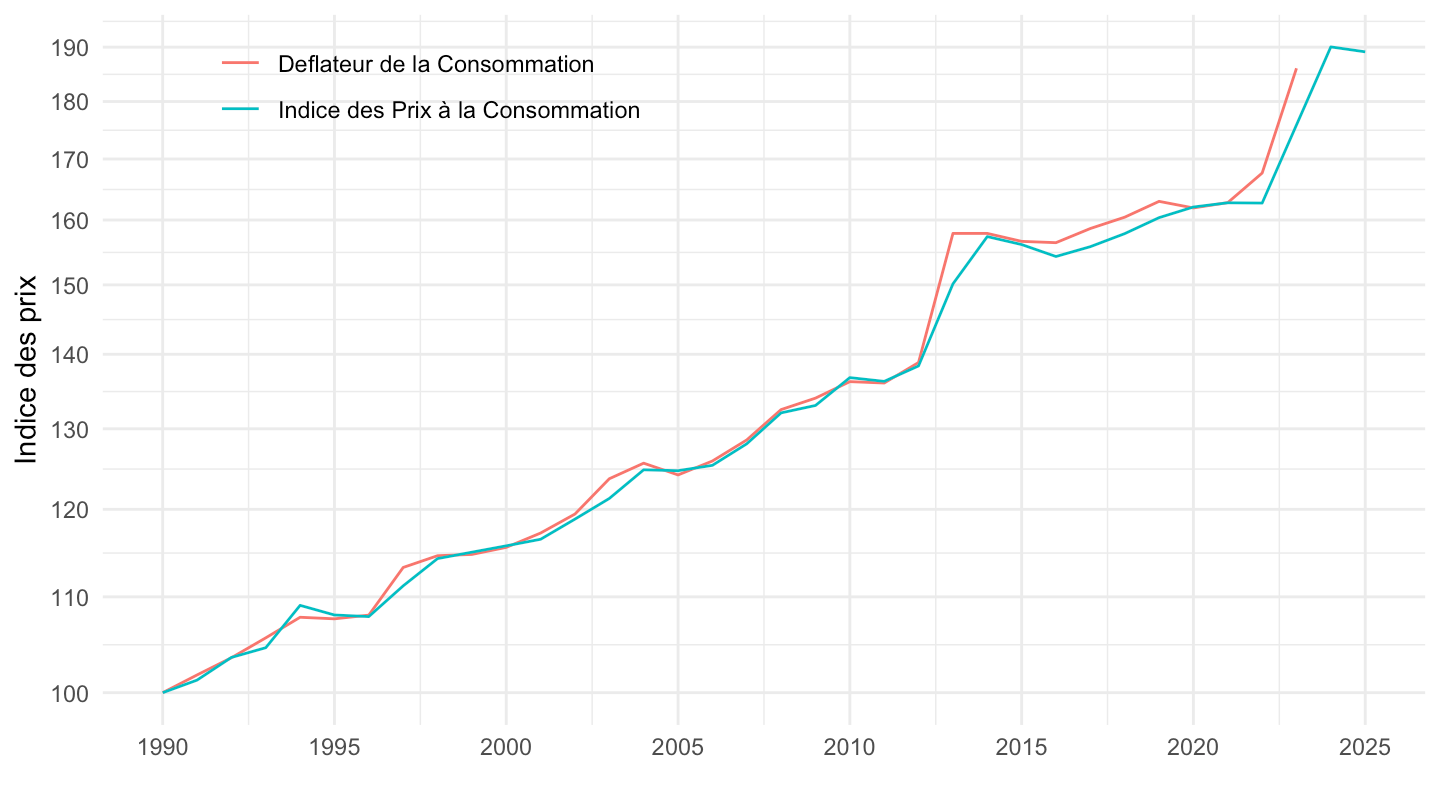
T_CONSO_EFF_FONCTION |>
  filter(fonction =="CP041",
         variable == "IPRIX2020") |>
  year_to_date2() |>
  filter(date >= as.Date("1990-01-01")) |>
  mutate(variable = "Deflateur de la Consommation") |>
  select(variable, date, value) |>
  bind_rows(`IPC-2015` |>
              filter(INDICATEUR == "IPC",
                     MENAGES_IPC == "ENSEMBLE",
                     COICOP2016 %in% c("041"),
                     FREQ == "M",
                     REF_AREA == "FE",
                     NATURE == "INDICE") |>
              month_to_date() |>
              filter(month(date) == 1) |>
              select(date, value = OBS_VALUE) |>
              mutate(variable = "Indice des Prix à la Consommation")) |>
  group_by(variable) |>
  mutate(value = 100*value/value[date == as.Date("1990-01-01")]) |>
  ggplot() + ylab("Indice des prix") + xlab("") + theme_minimal() +
  geom_line(aes(x = date, y = value, color = variable)) +

  scale_x_date(breaks = seq(1920, 2100, 5) |> paste0("-01-01") |> as.Date(),
               labels = date_format("%Y")) +
  theme(legend.position = c(0.25, 0.9),
        legend.title = element_blank()) +
  scale_y_log10(breaks = seq(0, 500, 10),
                     labels = dollar_format(accuracy = 1, prefix = ""))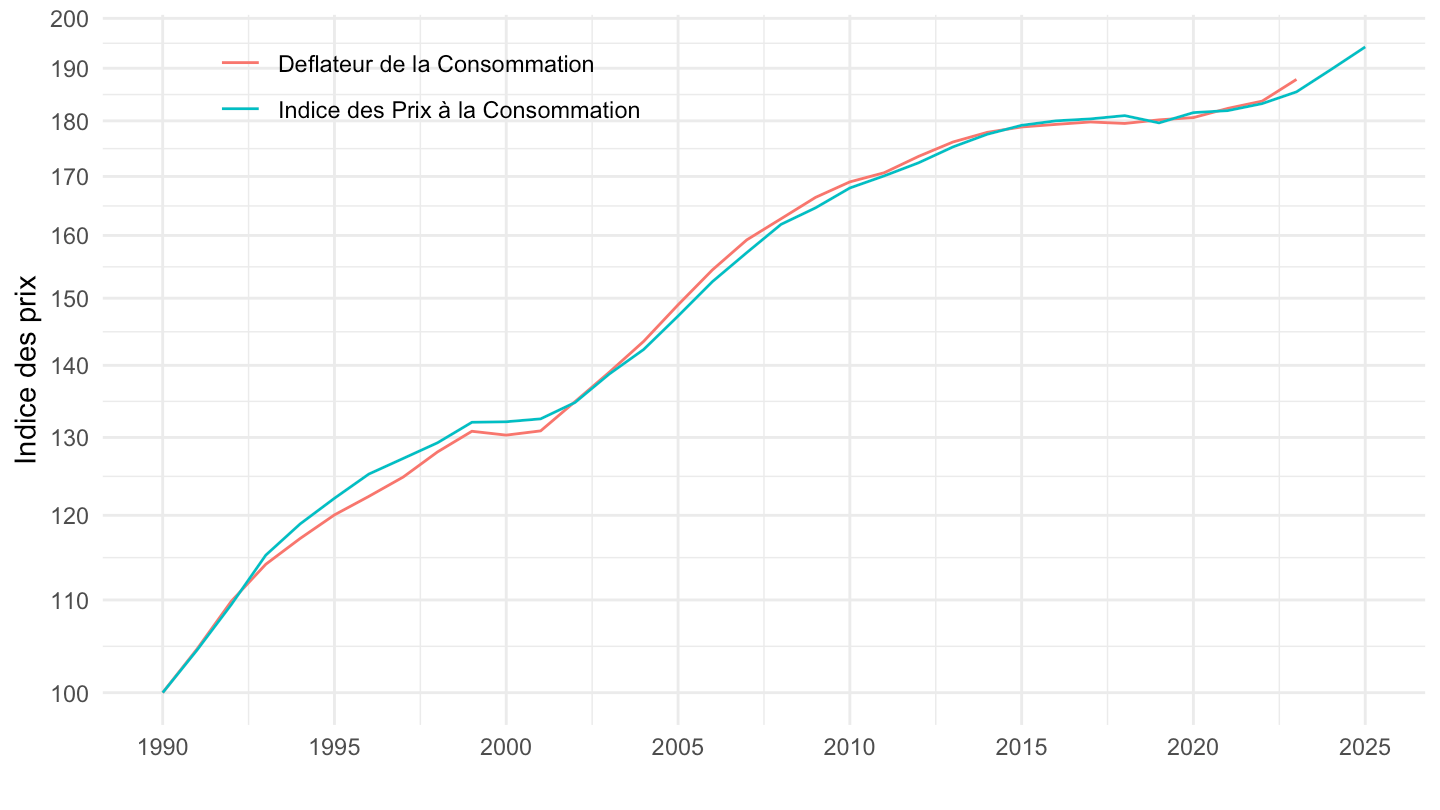
T_CONSO_EFF_FONCTION |>
  filter(fonction =="CP043",
         variable == "IPRIX2020") |>
  year_to_date2() |>
  filter(date >= as.Date("1990-01-01")) |>
  mutate(variable = "Deflateur de la Consommation") |>
  select(variable, date, value) |>
  bind_rows(`IPC-2015` |>
              filter(INDICATEUR == "IPC",
                     MENAGES_IPC == "ENSEMBLE",
                     COICOP2016 %in% c("043"),
                     FREQ == "M",
                     REF_AREA == "FE",
                     NATURE == "INDICE") |>
              month_to_date() |>
              filter(month(date) == 1) |>
              select(date, value = OBS_VALUE) |>
              mutate(variable = "Indice des Prix à la Consommation")) |>
  group_by(variable) |>
  mutate(value = 100*value/value[date == as.Date("1990-01-01")]) |>
  ggplot() + ylab("Indice des prix") + xlab("") + theme_minimal() +
  geom_line(aes(x = date, y = value, color = variable)) +

  scale_x_date(breaks = seq(1920, 2100, 5) |> paste0("-01-01") |> as.Date(),
               labels = date_format("%Y")) +
  theme(legend.position = c(0.75, 0.9),
        legend.title = element_blank()) +
  scale_y_log10(breaks = seq(0, 500, 10),
                     labels = dollar_format(accuracy = 1, prefix = ""))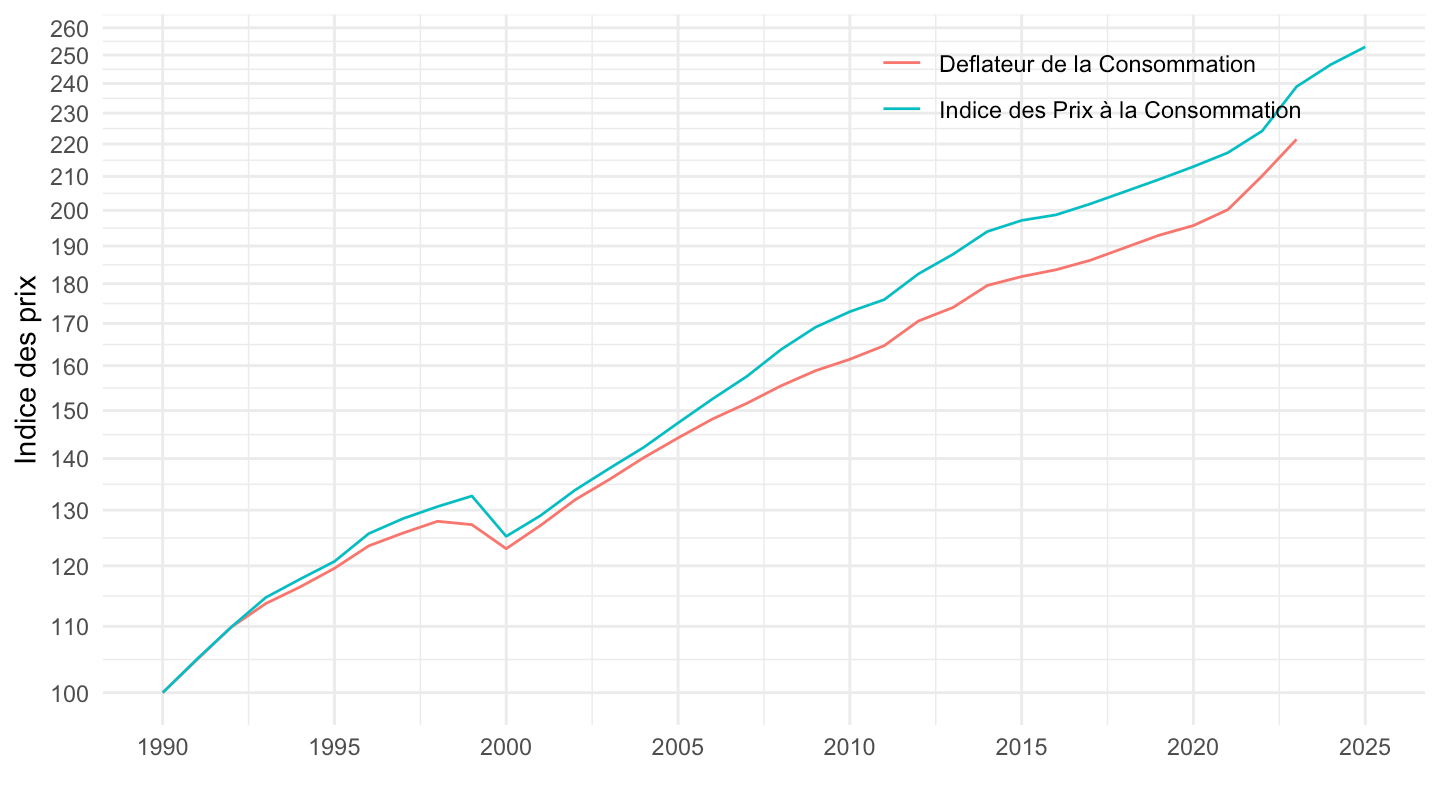
T_CONSO_EFF_FONCTION |>
  filter(fonction =="CP044",
         variable == "IPRIX2020") |>
  year_to_date2() |>
  filter(date >= as.Date("1990-01-01")) |>
  mutate(variable = "Deflateur de la Consommation") |>
  select(variable, date, value) |>
  bind_rows(`IPC-2015` |>
              filter(INDICATEUR == "IPC",
                     MENAGES_IPC == "ENSEMBLE",
                     COICOP2016 %in% c("044"),
                     FREQ == "M",
                     REF_AREA == "FE",
                     NATURE == "INDICE") |>
              month_to_date() |>
              filter(month(date) == 1) |>
              select(date, value = OBS_VALUE) |>
              mutate(variable = "Indice des Prix à la Consommation")) |>
  group_by(variable) |>
  mutate(value = 100*value/value[date == as.Date("1990-01-01")]) |>
  ggplot() + ylab("Indice des prix") + xlab("") + theme_minimal() +
  geom_line(aes(x = date, y = value, color = variable)) +

  scale_x_date(breaks = seq(1920, 2100, 5) |> paste0("-01-01") |> as.Date(),
               labels = date_format("%Y")) +
  theme(legend.position = c(0.25, 0.9),
        legend.title = element_blank()) +
  scale_y_log10(breaks = seq(0, 500, 10),
                     labels = dollar_format(accuracy = 1, prefix = ""))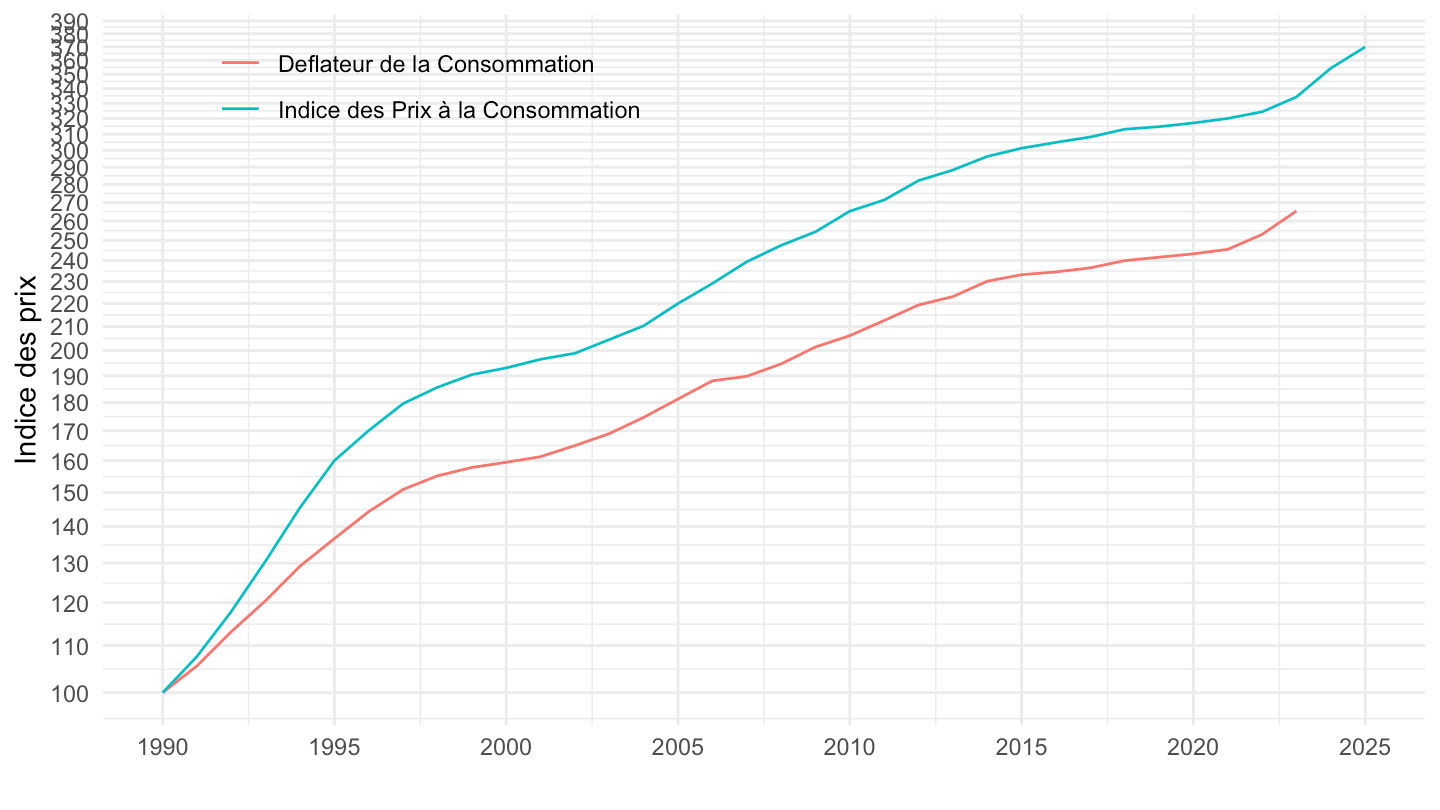
T_CONSO_EFF_FONCTION |>
  filter(fonction =="CP051",
         variable == "IPRIX2020") |>
  year_to_date2() |>
  filter(date >= as.Date("1990-01-01")) |>
  mutate(variable = "Deflateur de la Consommation") |>
  select(variable, date, value) |>
  bind_rows(`IPC-2015` |>
              filter(INDICATEUR == "IPC",
                     MENAGES_IPC == "ENSEMBLE",
                     COICOP2016 %in% c("051"),
                     FREQ == "M",
                     REF_AREA == "FE",
                     NATURE == "INDICE") |>
              month_to_date() |>
              filter(month(date) == 1) |>
              select(date, value = OBS_VALUE) |>
              mutate(variable = "Indice des Prix à la Consommation")) |>
  group_by(variable) |>
  mutate(value = 100*value/value[date == as.Date("1990-01-01")]) |>
  ggplot() + ylab("Indice des prix") + xlab("") + theme_minimal() +
  geom_line(aes(x = date, y = value, color = variable)) +

  scale_x_date(breaks = seq(1920, 2100, 5) |> paste0("-01-01") |> as.Date(),
               labels = date_format("%Y")) +
  theme(legend.position = c(0.25, 0.9),
        legend.title = element_blank()) +
  scale_y_log10(breaks = seq(0, 500, 10),
                     labels = dollar_format(accuracy = 1, prefix = ""))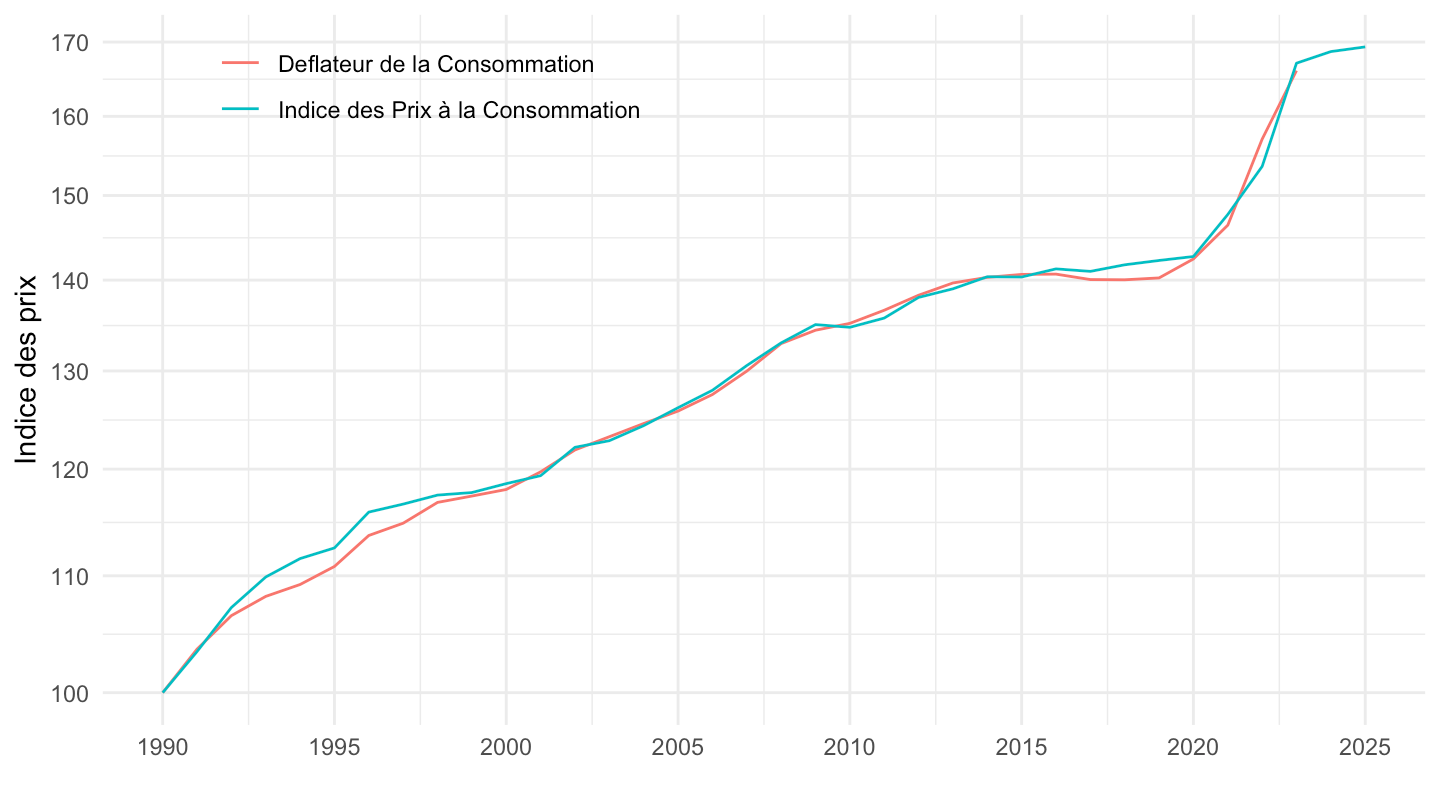
T_CONSO_EFF_FONCTION |>
  filter(fonction =="CP052",
         variable == "IPRIX2020") |>
  year_to_date2() |>
  filter(date >= as.Date("1990-01-01")) |>
  mutate(variable = "Deflateur de la Consommation") |>
  select(variable, date, value) |>
  bind_rows(`IPC-2015` |>
              filter(INDICATEUR == "IPC",
                     MENAGES_IPC == "ENSEMBLE",
                     COICOP2016 %in% c("052"),
                     FREQ == "M",
                     REF_AREA == "FE",
                     NATURE == "INDICE") |>
              month_to_date() |>
              filter(month(date) == 1) |>
              select(date, value = OBS_VALUE) |>
              mutate(variable = "Indice des Prix à la Consommation")) |>
  group_by(variable) |>
  mutate(value = 100*value/value[date == as.Date("1990-01-01")]) |>
  ggplot() + ylab("Indice des prix") + xlab("") + theme_minimal() +
  geom_line(aes(x = date, y = value, color = variable)) +

  scale_x_date(breaks = seq(1920, 2100, 5) |> paste0("-01-01") |> as.Date(),
               labels = date_format("%Y")) +
  theme(legend.position = c(0.25, 0.9),
        legend.title = element_blank()) +
  scale_y_log10(breaks = seq(0, 500, 10),
                     labels = dollar_format(accuracy = 1, prefix = ""))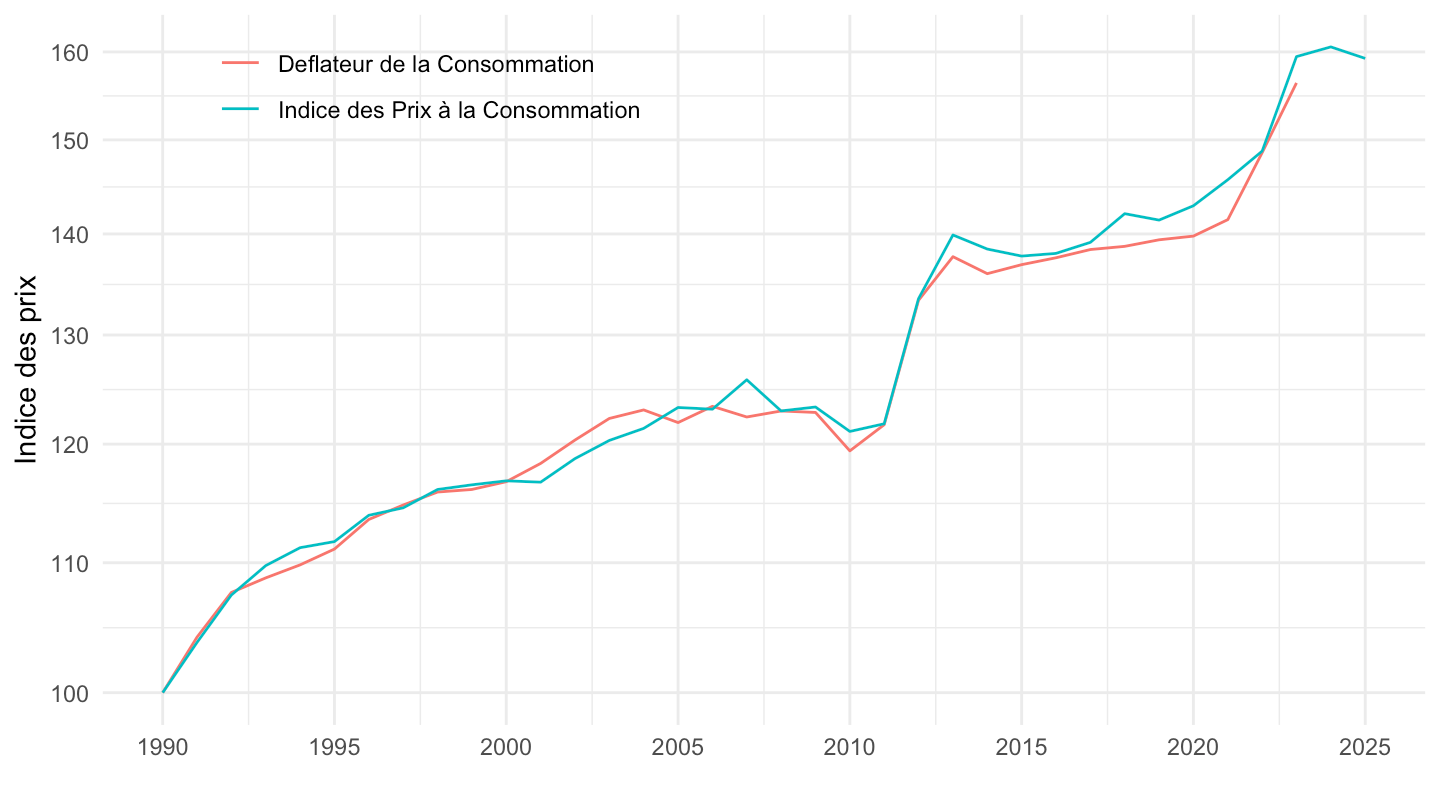
T_CONSO_EFF_FONCTION |>
  filter(fonction =="CP053",
         variable == "IPRIX2020") |>
  year_to_date2() |>
  filter(date >= as.Date("1990-01-01")) |>
  mutate(variable = "Deflateur de la Consommation") |>
  select(variable, date, value) |>
  bind_rows(`IPC-2015` |>
              filter(INDICATEUR == "IPC",
                     MENAGES_IPC == "ENSEMBLE",
                     COICOP2016 %in% c("053"),
                     FREQ == "M",
                     REF_AREA == "FE",
                     NATURE == "INDICE") |>
              month_to_date() |>
              filter(month(date) == 1) |>
              select(date, value = OBS_VALUE) |>
              mutate(variable = "Indice des Prix à la Consommation")) |>
  group_by(variable) |>
  mutate(value = 100*value/value[date == as.Date("1990-01-01")]) |>
  ggplot() + ylab("Indice des prix") + xlab("") + theme_minimal() +
  geom_line(aes(x = date, y = value, color = variable)) +

  scale_x_date(breaks = seq(1920, 2100, 5) |> paste0("-01-01") |> as.Date(),
               labels = date_format("%Y")) +
  theme(legend.position = c(0.25, 0.2),
        legend.title = element_blank()) +
  scale_y_log10(breaks = seq(0, 500, 10),
                     labels = dollar_format(accuracy = 1, prefix = ""))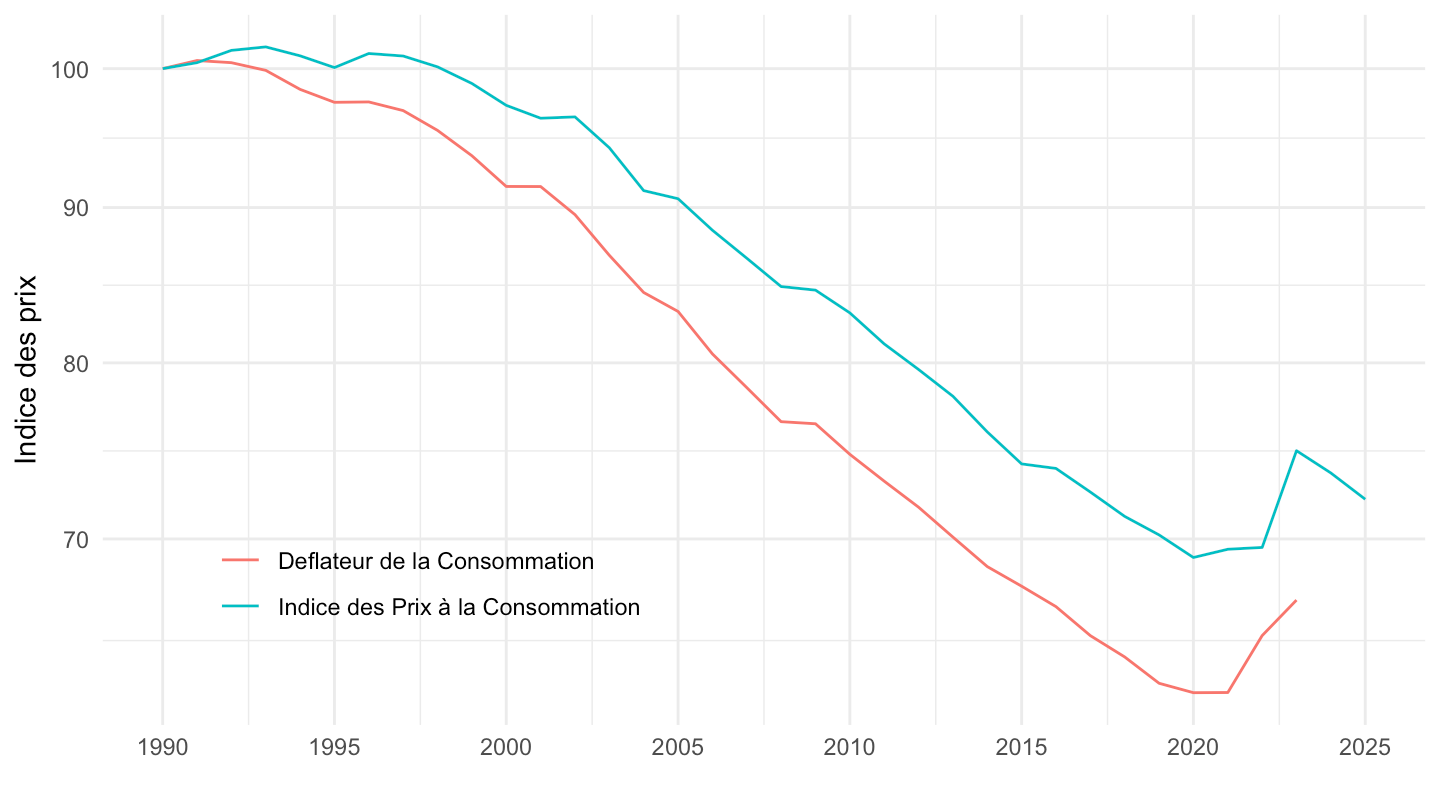
T_CONSO_EFF_FONCTION |>
  filter(fonction =="CP054",
         variable == "IPRIX2020") |>
  year_to_date2() |>
  filter(date >= as.Date("1990-01-01")) |>
  mutate(variable = "Deflateur de la Consommation") |>
  select(variable, date, value) |>
  bind_rows(`IPC-2015` |>
              filter(INDICATEUR == "IPC",
                     MENAGES_IPC == "ENSEMBLE",
                     COICOP2016 %in% c("054"),
                     FREQ == "M",
                     REF_AREA == "FE",
                     NATURE == "INDICE") |>
              month_to_date() |>
              filter(month(date) == 1) |>
              select(date, value = OBS_VALUE) |>
              mutate(variable = "Indice des Prix à la Consommation")) |>
  group_by(variable) |>
  mutate(value = 100*value/value[date == as.Date("1990-01-01")]) |>
  ggplot() + ylab("Indice des prix") + xlab("") + theme_minimal() +
  geom_line(aes(x = date, y = value, color = variable)) +

  scale_x_date(breaks = seq(1920, 2100, 5) |> paste0("-01-01") |> as.Date(),
               labels = date_format("%Y")) +
  theme(legend.position = c(0.25, 0.9),
        legend.title = element_blank()) +
  scale_y_log10(breaks = seq(0, 500, 10),
                     labels = dollar_format(accuracy = 1, prefix = ""))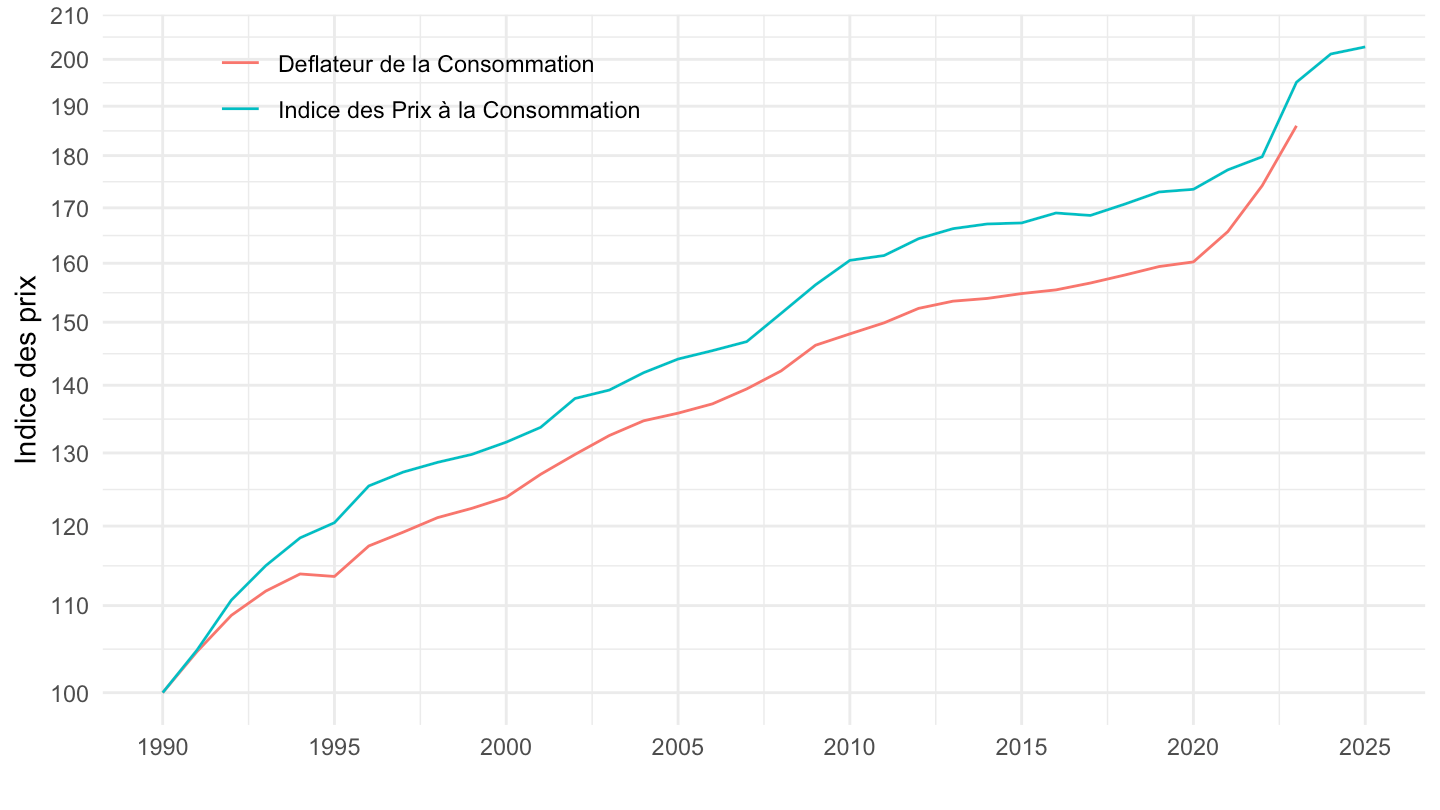
T_CONSO_EFF_FONCTION |>
  filter(fonction =="CP055",
         variable == "IPRIX2020") |>
  year_to_date2() |>
  filter(date >= as.Date("1990-01-01")) |>
  mutate(variable = "Deflateur de la Consommation") |>
  select(variable, date, value) |>
  bind_rows(`IPC-2015` |>
              filter(INDICATEUR == "IPC",
                     MENAGES_IPC == "ENSEMBLE",
                     COICOP2016 %in% c("055"),
                     FREQ == "M",
                     REF_AREA == "FE",
                     NATURE == "INDICE") |>
              month_to_date() |>
              filter(month(date) == 1) |>
              select(date, value = OBS_VALUE) |>
              mutate(variable = "Indice des Prix à la Consommation")) |>
  group_by(variable) |>
  mutate(value = 100*value/value[date == as.Date("1990-01-01")]) |>
  ggplot() + ylab("Indice des prix") + xlab("") + theme_minimal() +
  geom_line(aes(x = date, y = value, color = variable)) +

  scale_x_date(breaks = seq(1920, 2100, 5) |> paste0("-01-01") |> as.Date(),
               labels = date_format("%Y")) +
  theme(legend.position = c(0.25, 0.9),
        legend.title = element_blank()) +
  scale_y_log10(breaks = seq(0, 500, 10),
                     labels = dollar_format(accuracy = 1, prefix = ""))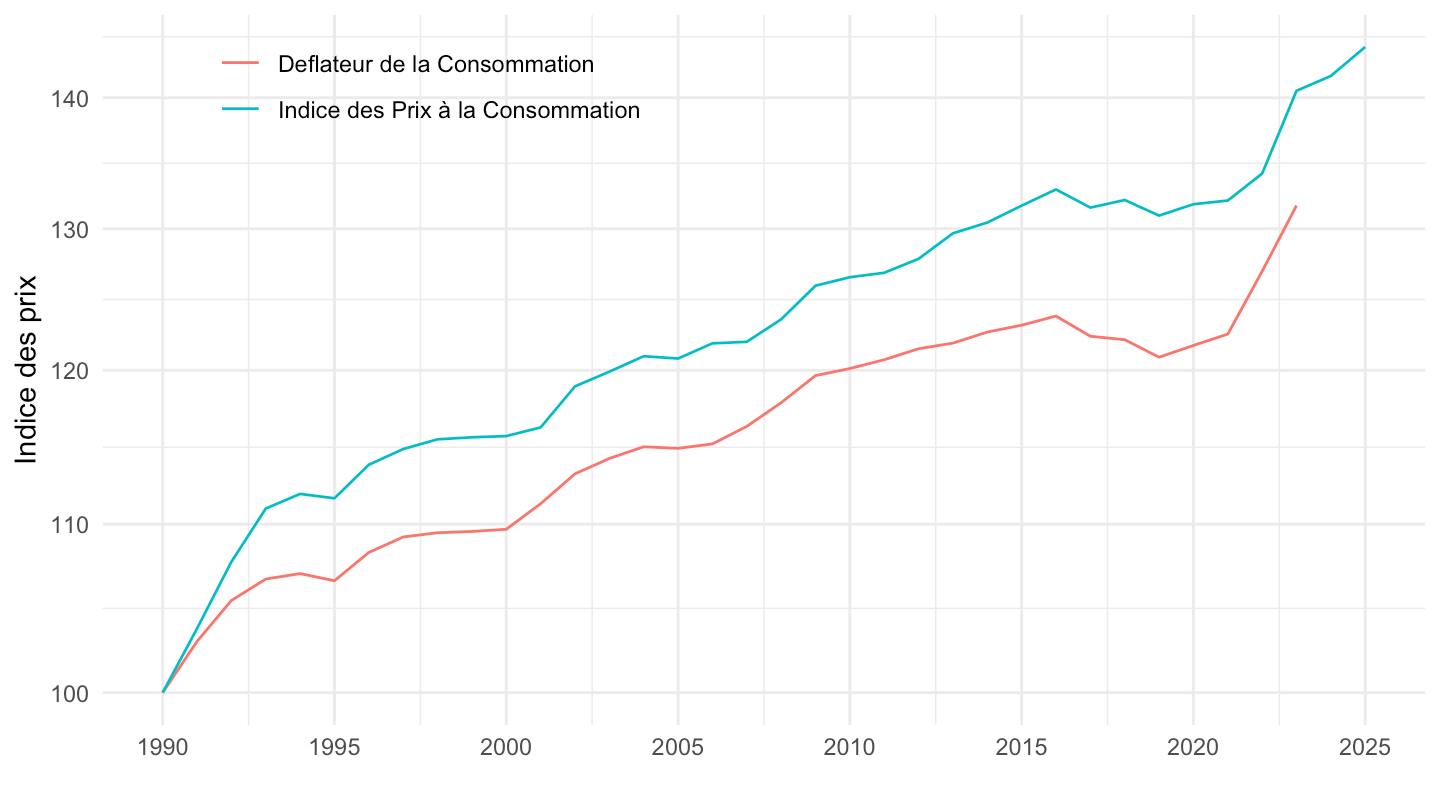
T_CONSO_EFF_FONCTION |>
  filter(fonction =="CP056",
         variable == "IPRIX2020") |>
  year_to_date2() |>
  filter(date >= as.Date("1990-01-01")) |>
  mutate(variable = "Deflateur de la Consommation") |>
  select(variable, date, value) |>
  bind_rows(`IPC-2015` |>
              filter(INDICATEUR == "IPC",
                     MENAGES_IPC == "ENSEMBLE",
                     COICOP2016 %in% c("056"),
                     FREQ == "M",
                     REF_AREA == "FE",
                     NATURE == "INDICE") |>
              month_to_date() |>
              filter(month(date) == 1) |>
              select(date, value = OBS_VALUE) |>
              mutate(variable = "Indice des Prix à la Consommation")) |>
  group_by(variable) |>
  mutate(value = 100*value/value[date == as.Date("1990-01-01")]) |>
  ggplot() + ylab("Indice des prix") + xlab("") + theme_minimal() +
  geom_line(aes(x = date, y = value, color = variable)) +

  scale_x_date(breaks = seq(1920, 2100, 5) |> paste0("-01-01") |> as.Date(),
               labels = date_format("%Y")) +
  theme(legend.position = c(0.25, 0.9),
        legend.title = element_blank()) +
  scale_y_log10(breaks = seq(0, 500, 10),
                     labels = dollar_format(accuracy = 1, prefix = ""))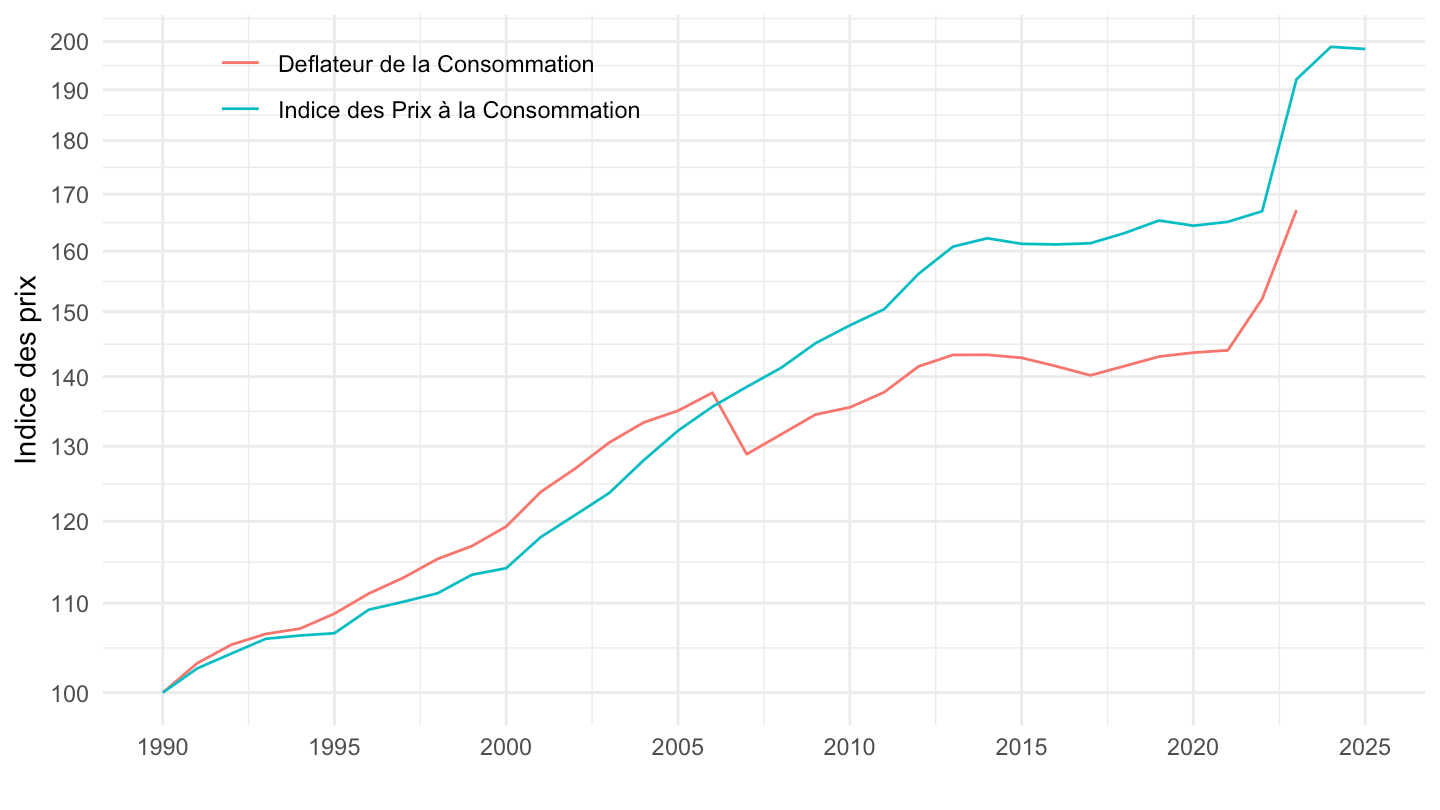
T_CONSO_EFF_FONCTION |>
  filter(fonction =="CP072",
         variable == "IPRIX2020") |>
  year_to_date2() |>
  filter(date >= as.Date("1990-01-01")) |>
  mutate(variable = "Deflateur de la Consommation") |>
  select(variable, date, value) |>
  bind_rows(`IPC-2015` |>
              filter(INDICATEUR == "IPC",
                     MENAGES_IPC == "ENSEMBLE",
                     COICOP2016 %in% c("072"),
                     FREQ == "M",
                     REF_AREA == "FE",
                     NATURE == "INDICE") |>
              month_to_date() |>
              filter(month(date) == 1) |>
              select(date, value = OBS_VALUE) |>
              mutate(variable = "Indice des Prix à la Consommation")) |>
  group_by(variable) |>
  mutate(value = 100*value/value[date == as.Date("1990-01-01")]) |>
  ggplot() + ylab("Indice des prix") + xlab("") + theme_minimal() +
  geom_line(aes(x = date, y = value, color = variable)) +

  scale_x_date(breaks = seq(1920, 2100, 5) |> paste0("-01-01") |> as.Date(),
               labels = date_format("%Y")) +
  theme(legend.position = c(0.25, 0.9),
        legend.title = element_blank()) +
  scale_y_log10(breaks = seq(0, 500, 10),
                     labels = dollar_format(accuracy = 1, prefix = ""))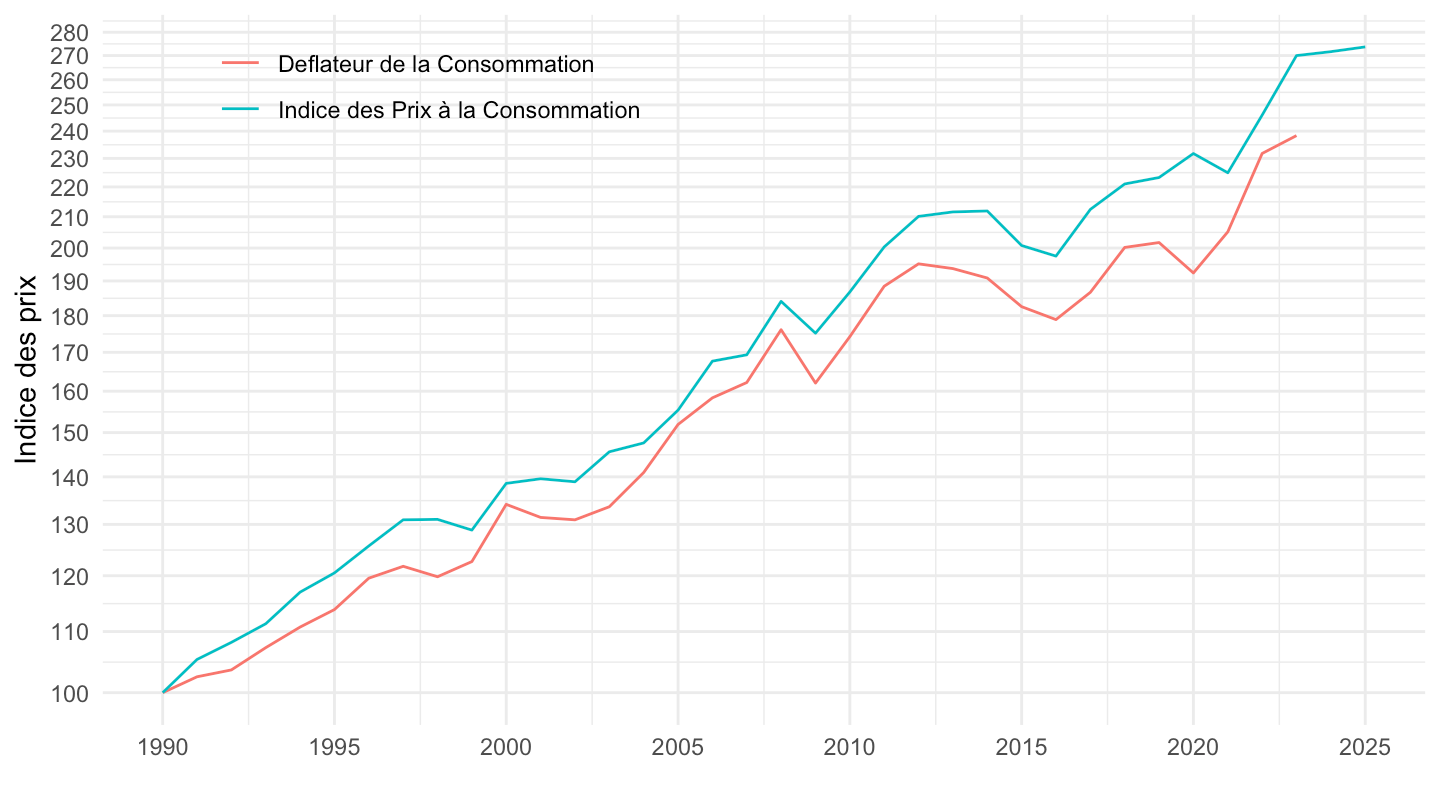
T_CONSO_EFF_FONCTION |>
  filter(fonction =="CP081",
         variable == "IPRIX2020") |>
  year_to_date2() |>
  filter(date >= as.Date("1990-01-01")) |>
  mutate(variable = "Deflateur de la Consommation") |>
  select(variable, date, value) |>
  bind_rows(`IPC-2015` |>
              filter(INDICATEUR == "IPC",
                     MENAGES_IPC == "ENSEMBLE",
                     COICOP2016 %in% c("081"),
                     FREQ == "M",
                     REF_AREA == "FE",
                     NATURE == "INDICE") |>
              month_to_date() |>
              filter(month(date) == 1) |>
              select(date, value = OBS_VALUE) |>
              mutate(variable = "Indice des Prix à la Consommation")) |>
  group_by(variable) |>
  mutate(value = 100*value/value[date == as.Date("1990-01-01")]) |>
  ggplot() + ylab("Indice des prix") + xlab("") + theme_minimal() +
  geom_line(aes(x = date, y = value, color = variable)) +

  scale_x_date(breaks = seq(1920, 2100, 5) |> paste0("-01-01") |> as.Date(),
               labels = date_format("%Y")) +
  theme(legend.position = c(0.75, 0.9),
        legend.title = element_blank()) +
  scale_y_log10(breaks = seq(0, 500, 10),
                     labels = dollar_format(accuracy = 1, prefix = ""))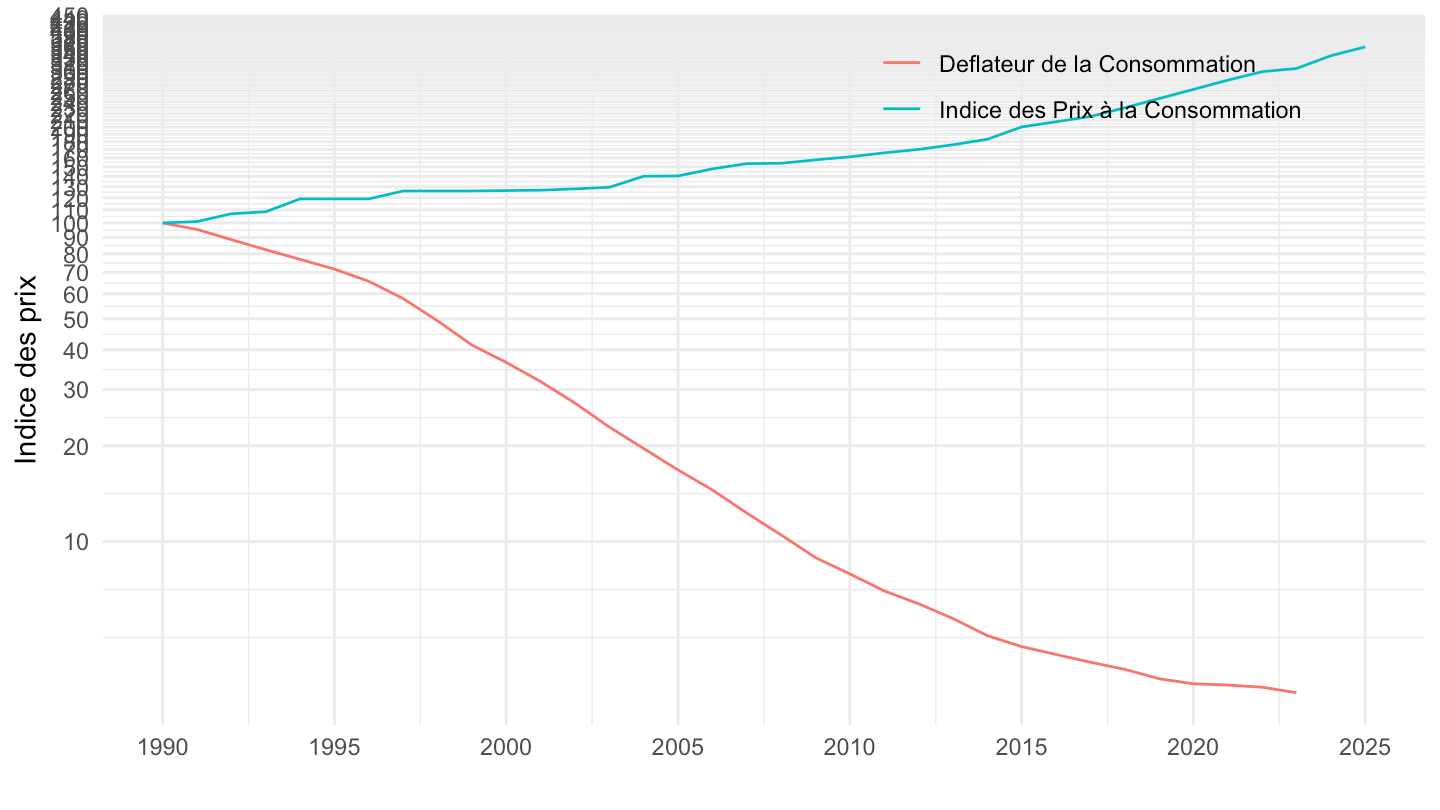
T_CONSO_EFF_FONCTION |>
  filter(fonction =="CP082",
         variable == "IPRIX2020") |>
  year_to_date2() |>
  filter(date >= as.Date("1990-01-01")) |>
  mutate(variable = "Deflateur de la Consommation") |>
  select(variable, date, value) |>
  bind_rows(`IPC-2015` |>
              filter(INDICATEUR == "IPC",
                     MENAGES_IPC == "ENSEMBLE",
                     COICOP2016 %in% c("082"),
                     FREQ == "M",
                     REF_AREA == "FE",
                     NATURE == "INDICE") |>
              month_to_date() |>
              filter(month(date) == 1) |>
              select(date, value = OBS_VALUE) |>
              mutate(variable = "Indice des Prix à la Consommation")) |>
  group_by(variable) |>
  mutate(value = 100*value/value[date == as.Date("1993-01-01")]) |>
  ggplot() + ylab("Indice des prix (1993=100)") + xlab("") + theme_minimal() +
  geom_line(aes(x = date, y = value, color = variable)) +

  scale_x_date(breaks = seq(1920, 2100, 5) |> paste0("-01-01") |> as.Date(),
               labels = date_format("%Y")) +
  theme(legend.position = c(0.75, 0.9),
        legend.title = element_blank()) +
  scale_y_log10(breaks = c(1, 2, 3, 5, 8, 10, 20, 30, 50, 100),
                     labels = dollar_format(accuracy = 1, prefix = ""))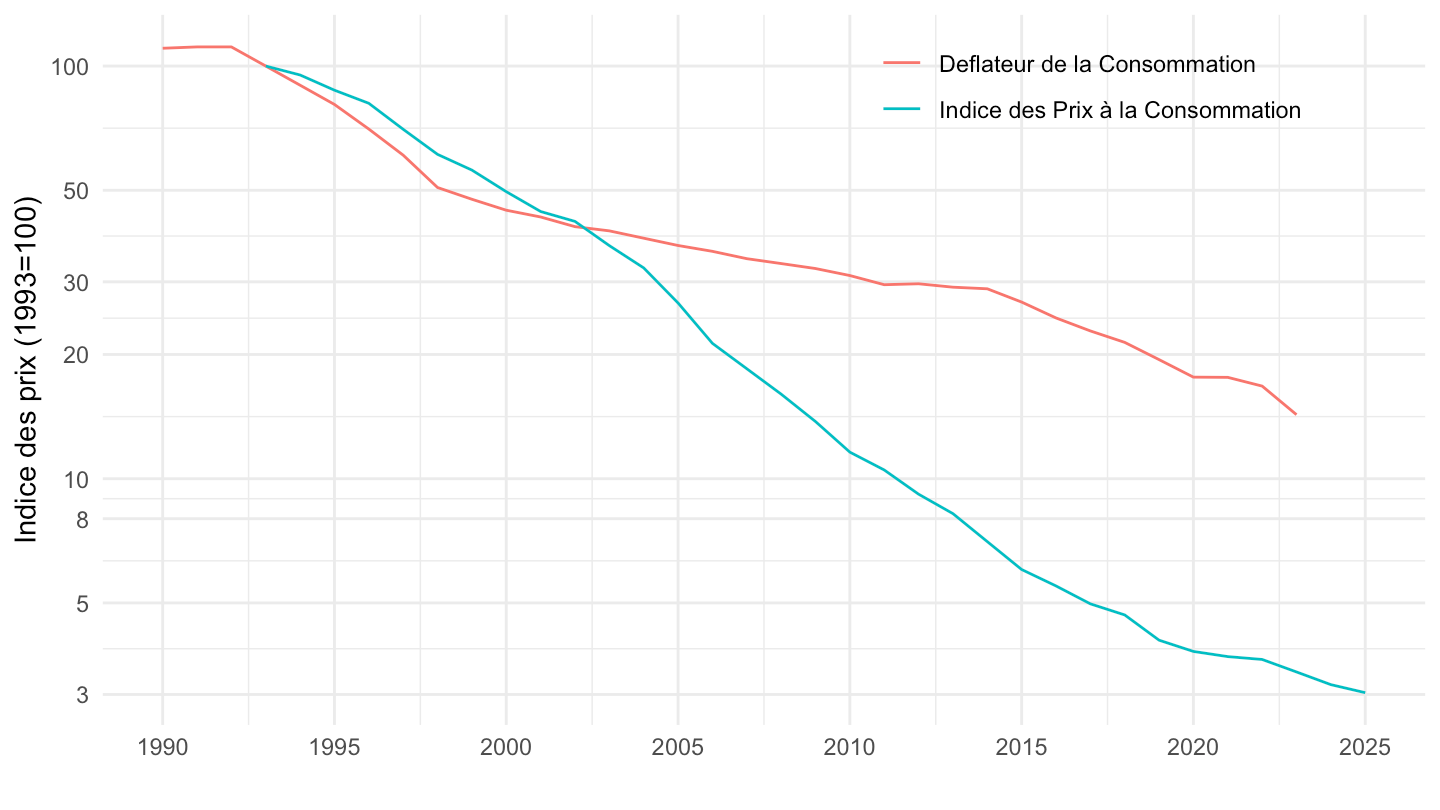
T_CONSO_EFF_FONCTION |>
  filter(fonction =="CP082",
         variable == "IPRIX2020") |>
  year_to_date2() |>
  filter(date >= as.Date("1996-01-01")) |>
  mutate(variable = "Deflateur de la Consommation") |>
  select(variable, date, value) |>
  bind_rows(`IPC-2015` |>
              filter(INDICATEUR == "IPC",
                     MENAGES_IPC == "ENSEMBLE",
                     COICOP2016 %in% c("082"),
                     FREQ == "M",
                     REF_AREA == "FE",
                     NATURE == "INDICE") |>
              month_to_date() |>
              filter(month(date) == 1,
                     date >= as.Date("1996-01-01")) |>
              select(date, value = OBS_VALUE) |>
              mutate(variable = "Indice des Prix à la Consommation")) |>
  group_by(variable) |>
  mutate(value = 100*value/value[date == as.Date("1996-01-01")]) |>
  ggplot() + ylab("Indice des prix (1996=100)") + xlab("") + theme_minimal() +
  geom_line(aes(x = date, y = value, color = variable)) +

  scale_x_date(breaks = seq(1920, 2100, 2) |> paste0("-01-01") |> as.Date(),
               labels = date_format("%Y")) +
  theme(legend.position = c(0.75, 0.9),
        legend.title = element_blank()) +
  scale_y_log10(breaks = c(1, 2, 3, 5, 8, 10, 20, 30, 50, 100),
                     labels = dollar_format(accuracy = 1, prefix = ""))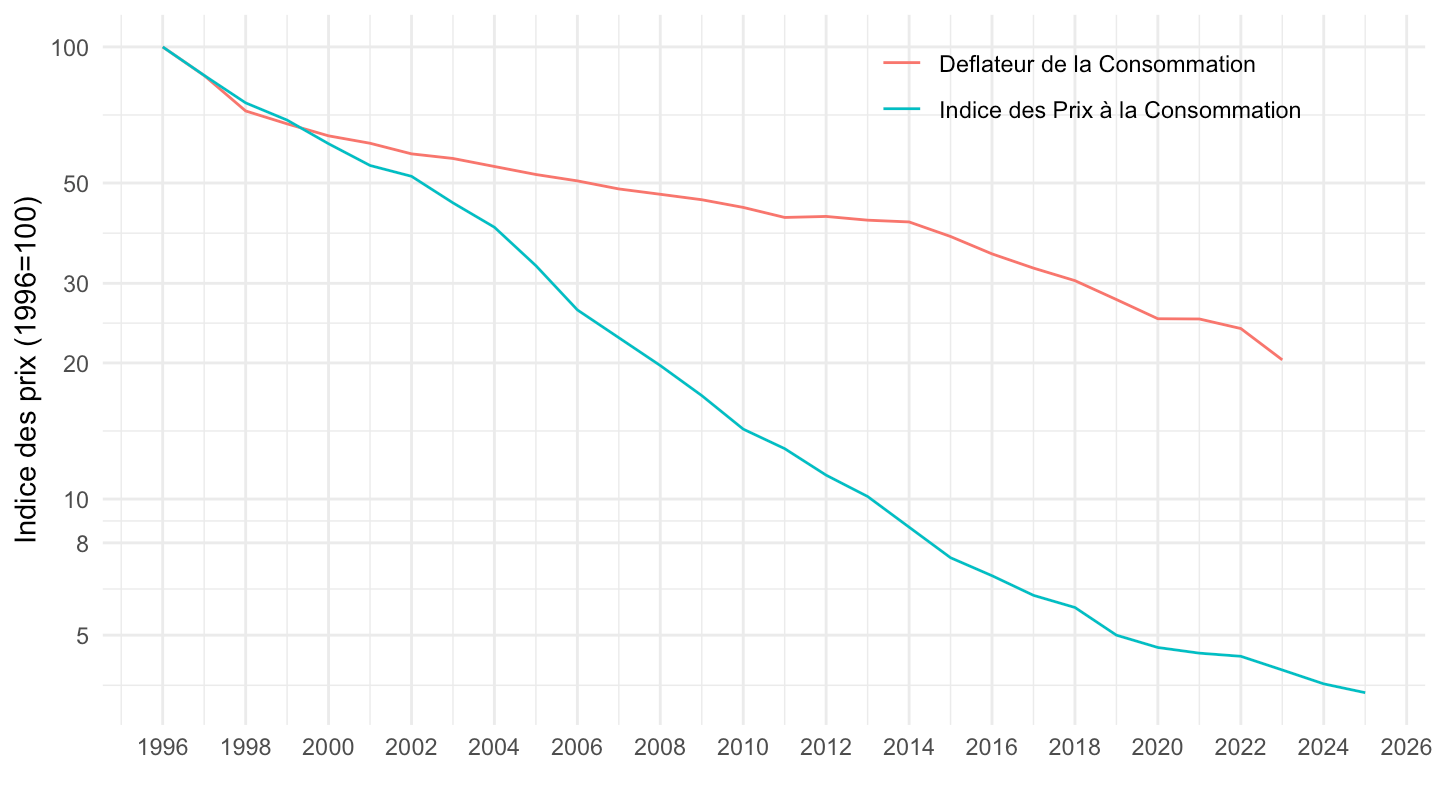
T_CONSO_EFF_FONCTION |>
  filter(fonction =="CP083",
         variable == "IPRIX2020") |>
  year_to_date2() |>
  filter(date >= as.Date("1990-01-01")) |>
  mutate(variable = "Deflateur de la Consommation") |>
  select(variable, date, value) |>
  bind_rows(`IPC-2015` |>
              filter(INDICATEUR == "IPC",
                     MENAGES_IPC == "ENSEMBLE",
                     COICOP2016 %in% c("083"),
                     FREQ == "M",
                     REF_AREA == "FE",
                     NATURE == "INDICE") |>
              month_to_date() |>
              filter(month(date) == 1) |>
              select(date, value = OBS_VALUE) |>
              mutate(variable = "Indice des Prix à la Consommation")) |>
  group_by(variable) |>
  mutate(value = 100*value/value[date == as.Date("1990-01-01")]) |>
  ggplot() + ylab("Indice des prix") + xlab("") + theme_minimal() +
  geom_line(aes(x = date, y = value, color = variable)) +

  scale_x_date(breaks = seq(1920, 2100, 5) |> paste0("-01-01") |> as.Date(),
               labels = date_format("%Y")) +
  theme(legend.position = c(0.25, 0.2),
        legend.title = element_blank()) +
  scale_y_log10(breaks = seq(0, 500, 10),
                     labels = dollar_format(accuracy = 1, prefix = ""))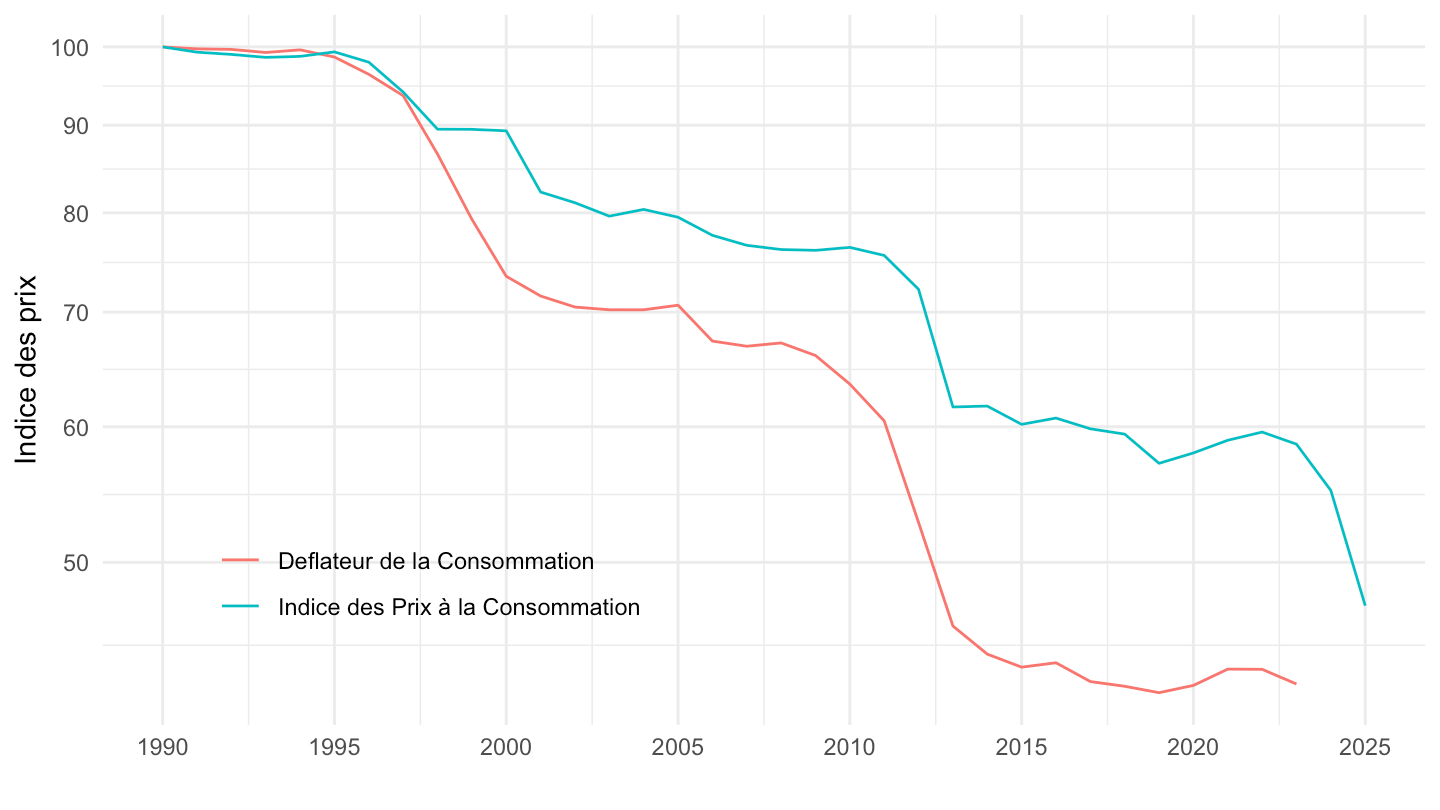
T_CONSO_EFF_FONCTION |>
  filter(fonction =="CP091",
         variable == "IPRIX2020") |>
  year_to_date2() |>
  filter(date >= as.Date("1990-01-01")) |>
  mutate(variable = "Deflateur de la Consommation") |>
  select(variable, date, value) |>
  bind_rows(`IPC-2015` |>
              filter(INDICATEUR == "IPC",
                     MENAGES_IPC == "ENSEMBLE",
                     COICOP2016 %in% c("091"),
                     FREQ == "M",
                     REF_AREA == "FE",
                     NATURE == "INDICE") |>
              month_to_date() |>
              filter(month(date) == 1) |>
              select(date, value = OBS_VALUE) |>
              mutate(variable = "Indice des Prix à la Consommation")) |>
  group_by(variable) |>
  mutate(value = 100*value/value[date == as.Date("1990-01-01")]) |>
  ggplot() + ylab("Indice des prix") + xlab("") + theme_minimal() +
  geom_line(aes(x = date, y = value, color = variable)) +

  scale_x_date(breaks = seq(1920, 2100, 5) |> paste0("-01-01") |> as.Date(),
               labels = date_format("%Y")) +
  theme(legend.position = c(0.25, 0.3),
        legend.title = element_blank()) +
  scale_y_log10(breaks = c(seq(0, 500, 10), 15),
                     labels = dollar_format(accuracy = 1, prefix = ""))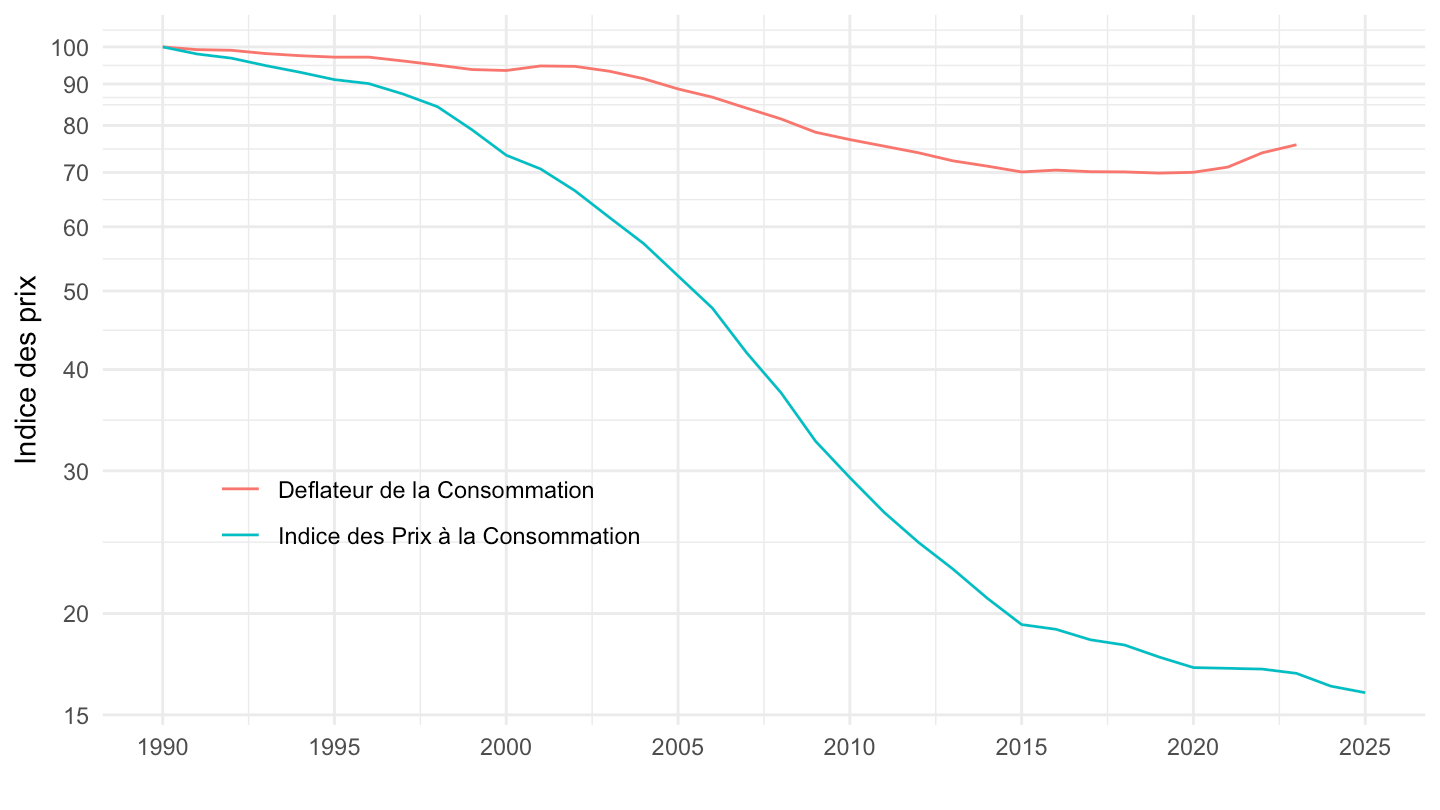
T_CONSO_EFF_FONCTION |>
  filter(fonction =="CP092",
         variable == "IPRIX2020") |>
  year_to_date2() |>
  filter(date >= as.Date("1990-01-01")) |>
  mutate(variable = "Deflateur de la Consommation") |>
  select(variable, date, value) |>
  bind_rows(`IPC-2015` |>
              filter(INDICATEUR == "IPC",
                     MENAGES_IPC == "ENSEMBLE",
                     COICOP2016 %in% c("092"),
                     FREQ == "M",
                     REF_AREA == "FE",
                     NATURE == "INDICE") |>
              month_to_date() |>
              filter(month(date) == 1) |>
              select(date, value = OBS_VALUE) |>
              mutate(variable = "Indice des Prix à la Consommation")) |>
  group_by(variable) |>
  mutate(value = 100*value/value[date == as.Date("1990-01-01")]) |>
  ggplot() + ylab("Indice des prix") + xlab("") + theme_minimal() +
  geom_line(aes(x = date, y = value, color = variable)) +

  scale_x_date(breaks = seq(1920, 2100, 5) |> paste0("-01-01") |> as.Date(),
               labels = date_format("%Y")) +
  theme(legend.position = c(0.25, 0.3),
        legend.title = element_blank()) +
  scale_y_log10(breaks = c(seq(0, 500, 10), 15),
                     labels = dollar_format(accuracy = 1, prefix = ""))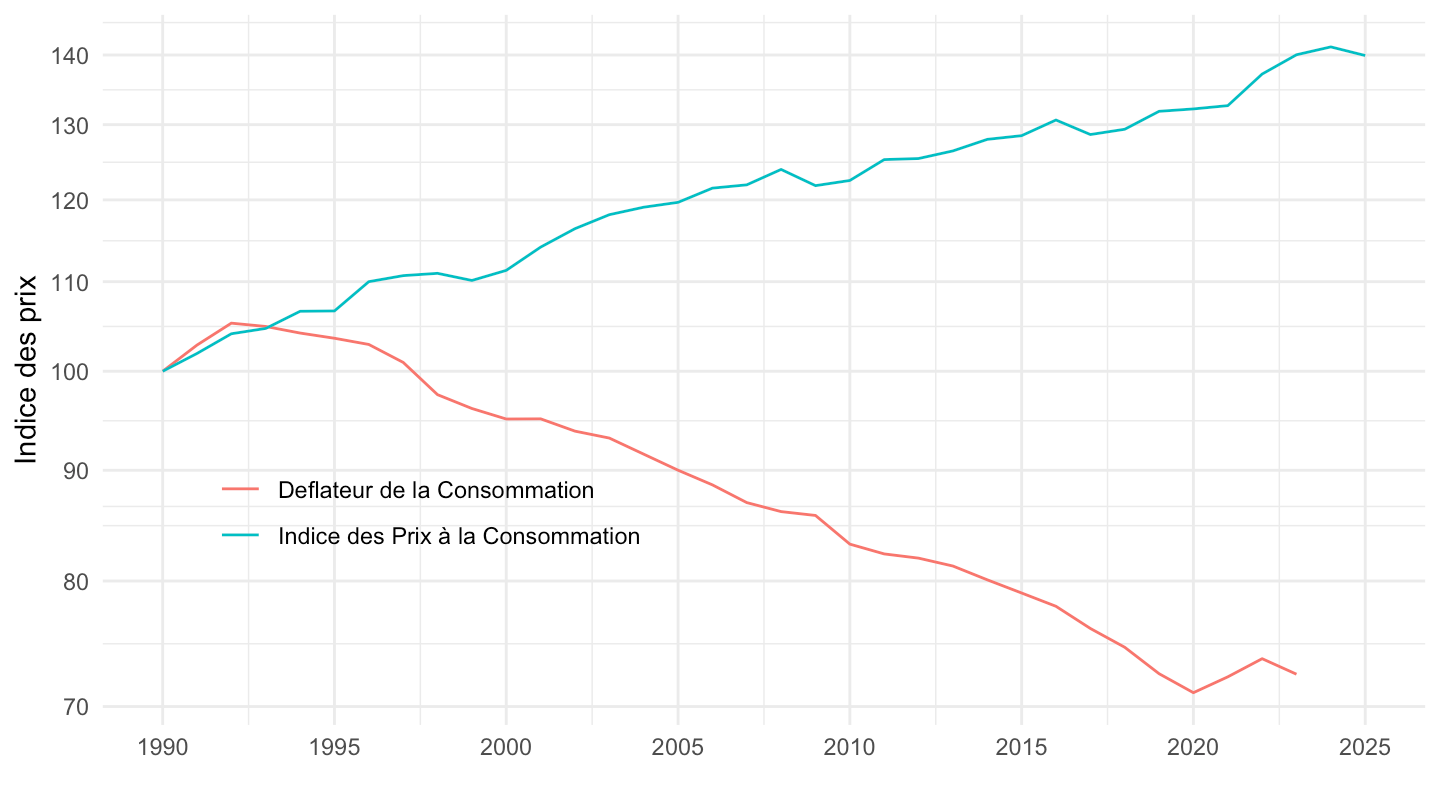
T_CONSO_EFF_FONCTION |>
  filter(fonction =="CP093",
         variable == "IPRIX2020") |>
  year_to_date2() |>
  filter(date >= as.Date("1990-01-01")) |>
  mutate(variable = "Deflateur de la Consommation") |>
  select(variable, date, value) |>
  bind_rows(`IPC-2015` |>
              filter(INDICATEUR == "IPC",
                     MENAGES_IPC == "ENSEMBLE",
                     COICOP2016 %in% c("093"),
                     FREQ == "M",
                     REF_AREA == "FE",
                     NATURE == "INDICE") |>
              month_to_date() |>
              filter(month(date) == 1) |>
              select(date, value = OBS_VALUE) |>
              mutate(variable = "Indice des Prix à la Consommation")) |>
  group_by(variable) |>
  mutate(value = 100*value/value[date == as.Date("1990-01-01")]) |>
  ggplot() + ylab("Indice des prix") + xlab("") + theme_minimal() +
  geom_line(aes(x = date, y = value, color = variable)) +

  scale_x_date(breaks = seq(1920, 2100, 5) |> paste0("-01-01") |> as.Date(),
               labels = date_format("%Y")) +
  theme(legend.position = c(0.25, 0.3),
        legend.title = element_blank()) +
  scale_y_log10(breaks = c(seq(0, 500, 10), 15),
                     labels = dollar_format(accuracy = 1, prefix = ""))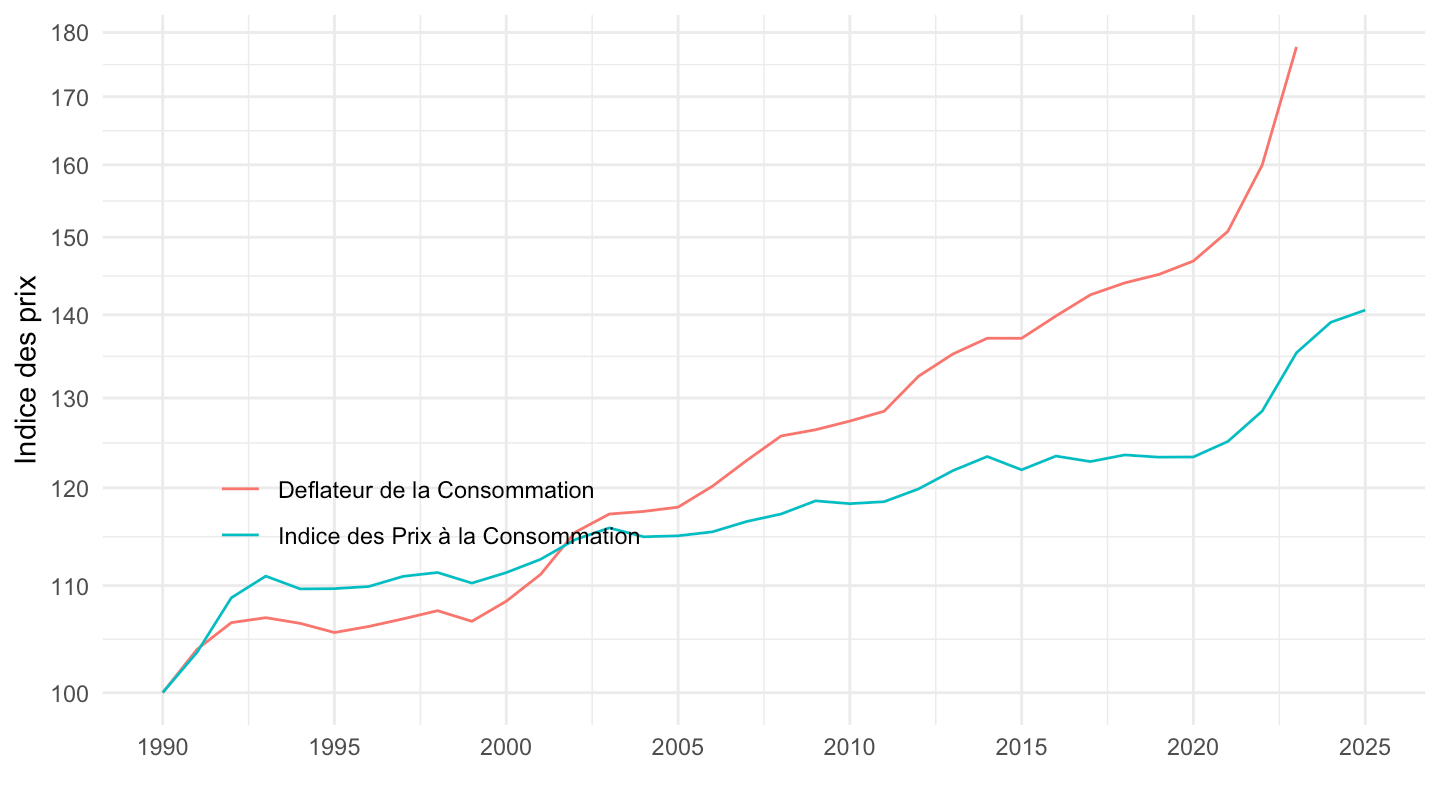
T_CONSO_EFF_FONCTION |>
  filter(fonction =="CP094",
         variable == "IPRIX2020") |>
  year_to_date2() |>
  filter(date >= as.Date("1990-01-01")) |>
  mutate(variable = "Deflateur de la Consommation") |>
  select(variable, date, value) |>
  bind_rows(`IPC-2015` |>
              filter(INDICATEUR == "IPC",
                     MENAGES_IPC == "ENSEMBLE",
                     COICOP2016 %in% c("094"),
                     FREQ == "M",
                     REF_AREA == "FE",
                     NATURE == "INDICE") |>
              month_to_date() |>
              filter(month(date) == 1) |>
              select(date, value = OBS_VALUE) |>
              mutate(variable = "Indice des Prix à la Consommation")) |>
  group_by(variable) |>
  mutate(value = 100*value/value[date == as.Date("1990-01-01")]) |>
  ggplot() + ylab("Indice des prix") + xlab("") + theme_minimal() +
  geom_line(aes(x = date, y = value, color = variable)) +

  scale_x_date(breaks = seq(1920, 2100, 5) |> paste0("-01-01") |> as.Date(),
               labels = date_format("%Y")) +
  theme(legend.position = c(0.25, 0.3),
        legend.title = element_blank()) +
  scale_y_log10(breaks = c(seq(0, 500, 10), 15),
                     labels = dollar_format(accuracy = 1, prefix = ""))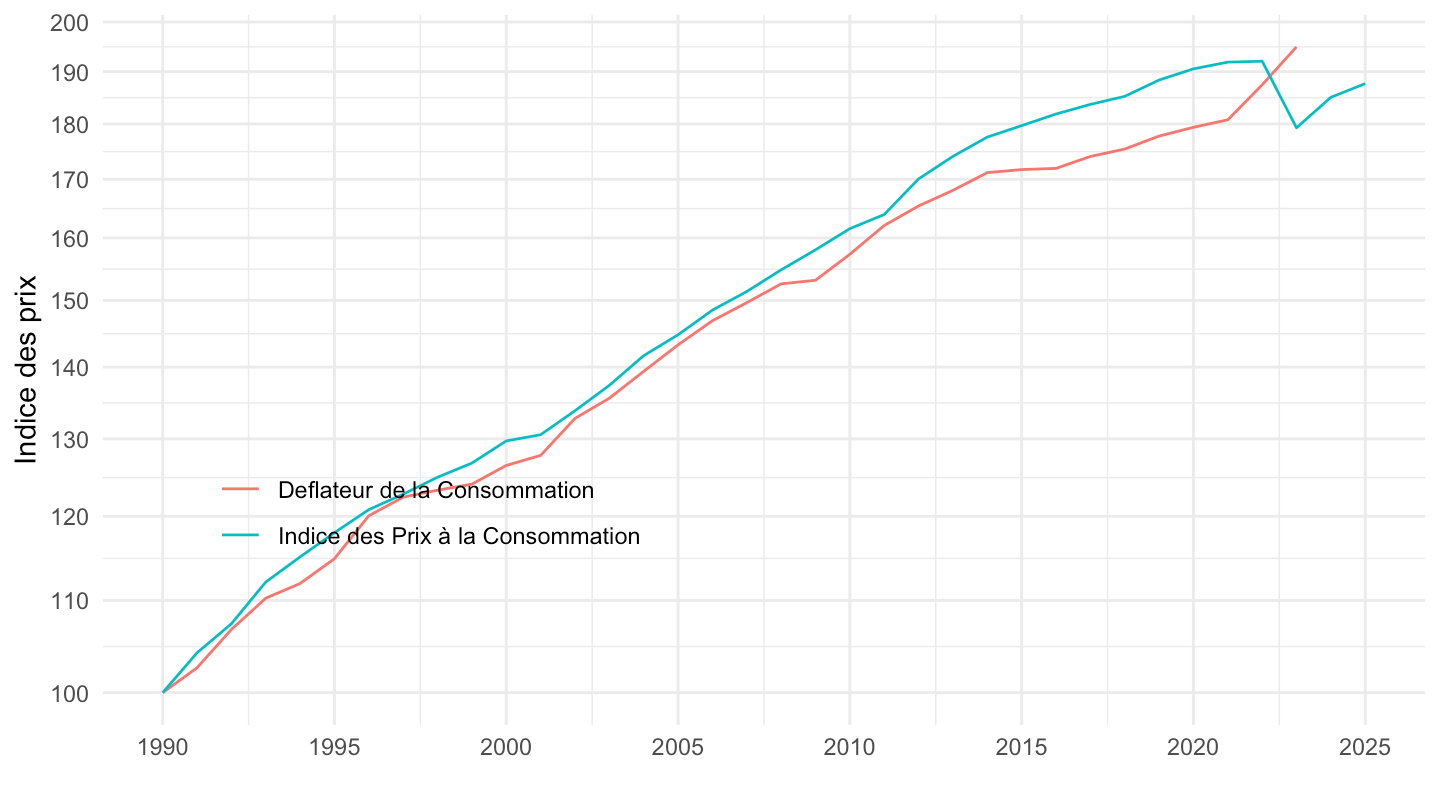
T_CONSO_EFF_FONCTION |>
  filter(fonction =="CP095",
         variable == "IPRIX2020") |>
  year_to_date2() |>
  filter(date >= as.Date("1990-01-01")) |>
  mutate(variable = "Deflateur de la Consommation") |>
  select(variable, date, value) |>
  bind_rows(`IPC-2015` |>
              filter(INDICATEUR == "IPC",
                     MENAGES_IPC == "ENSEMBLE",
                     COICOP2016 %in% c("095"),
                     FREQ == "M",
                     REF_AREA == "FE",
                     NATURE == "INDICE") |>
              month_to_date() |>
              filter(month(date) == 1) |>
              select(date, value = OBS_VALUE) |>
              mutate(variable = "Indice des Prix à la Consommation")) |>
  group_by(variable) |>
  mutate(value = 100*value/value[date == as.Date("1990-01-01")]) |>
  ggplot() + ylab("Indice des prix") + xlab("") + theme_minimal() +
  geom_line(aes(x = date, y = value, color = variable)) +

  scale_x_date(breaks = seq(1920, 2100, 5) |> paste0("-01-01") |> as.Date(),
               labels = date_format("%Y")) +
  theme(legend.position = c(0.25, 0.8),
        legend.title = element_blank()) +
  scale_y_log10(breaks = c(seq(0, 500, 10), 15),
                     labels = dollar_format(accuracy = 1, prefix = ""))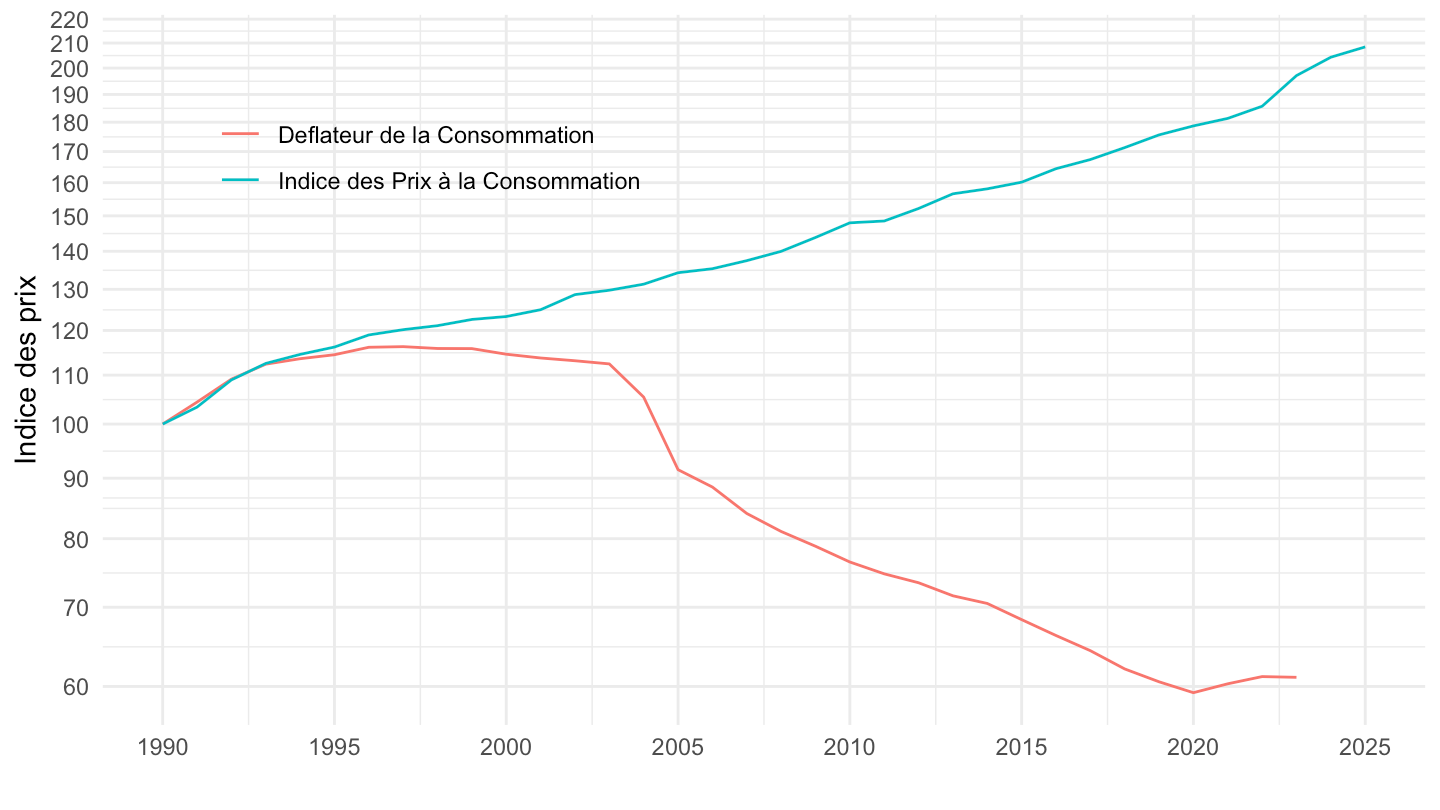
T_CONSO_EFF_FONCTION |>
  filter(fonction =="CP096",
         variable == "IPRIX2020") |>
  year_to_date2() |>
  filter(date >= as.Date("1990-01-01")) |>
  mutate(variable = "Deflateur de la Consommation") |>
  select(variable, date, value) |>
  bind_rows(`IPC-2015` |>
              filter(INDICATEUR == "IPC",
                     MENAGES_IPC == "ENSEMBLE",
                     COICOP2016 %in% c("096"),
                     FREQ == "M",
                     REF_AREA == "FE",
                     NATURE == "INDICE") |>
              month_to_date() |>
              filter(month(date) == 1) |>
              select(date, value = OBS_VALUE) |>
              mutate(variable = "Indice des Prix à la Consommation")) |>
  group_by(variable) |>
  mutate(value = 100*value/value[date == as.Date("1990-01-01")]) |>
  ggplot() + ylab("Indice des prix") + xlab("") + theme_minimal() +
  geom_line(aes(x = date, y = value, color = variable)) +

  scale_x_date(breaks = seq(1920, 2100, 5) |> paste0("-01-01") |> as.Date(),
               labels = date_format("%Y")) +
  theme(legend.position = c(0.25, 0.8),
        legend.title = element_blank()) +
  scale_y_log10(breaks = c(seq(0, 500, 10), 15),
                     labels = dollar_format(accuracy = 1, prefix = ""))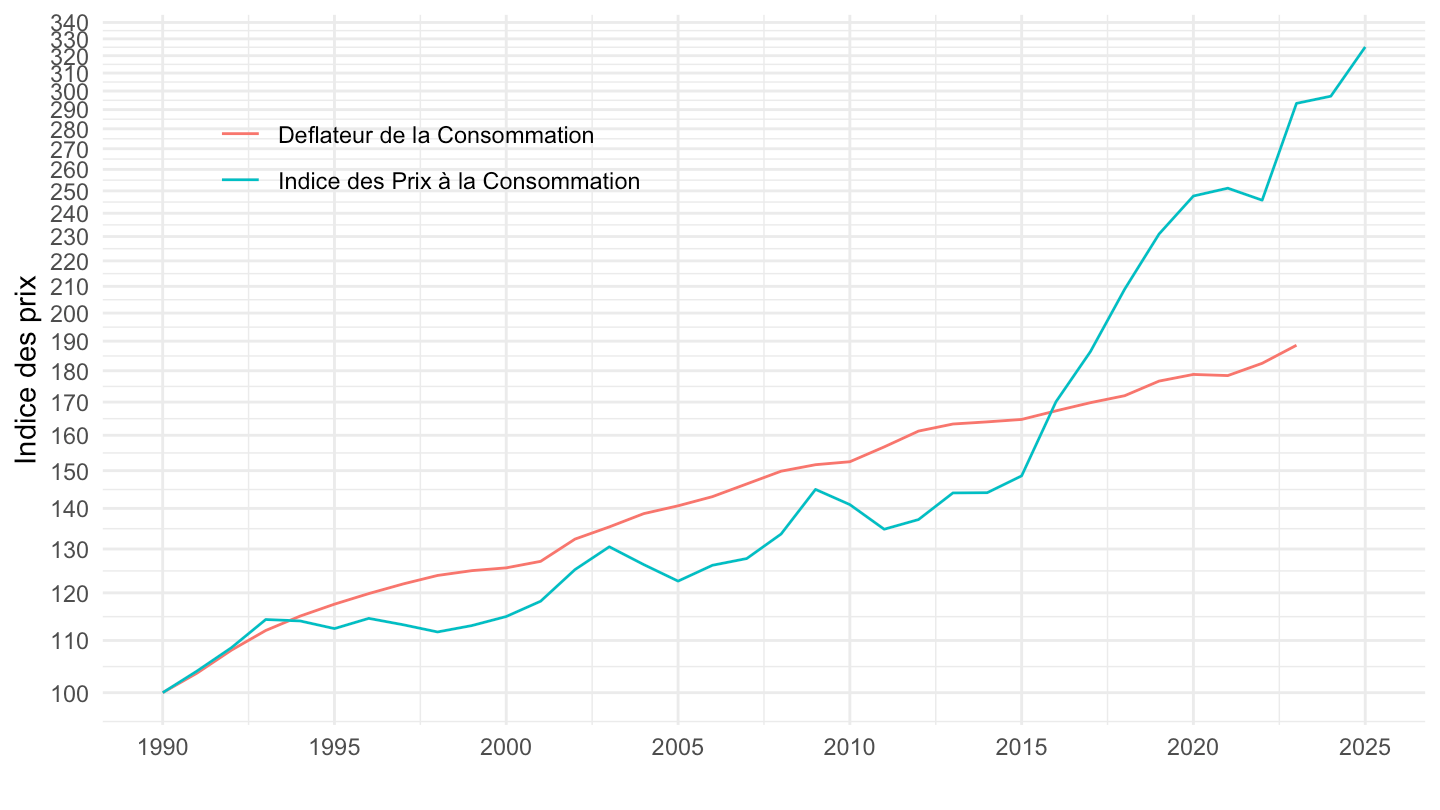
T_CONSO_EFF_FONCTION |>
  filter(fonction =="CP126",
         variable == "IPRIX2020") |>
  year_to_date2() |>
  filter(date >= as.Date("1990-01-01")) |>
  mutate(variable = "Deflateur de la Consommation") |>
  select(variable, date, value) |>
  bind_rows(`IPC-2015` |>
              filter(INDICATEUR == "IPC",
                     MENAGES_IPC == "ENSEMBLE",
                     COICOP2016 %in% c("126"),
                     FREQ == "M",
                     REF_AREA == "FE",
                     NATURE == "INDICE") |>
              month_to_date() |>
              filter(month(date) == 1) |>
              select(date, value = OBS_VALUE) |>
              mutate(variable = "Indice des Prix à la Consommation")) |>
  group_by(variable) |>
  mutate(value = 100*value/value[date == as.Date("1990-01-01")]) |>
  ggplot() + ylab("Indice des prix") + xlab("") + theme_minimal() +
  geom_line(aes(x = date, y = value, color = variable)) +

  scale_x_date(breaks = seq(1920, 2100, 5) |> paste0("-01-01") |> as.Date(),
               labels = date_format("%Y")) +
  theme(legend.position = c(0.75, 0.7),
        legend.title = element_blank()) +
  scale_y_log10(breaks = seq(0, 500, 10),
labels = dollar_format(accuracy = 1, prefix = ""))T_CONSO_EFF_FONCTION |>
filter(fonction =="CP126",
variable == "IPRIX2020") |>
year_to_date2() |>
filter(date >= as.Date("1996-01-01")) |>
mutate(variable = "Deflateur de la Consommation") |>
select(variable, date, value) |>
bind_rows(`IPC-2015` |>
filter(INDICATEUR == "IPC",
MENAGES_IPC == "ENSEMBLE",
COICOP2016 %in% c("126"),
FREQ == "M",
REF_AREA == "FE",
NATURE == "INDICE") |>
month_to_date() |>
filter(month(date) == 1) |>
select(date, value = OBS_VALUE) |>
mutate(variable = "Indice des Prix à la Consommation")) |>
group_by(variable) |>
mutate(value = 100*value/value[date == as.Date("1996-01-01")]) |>
ggplot() + ylab("Indice des prix") + xlab("") + theme_minimal() +
geom_line(aes(x = date, y = value, color = variable)) +
scale_x_date(breaks = seq(1920, 2100, 5) |> paste0("-01-01") |> as.Date(),
labels = date_format("%Y")) +
theme(legend.position = c(0.75, 0.7),
legend.title = element_blank()) +
scale_y_log10(breaks = seq(0, 500, 10),
labels = dollar_format(accuracy = 1, prefix = ""))T_CONSO_EFF_FONCTION |>
filter(fonction =="CP141",
variable == "IPRIX2020") |>
year_to_date2() |>
filter(date >= as.Date("1990-01-01")) |>
mutate(variable = "Deflateur de la Consommation") |>
select(variable, date, value) |>
group_by(variable) |>
mutate(value = 100*value/value[date == as.Date("1990-01-01")]) |>
ggplot() + ylab("Indice des prix") + xlab("") + theme_minimal() +
geom_line(aes(x = date, y = value, color = variable)) +
scale_x_date(breaks = seq(1920, 2100, 5) |> paste0("-01-01") |> as.Date(),
labels = date_format("%Y")) +
theme(legend.position = c(0.25, 0.9),
legend.title = element_blank()) +
scale_y_log10(breaks = seq(0, 500, 10),
labels = dollar_format(accuracy = 1, prefix = ""))T_CONSO_EFF_FONCTION |>
filter(fonction =="CP142",
variable == "IPRIX2020") |>
year_to_date2() |>
filter(date >= as.Date("1990-01-01")) |>
mutate(variable = "Deflateur de la Consommation") |>
select(variable, date, value) |>
group_by(variable) |>
mutate(value = 100*value/value[date == as.Date("1990-01-01")]) |>
ggplot() + ylab("Indice des prix") + xlab("") + theme_minimal() +
geom_line(aes(x = date, y = value, color = variable)) +
scale_x_date(breaks = seq(1920, 2100, 5) |> paste0("-01-01") |> as.Date(),
labels = date_format("%Y")) +
theme(legend.position = c(0.25, 0.9),
legend.title = element_blank()) +
scale_y_log10(breaks = seq(0, 500, 10),
labels = dollar_format(accuracy = 1, prefix = ""))T_CONSO_EFF_FONCTION |>
filter(fonction =="CP143",
variable == "IPRIX2020") |>
year_to_date2() |>
filter(date >= as.Date("1990-01-01")) |>
mutate(variable = "Deflateur de la Consommation") |>
select(variable, date, value) |>
group_by(variable) |>
mutate(value = 100*value/value[date == as.Date("1990-01-01")]) |>
ggplot() + ylab("Indice des prix") + xlab("") + theme_minimal() +
geom_line(aes(x = date, y = value, color = variable)) +
scale_x_date(breaks = seq(1920, 2100, 5) |> paste0("-01-01") |> as.Date(),
labels = date_format("%Y")) +
theme(legend.position = c(0.25, 0.9),
legend.title = element_blank()) +
scale_y_log10(breaks = seq(0, 500, 10),
labels = dollar_format(accuracy = 1, prefix = ""))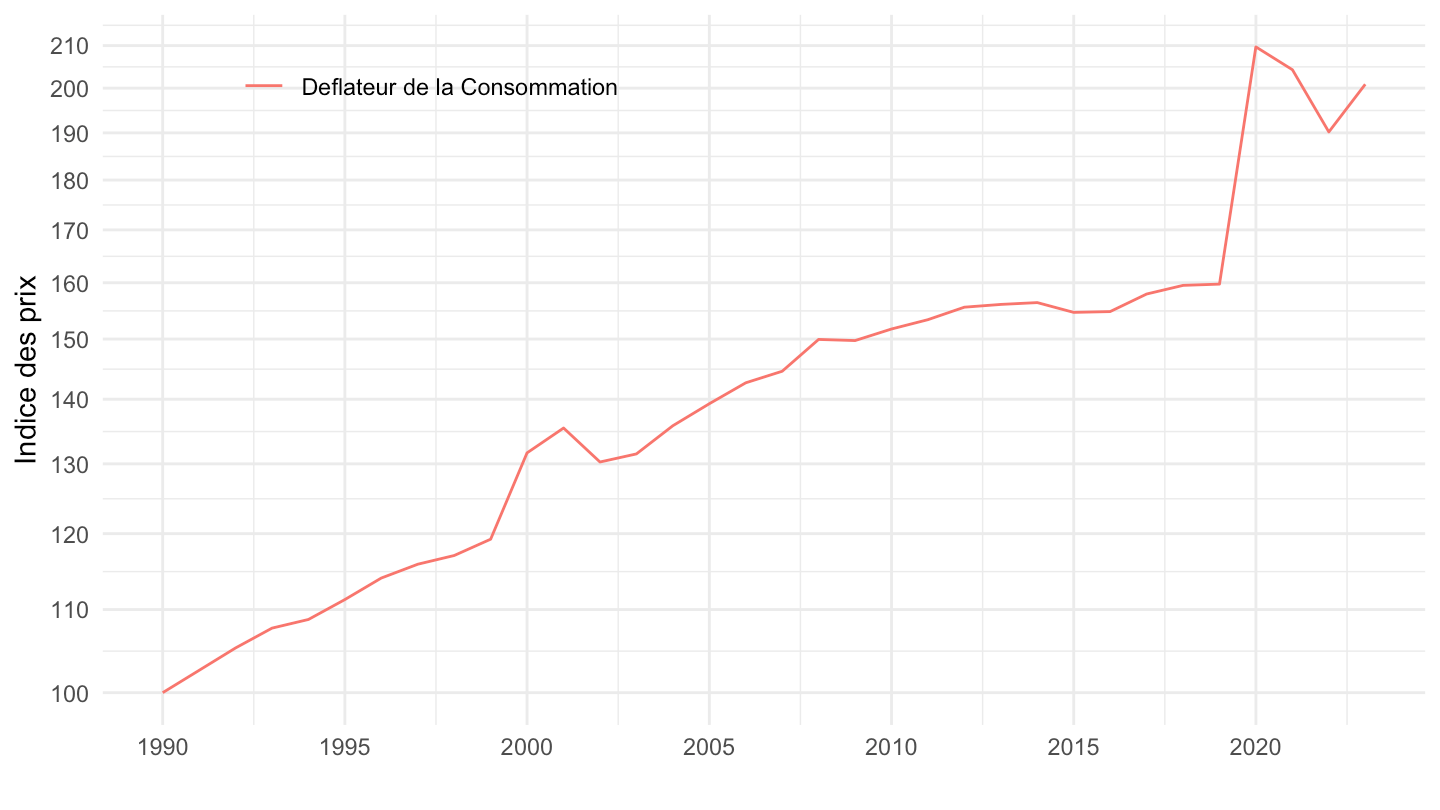
T_CONSO_EFF_FONCTION |>
  filter(fonction =="CP144",
         variable == "IPRIX2020") |>
  year_to_date2() |>
  filter(date >= as.Date("1990-01-01")) |>
  mutate(variable = "Deflateur de la Consommation") |>
  select(variable, date, value) |>
  group_by(variable) |>
  mutate(value = 100*value/value[date == as.Date("1990-01-01")]) |>
  ggplot() + ylab("Indice des prix") + xlab("") + theme_minimal() +
  geom_line(aes(x = date, y = value, color = variable)) +

  scale_x_date(breaks = seq(1920, 2100, 5) |> paste0("-01-01") |> as.Date(),
               labels = date_format("%Y")) +
  theme(legend.position = c(0.25, 0.9),
        legend.title = element_blank()) +
  scale_y_log10(breaks = seq(0, 500, 10),
                     labels = dollar_format(accuracy = 1, prefix = ""))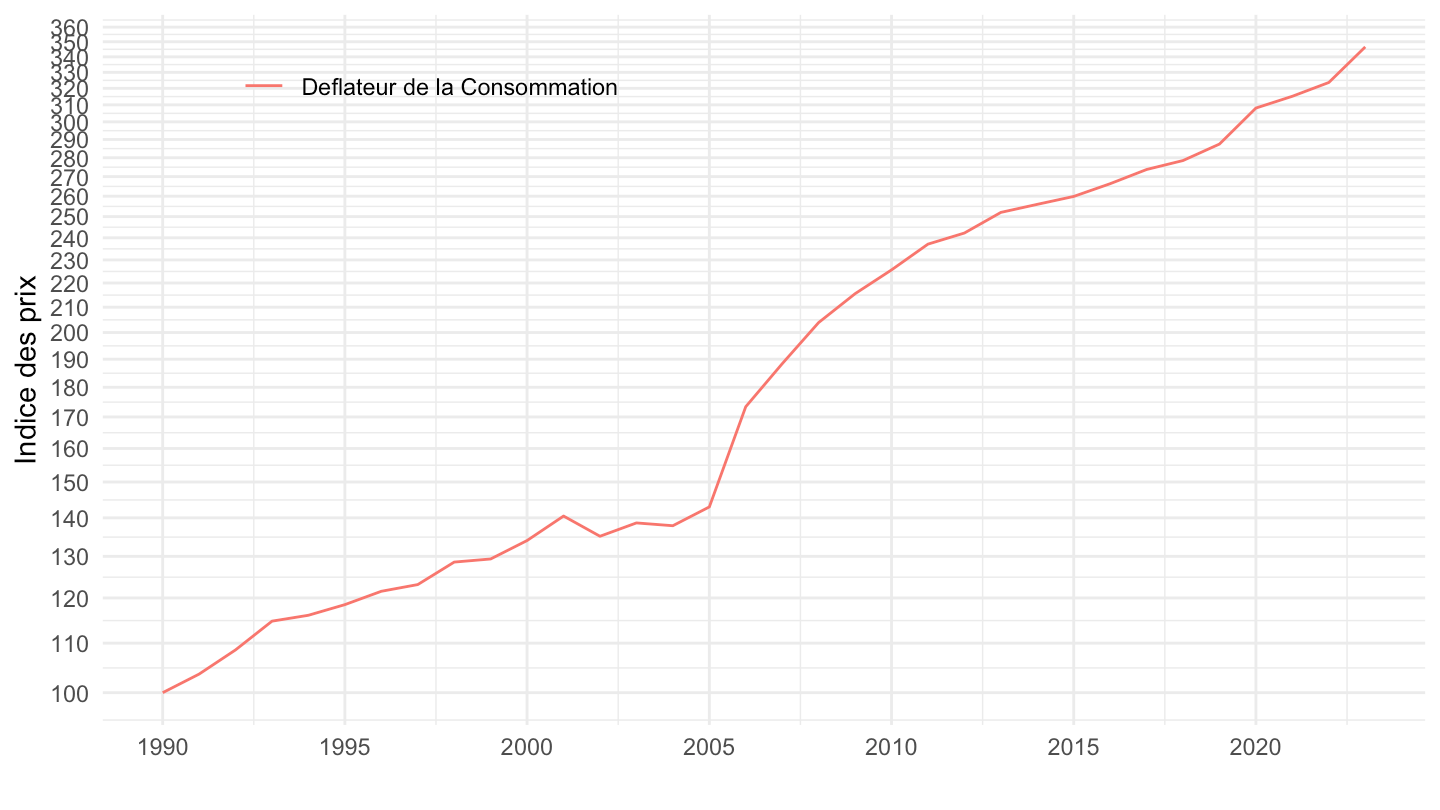
T_CONSO_EFF_FONCTION |>
  filter(fonction =="CP0562",
         variable == "IPRIX2020") |>
  year_to_date2() |>
  filter(date >= as.Date("1990-01-01")) |>
  mutate(variable = "Deflateur de la Consommation") |>
  select(variable, date, value) |>
  bind_rows(`IPC-2015` |>
              filter(INDICATEUR == "IPC",
                     MENAGES_IPC == "ENSEMBLE",
                     COICOP2016 %in% c("0562"),
                     FREQ == "M",
                     REF_AREA == "FE",
                     NATURE == "INDICE") |>
              month_to_date() |>
              filter(month(date) == 1) |>
              select(date, value = OBS_VALUE) |>
              mutate(variable = "Indice des Prix à la Consommation")) |>
  group_by(variable) |>
  mutate(value = 100*value/value[date == as.Date("1990-01-01")]) |>
  ggplot() + ylab("Indice des prix") + xlab("") + theme_minimal() +
  geom_line(aes(x = date, y = value, color = variable)) +

  scale_x_date(breaks = seq(1920, 2100, 5) |> paste0("-01-01") |> as.Date(),
               labels = date_format("%Y")) +
  theme(legend.position = c(0.25, 0.9),
        legend.title = element_blank()) +
  scale_y_log10(breaks = seq(0, 500, 10),
                     labels = dollar_format(accuracy = 1, prefix = ""))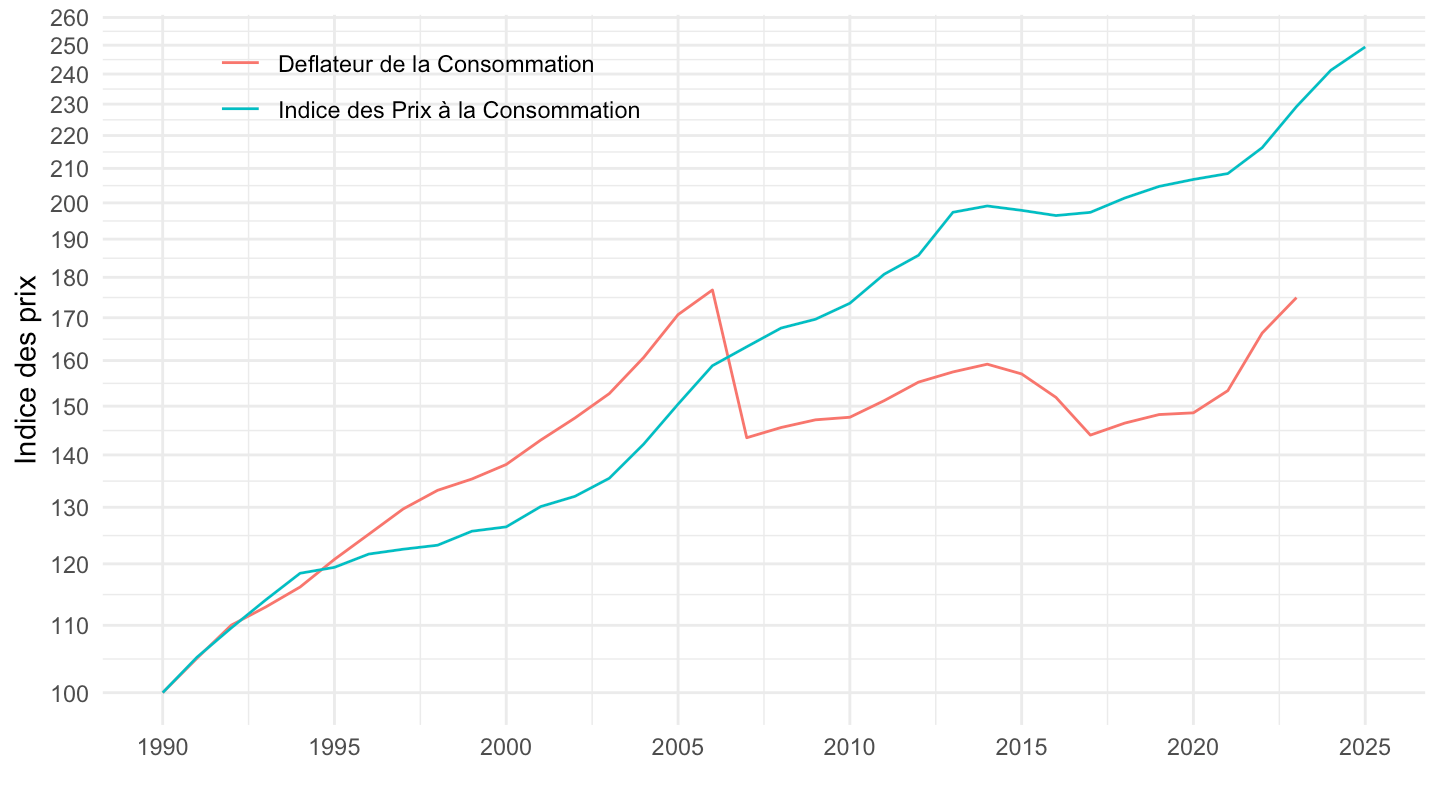
T_CONSO_EFF_FONCTION |>
  filter(fonction =="CP0912",
         variable == "IPRIX2020") |>
  year_to_date2() |>
  filter(date >= as.Date("1990-01-01")) |>
  mutate(variable = "Deflateur de la Consommation") |>
  select(variable, date, value) |>
  bind_rows(`IPC-2015` |>
              filter(INDICATEUR == "IPC",
                     MENAGES_IPC == "ENSEMBLE",
                     COICOP2016 %in% c("0912"),
                     FREQ == "M",
                     REF_AREA == "FE",
                     NATURE == "INDICE") |>
              month_to_date() |>
              filter(month(date) == 1) |>
              select(date, value = OBS_VALUE) |>
              mutate(variable = "Indice des Prix à la Consommation")) |>
  group_by(variable) |>
  mutate(value = 100*value/value[date == as.Date("1990-01-01")]) |>
  ggplot() + ylab("Indice des prix") + xlab("") + theme_minimal() +
  geom_line(aes(x = date, y = value, color = variable)) +

  scale_x_date(breaks = seq(1920, 2100, 5) |> paste0("-01-01") |> as.Date(),
               labels = date_format("%Y")) +
  theme(legend.position = c(0.75, 0.3),
        legend.title = element_blank()) +
  scale_y_log10(breaks = seq(0, 500, 10),
                     labels = dollar_format(accuracy = 1, prefix = ""))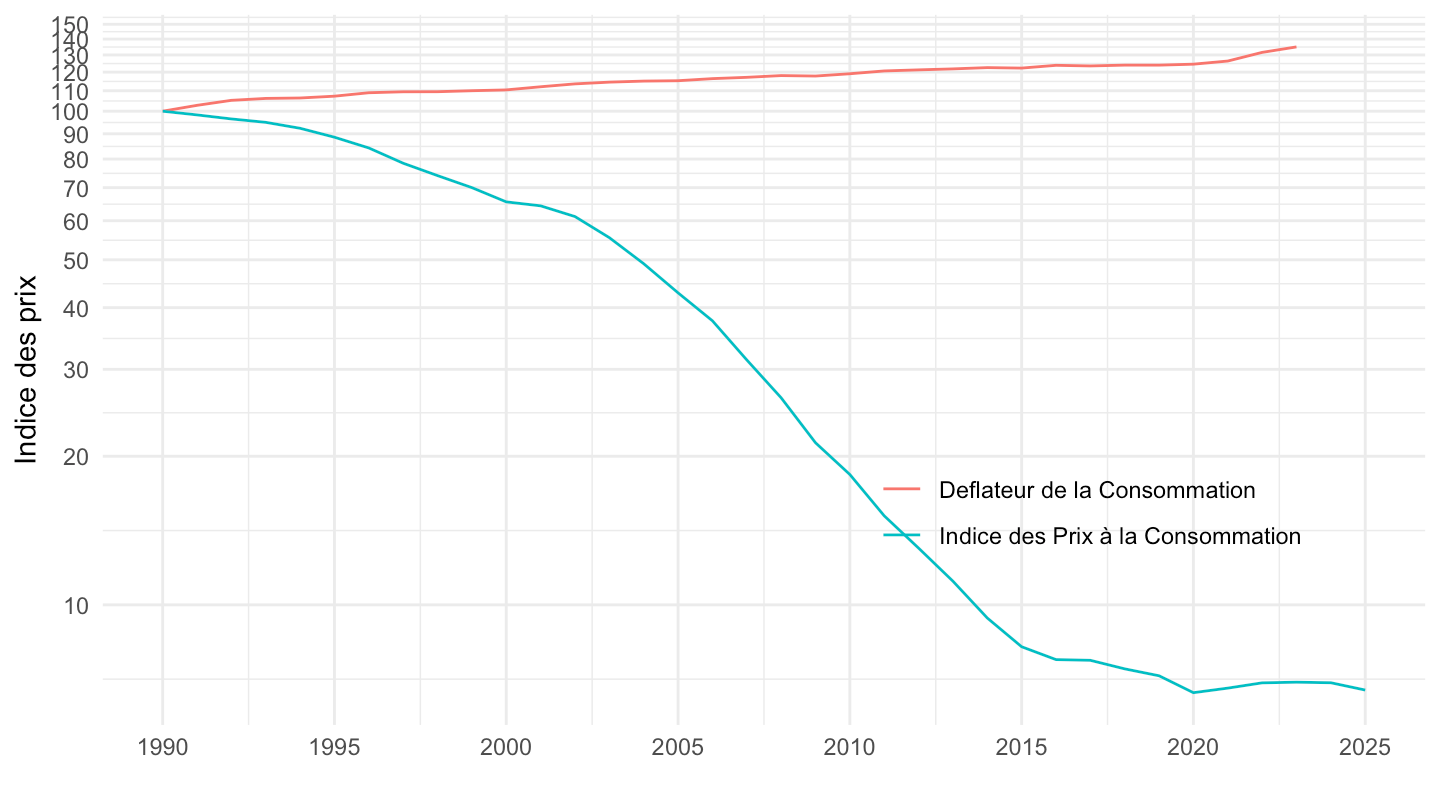
T_CONSO_EFF_FONCTION |>
  filter(fonction =="CP0914",
         variable == "IPRIX2020") |>
  year_to_date2() |>
  filter(date >= as.Date("1990-01-01")) |>
  mutate(variable = "Deflateur de la Consommation") |>
  select(variable, date, value) |>
  bind_rows(`IPC-2015` |>
              filter(INDICATEUR == "IPC",
                     MENAGES_IPC == "ENSEMBLE",
                     COICOP2016 %in% c("0914"),
                     FREQ == "M",
                     REF_AREA == "FE",
                     NATURE == "INDICE") |>
              month_to_date() |>
              filter(month(date) == 1) |>
              select(date, value = OBS_VALUE) |>
              mutate(variable = "Indice des Prix à la Consommation")) |>
  group_by(variable) |>
  mutate(value = 100*value/value[date == as.Date("1990-01-01")]) |>
  ggplot() + ylab("Indice des prix") + xlab("") + theme_minimal() +
  geom_line(aes(x = date, y = value, color = variable)) +

  scale_x_date(breaks = seq(1920, 2100, 5) |> paste0("-01-01") |> as.Date(),
               labels = date_format("%Y")) +
  theme(legend.position = c(0.75, 0.3),
        legend.title = element_blank()) +
  scale_y_log10(breaks = seq(0, 500, 10),
labels = dollar_format(accuracy = 1, prefix = ""))T_CONSO_EFF_FONCTION |>
filter(fonction =="CP0913",
variable == "IPRIX2020") |>
year_to_date2() |>
filter(date >= as.Date("1990-01-01")) |>
mutate(variable = "Deflateur de la Consommation") |>
select(variable, date, value) |>
bind_rows(`IPC-2015` |>
filter(INDICATEUR == "IPC",
MENAGES_IPC == "ENSEMBLE",
COICOP2016 %in% c("0913"),
FREQ == "M",
REF_AREA == "FE",
NATURE == "INDICE") |>
month_to_date() |>
filter(month(date) == 1) |>
select(date, value = OBS_VALUE) |>
mutate(variable = "Indice des Prix à la Consommation")) |>
group_by(variable) |>
mutate(value = 100*value/value[date == as.Date("1990-01-01")]) |>
ggplot() + ylab("Indice des prix") + xlab("") + theme_minimal() +
geom_line(aes(x = date, y = value, color = variable)) +
scale_x_date(breaks = seq(1920, 2100, 5) |> paste0("-01-01") |> as.Date(),
labels = date_format("%Y")) +
theme(legend.position = c(0.75, 0.3),
legend.title = element_blank()) +
scale_y_log10(breaks = seq(0, 500, 10),
labels = dollar_format(accuracy = 1, prefix = ""))T_CONSO_EFF_FONCTION |>
filter(fonction =="CP0915",
variable == "IPRIX2020") |>
year_to_date2() |>
filter(date >= as.Date("1990-01-01")) |>
mutate(variable = "Deflateur de la Consommation") |>
select(variable, date, value) |>
bind_rows(`IPC-2015` |>
filter(INDICATEUR == "IPC",
MENAGES_IPC == "ENSEMBLE",
COICOP2016 %in% c("0914"),
FREQ == "M",
REF_AREA == "FE",
NATURE == "INDICE") |>
month_to_date() |>
filter(month(date) == 1) |>
select(date, value = OBS_VALUE) |>
mutate(variable = "Indice des Prix à la Consommation")) |>
group_by(variable) |>
mutate(value = 100*value/value[date == as.Date("1990-01-01")]) |>
ggplot() + ylab("Indice des prix") + xlab("") + theme_minimal() +
geom_line(aes(x = date, y = value, color = variable)) +
scale_x_date(breaks = seq(1920, 2100, 5) |> paste0("-01-01") |> as.Date(),
labels = date_format("%Y")) +
theme(legend.position = c(0.75, 0.3),
legend.title = element_blank()) +
scale_y_log10(breaks = seq(0, 500, 10),
labels = dollar_format(accuracy = 1, prefix = ""))T_CONSO_EFF_FONCTION |>
filter(fonction =="CP0931",
variable == "IPRIX2020") |>
year_to_date2() |>
filter(date >= as.Date("1990-01-01")) |>
mutate(variable = "Deflateur de la Consommation") |>
select(variable, date, value) |>
bind_rows(`IPC-2015` |>
filter(INDICATEUR == "IPC",
MENAGES_IPC == "ENSEMBLE",
COICOP2016 %in% c("0931"),
FREQ == "M",
REF_AREA == "FE",
NATURE == "INDICE") |>
month_to_date() |>
filter(month(date) == 1) |>
select(date, value = OBS_VALUE) |>
mutate(variable = "Indice des Prix à la Consommation")) |>
group_by(variable) |>
mutate(value = 100*value/value[date == as.Date("1990-01-01")]) |>
ggplot() + ylab("Indice des prix") + xlab("") + theme_minimal() +
geom_line(aes(x = date, y = value, color = variable)) +
scale_x_date(breaks = seq(1920, 2100, 5) |> paste0("-01-01") |> as.Date(),
labels = date_format("%Y")) +
theme(legend.position = c(0.25, 0.9),
legend.title = element_blank()) +
scale_y_log10(breaks = seq(0, 500, 10),
labels = dollar_format(accuracy = 1, prefix = ""))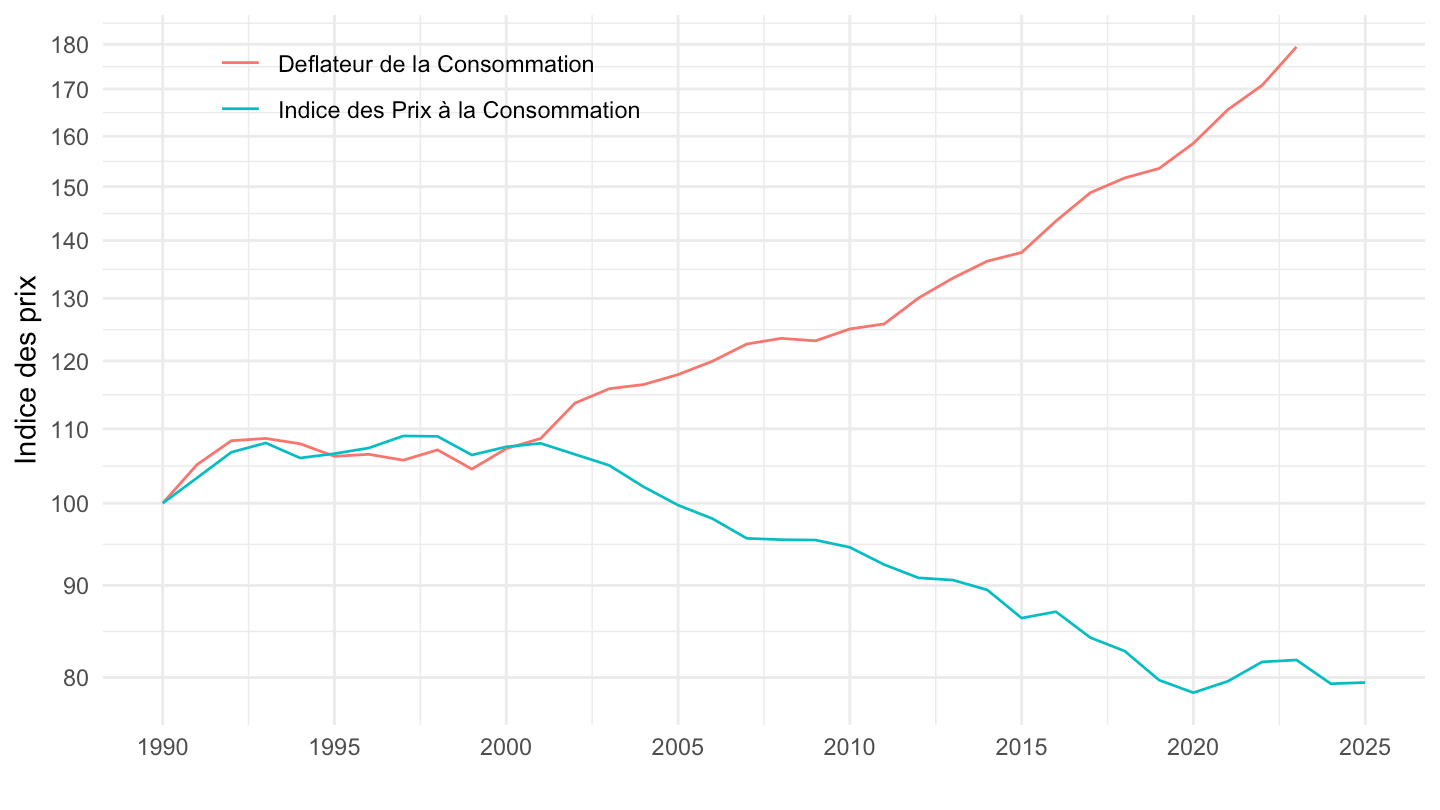
T_CONSO_EFF_FONCTION |>
  filter(fonction =="CP0954",
         variable == "IPRIX2020") |>
  year_to_date2() |>
  filter(date >= as.Date("1990-01-01")) |>
  mutate(variable = "Deflateur de la Consommation") |>
  select(variable, date, value) |>
  bind_rows(`IPC-2015` |>
              filter(INDICATEUR == "IPC",
                     MENAGES_IPC == "ENSEMBLE",
                     COICOP2016 %in% c("0954"),
                     FREQ == "M",
                     REF_AREA == "FE",
                     NATURE == "INDICE") |>
              month_to_date() |>
              filter(month(date) == 1) |>
              select(date, value = OBS_VALUE) |>
              mutate(variable = "Indice des Prix à la Consommation")) |>
  group_by(variable) |>
  mutate(value = 100*value/value[date == as.Date("1990-01-01")]) |>
  ggplot() + ylab("Indice des prix") + xlab("") + theme_minimal() +
  geom_line(aes(x = date, y = value, color = variable)) +

  scale_x_date(breaks = seq(1920, 2100, 5) |> paste0("-01-01") |> as.Date(),
               labels = date_format("%Y")) +
  theme(legend.position = c(0.25, 0.9),
        legend.title = element_blank()) +
  scale_y_log10(breaks = seq(0, 500, 10),
labels = dollar_format(accuracy = 1, prefix = ""))T_CONSO_EFF_FONCTION |>
filter(fonction =="CP1261",
variable == "IPRIX2020") |>
year_to_date2() |>
filter(date >= as.Date("1990-01-01")) |>
mutate(variable = "Deflateur de la Consommation") |>
select(variable, date, value) |>
group_by(variable) |>
mutate(value = 100*value/value[date == as.Date("1990-01-01")]) |>
ggplot() + ylab("Indice des prix") + xlab("") + theme_minimal() +
geom_line(aes(x = date, y = value, color = variable)) +
scale_x_date(breaks = seq(1920, 2100, 5) |> paste0("-01-01") |> as.Date(),
labels = date_format("%Y")) +
theme(legend.position = c(0.75, 0.7),
legend.title = element_blank()) +
scale_y_log10(breaks = seq(0, 500, 10),
labels = dollar_format(accuracy = 1, prefix = ""))