TCRED - Emploi au 31 décembre (1989-2020) - TCRED-EMPLOI-31-DECEMBRE
Données - INSEE
Info
Last observation: 2020
First observation: 1989
Number of observations: 65 140
Last data update: 24 jul 2026, 05:20. Last compile: 24 jul 2026, 06:49
Structure
LAST_DOWNLOAD
| LAST_DOWNLOAD |
|---|
| 2026-07-23 |
LAST_COMPILE
| LAST_COMPILE |
|---|
| 2026-07-24 |
Champ
1989-2019. T201.html
A38
Départements
Sectoriel par département (2011)
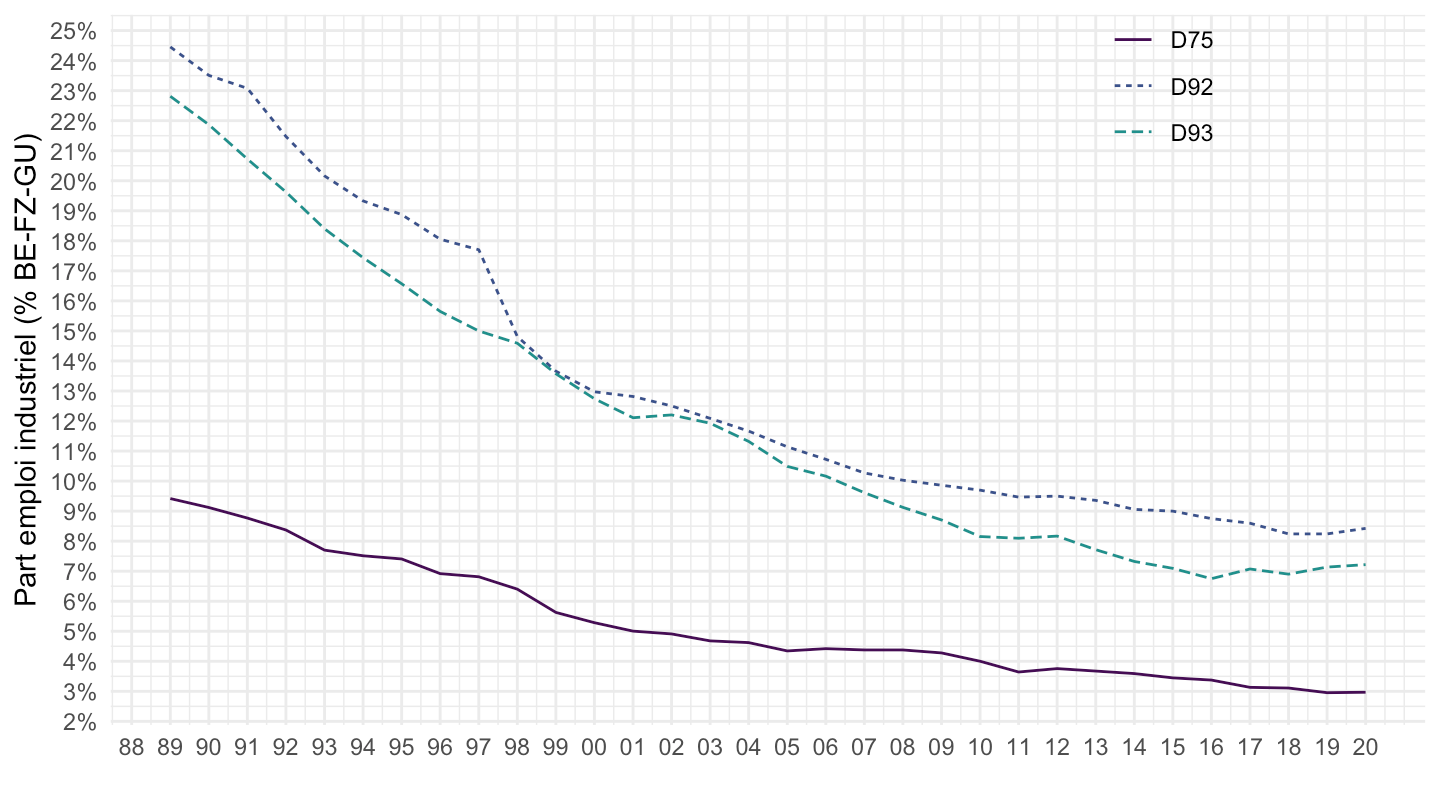
Paris, Seine-Saint-Denis, Hauts-de-Seine
Code
`TCRED-EMPLOI-31-DECEMBRE` %>%
  filter(NAF2_RGP %in% c("BE", "TOT"),
         REF_AREA %in% c("D92", "D93", "D75"),
         CAT_POP_ACT == "TOT") %>%
  year_to_date %>%
  select(date, REF_AREA, NAF2_RGP, OBS_VALUE) %>%
  spread(NAF2_RGP, OBS_VALUE) %>%
  ggplot + geom_line(aes(x = date, y = BE/TOT, color = REF_AREA, linetype = REF_AREA)) +
  xlab("") + ylab("Part emploi industriel (% BE-FZ-GU)") +  theme_minimal() +
  scale_x_date(breaks = seq(1960, 2020, 1) %>% paste0("-01-01") %>% as.Date,
               labels = date_format("%y")) +
  scale_y_continuous(breaks = 0.01*seq(0, 120, 1),
                labels = percent_format(accuracy = 1)) +
  scale_color_manual(values = viridis(5)[1:4]) +
  theme(legend.position = c(0.8, 0.9),
        legend.title = element_blank())