Last data update: 02 août 2026, 11:06
Last compile: 16 oct. 2026, 02:32
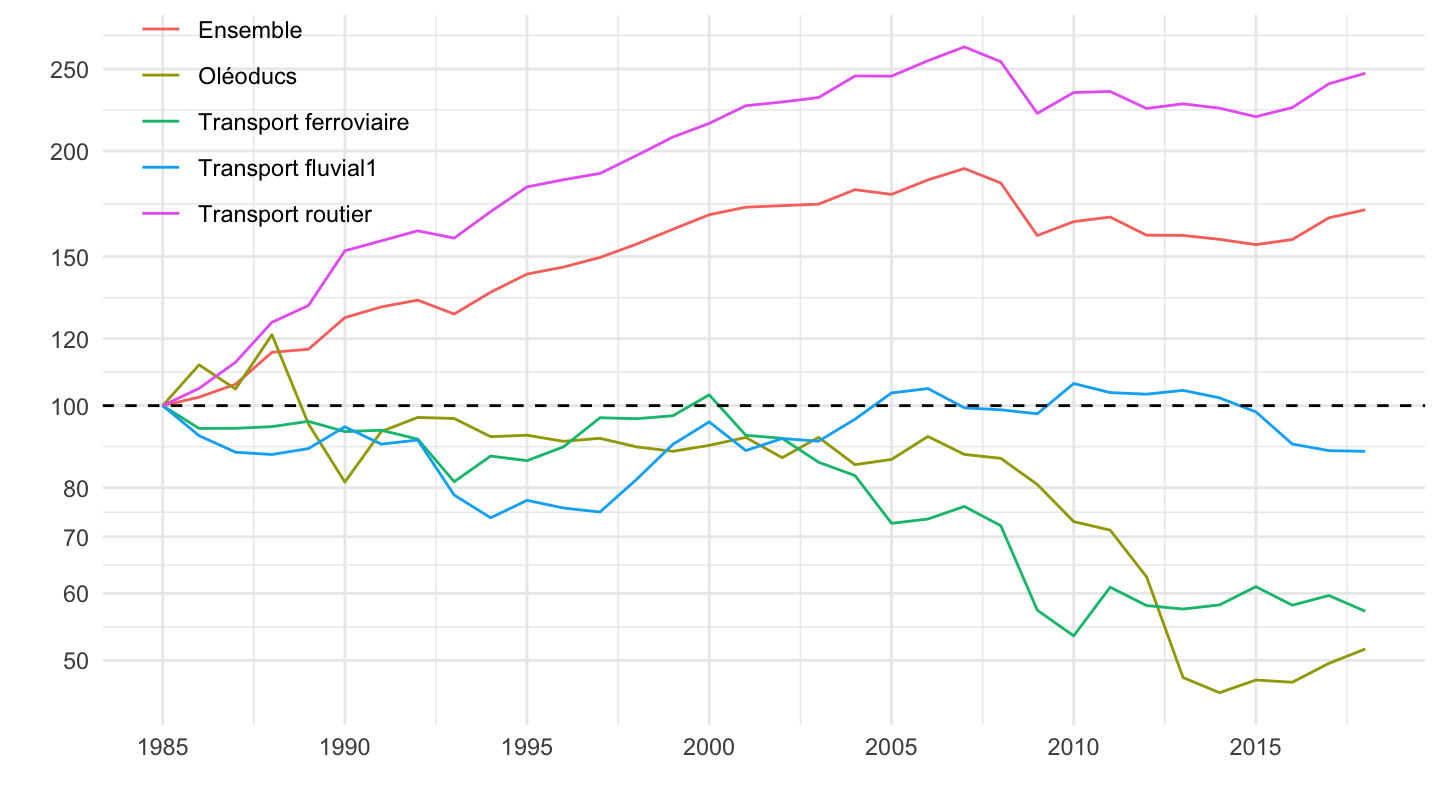
T20F208_fig3 |>
  gather(variable, value, -date) |>
  ggplot() + geom_line(aes(x = date, y = value, color = variable)) +
  theme_minimal() + xlab("") + ylab("") +
  scale_x_date(breaks = seq(1940, 2100, 5) |> paste0("-01-01") |> as.Date(),
               labels = date_format("%Y")) +
  scale_y_log10(breaks = c(10, 20, 30, 50, 60, 70, 80, 100, 120, 150, 200, 250, 300)) +
  theme(legend.position = c(0.13, 0.85),
        legend.title = element_blank()) +
  geom_hline(yintercept = 100, linetype = "dashed")