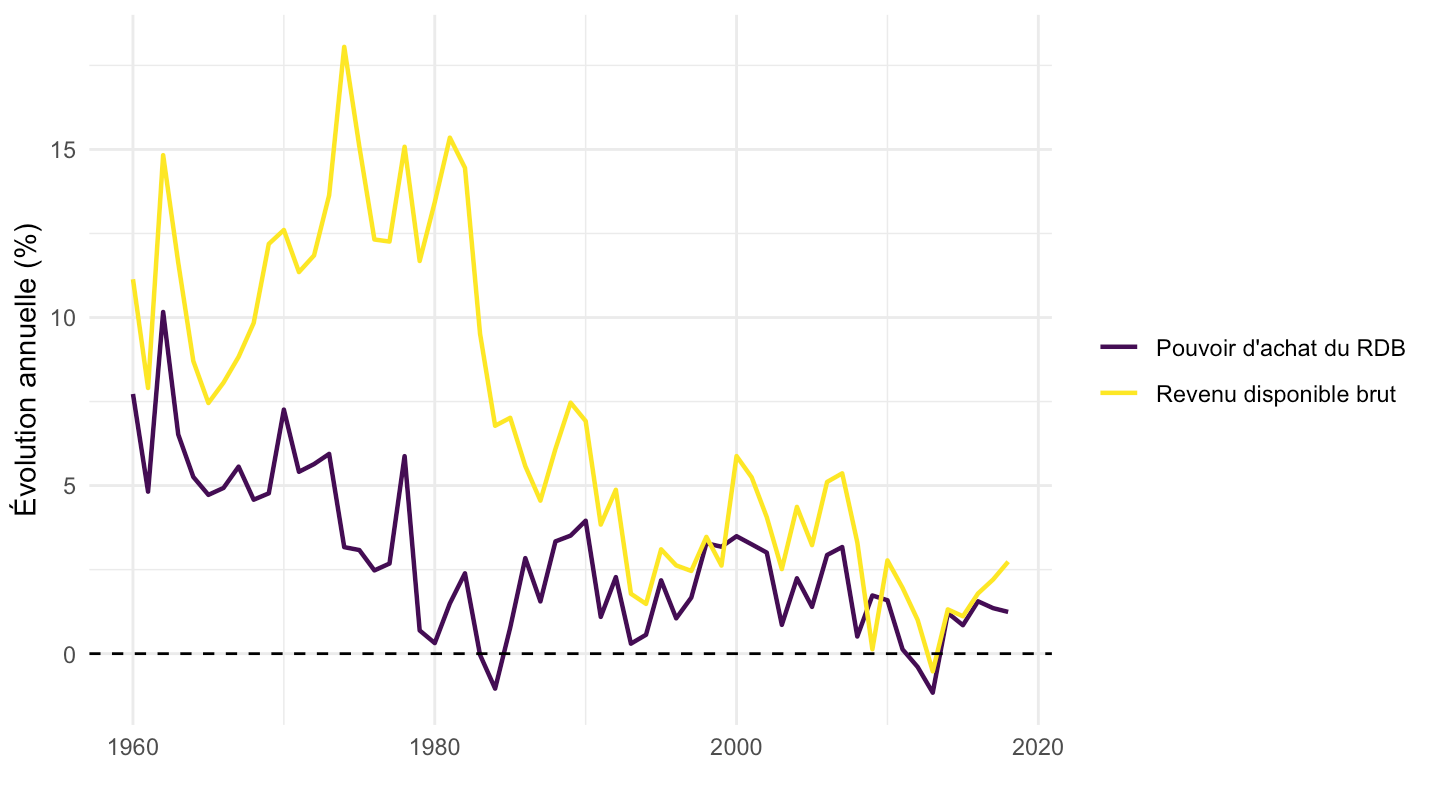
Last observation: 2018 (N = 2)
First observation: 1960 (N = 2)
Last data update: 28 sept. 2026, 23:21
Last compile: 19 oct. 2026, 02:45
T20F054_fig3 |>
  mutate(variable = recode(variable, `Pouvoir d'achat du RDB1` = "Pouvoir d'achat du RDB")) |>
  ggplot() + geom_line(aes(x = annee, y = value, color = variable), linewidth = 0.8) +
  theme_minimal() + xlab("") + ylab("Évolution annuelle (%)") +
  theme(legend.title = element_blank()) +
  geom_hline(yintercept = 0, linetype = "dashed") +
  scale_color_viridis_d()