Last observation: 2020 (N = 18)
First observation: 1975 (N = 18)
Last data update: 28 sept. 2026, 23:14
Last compile: 16 oct. 2026, 02:32
T207B |>
  filter(sexe == "Ensemble", age %in% c('15 - 24 ans','25 - 49 ans','50 - 64 ans')) |>
  ggplot() + geom_line(aes(x = annee, y = value, color = age), linewidth = 0.8) +
  theme_minimal() + xlab("") + ylab("Taux d'emploi (%)") +
  theme(legend.title = element_blank(), legend.position = "bottom") +
  guides(color = guide_legend(nrow = 3)) +
  scale_color_viridis_d()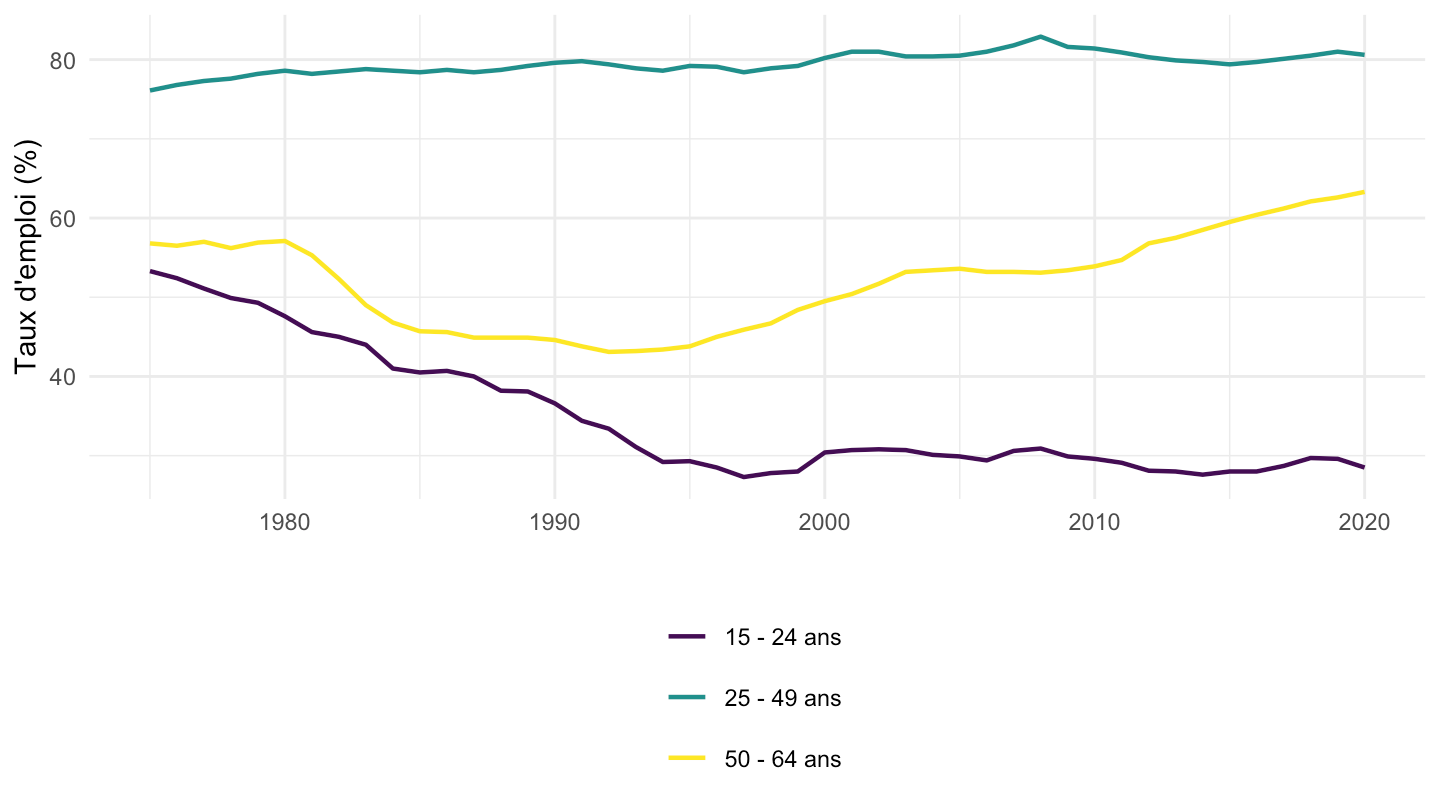
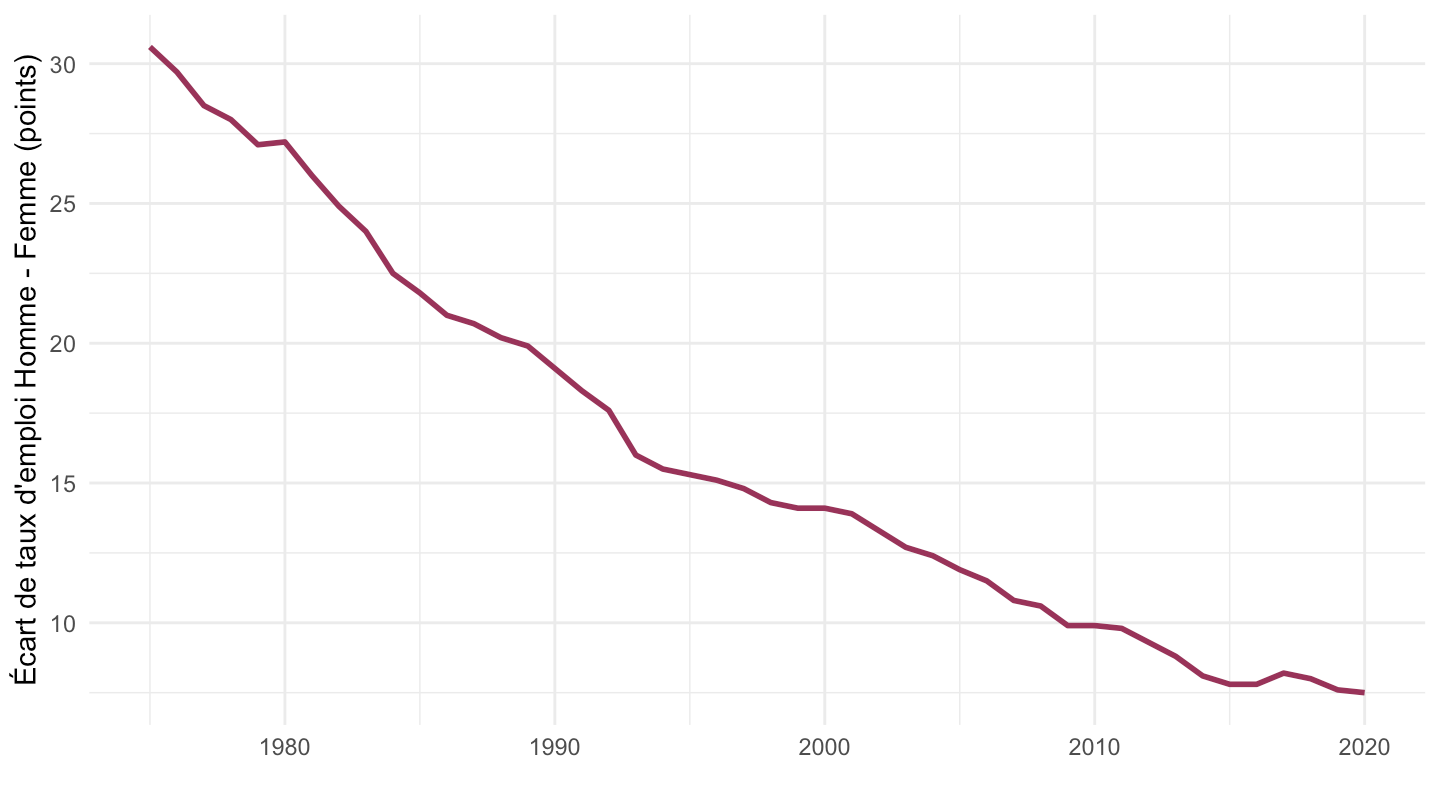
T207B |>
  filter(age == "Ensemble", sexe %in% c("Homme", "Femme")) |>
  spread(sexe, value) |>
  ggplot() + geom_line(aes(x = annee, y = Homme - Femme), color = rgb(0.6, 0.2, 0.35), linewidth = 1) +
  theme_minimal() + xlab("") + ylab("Écart de taux d'emploi Homme - Femme (points)")