Code
A38 %>%
{if (is_html_output()) datatable(., filter = 'top', rownames = F) else .}Données - INSEE
A38 %>%
{if (is_html_output()) datatable(., filter = 'top', rownames = F) else .}A88 %>%
{if (is_html_output()) datatable(., filter = 'top', rownames = F) else .}T102B %>%
group_by(a88, A88) %>%
summarise(Nobs = n(),
value2018 = value[date == as.Date("2019-01-01")]) %>%
arrange(-value2018) %>%
{if (is_html_output()) datatable(., filter = 'top', rownames = F) else .}T102B %>%
mutate(a88 = as.numeric(a88)) %>%
filter(a88 < 5) %>%
group_by(a88, A88) %>%
summarise(Nobs = n(),
value2018 = value[date == as.Date("2019-01-01")]) %>%
arrange(-value2018) %>%
{if (is_html_output()) print_table(.) else .}| a88 | A88 | Nobs | value2018 |
|---|---|---|---|
| 1 | Culture et production animale, chasse et services annexes | 31 | 231 |
| 2 | Sylviculture et exploitation forestière | 31 | 21 |
| 3 | Pêche et aquaculture | 31 | 18 |
T102B %>%
  filter(a88 %in% c("01", "02", "03")) %>%
  ggplot() + theme_minimal() + ylab("Emploi salarié (en milliers)") + xlab("") +
  geom_line(aes(x = date, y = value, color = A88, linetype = A88)) +
  scale_color_manual(values = viridis(4)[1:3]) +
  scale_x_date(breaks = seq(1920, 2025, 2) %>% paste0("-01-01") %>% as.Date,
               labels = date_format("%y")) +
  theme(legend.position = c(0.6, 0.6),
        legend.title = element_blank()) +
  scale_y_log10(breaks = seq(10, 3000, 10),
                labels = dollar_format(accuracy = 1, prefix = "", suffix = " K"))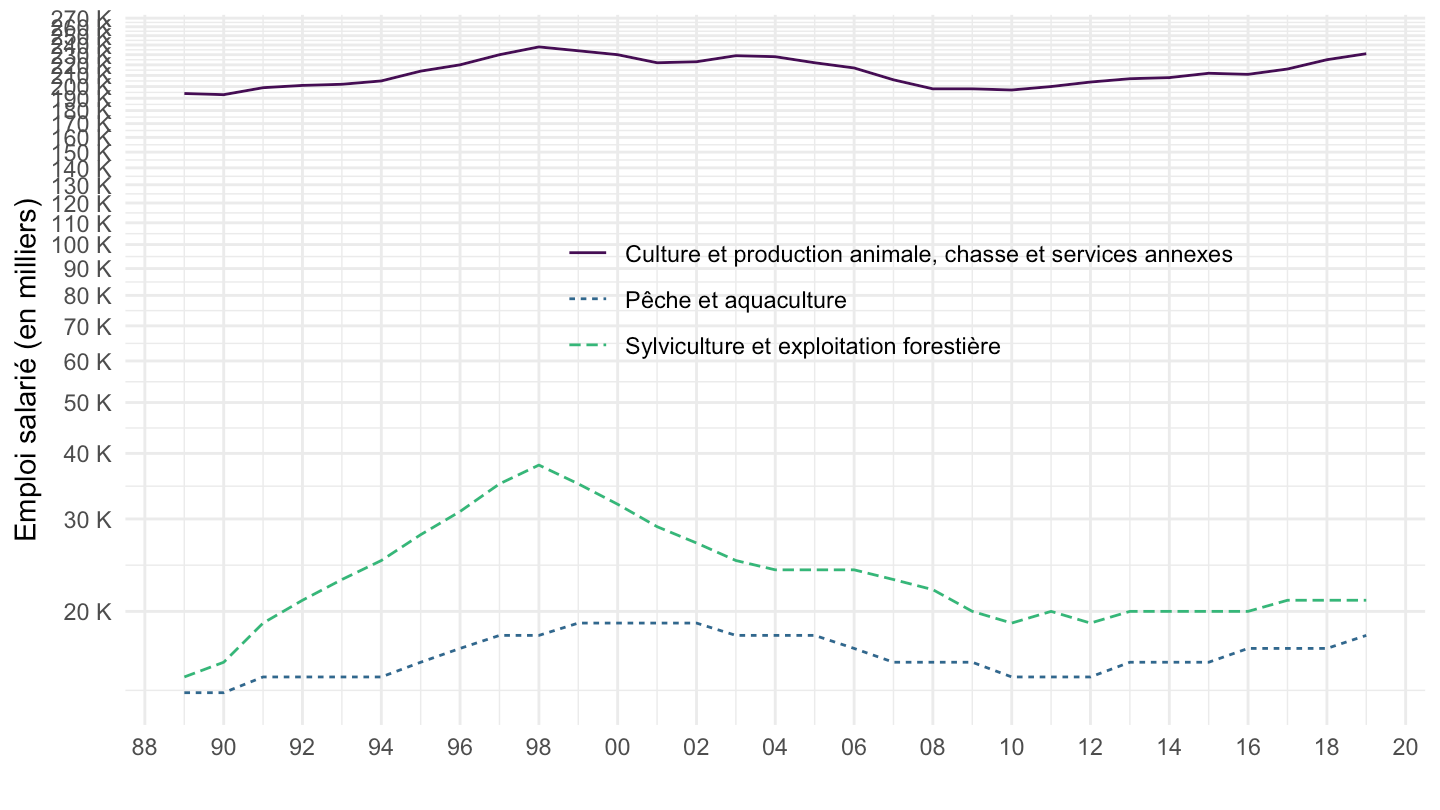
T102B %>%
  mutate(a88 = as.numeric(a88)) %>%
  filter(a88 >= 5, a88 <= 39) %>%
  group_by(a88, A88) %>%
  summarise(Nobs = n(),
            value2018 = value[date == as.Date("2019-01-01")]) %>%
  arrange(-value2018) %>%
{if (is_html_output()) datatable(., filter = 'top', rownames = F) else .}T102B %>%
filter(a88 %in% c("10", "25", "29")) %>%
ggplot() + theme_minimal() + ylab("Emploi salarié (en milliers)") + xlab("") +
geom_line(aes(x = date, y = value, color = A88, linetype = A88)) +
scale_color_manual(values = viridis(4)[1:3]) +
scale_x_date(breaks = seq(1920, 2025, 2) %>% paste0("-01-01") %>% as.Date,
labels = date_format("%y")) +
theme(legend.position = c(0.5, 0.2),
legend.title = element_blank()) +
scale_y_log10(breaks = seq(100, 3000, 100),
labels = dollar_format(accuracy = 1, prefix = "", suffix = " K"),
limits = c(100, 600))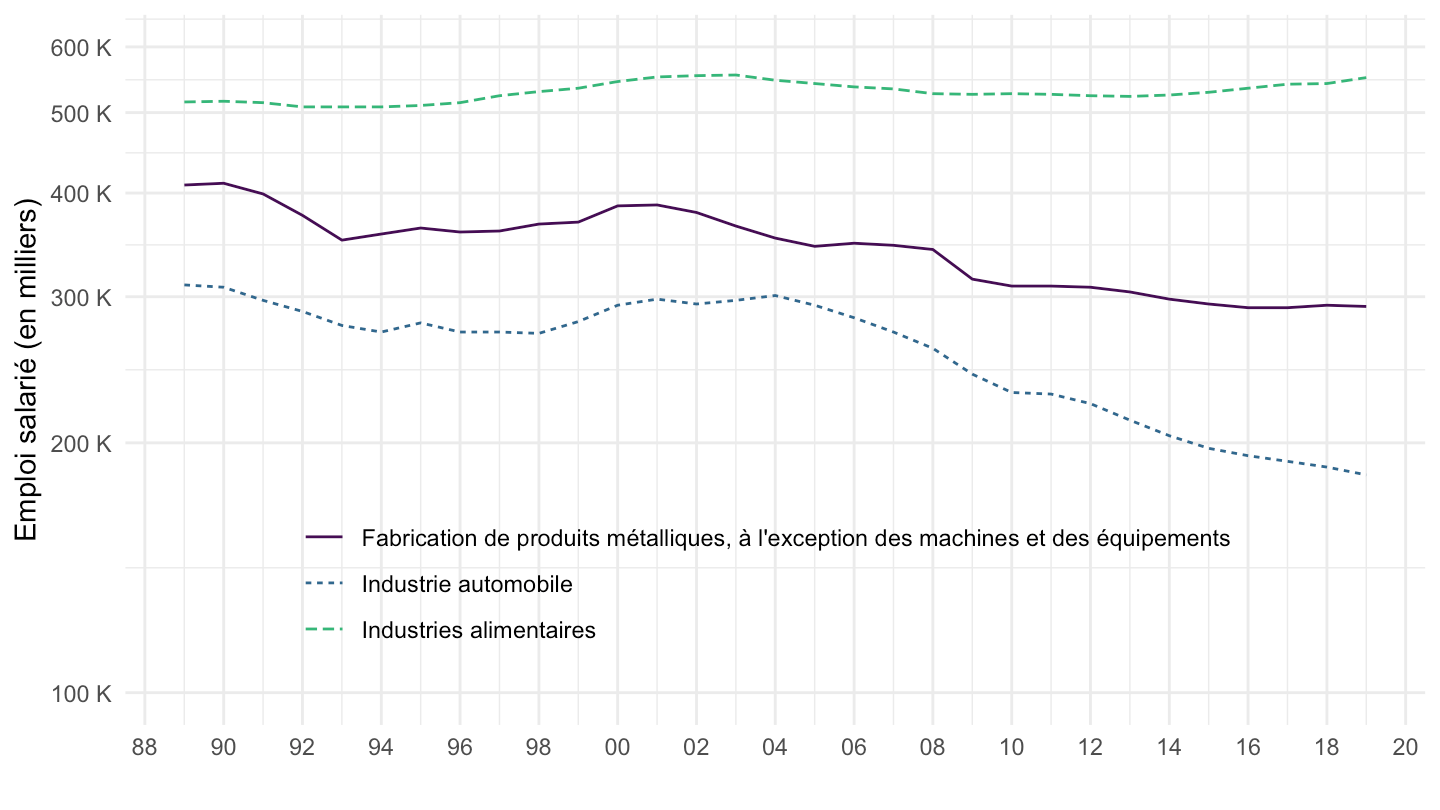
T102B %>%
  filter(a88 %in% c("28", "35", "33")) %>%
  ggplot() + theme_minimal() + ylab("Emploi salarié (en milliers)") + xlab("") +
  geom_line(aes(x = date, y = value, color = A88, linetype = A88)) +
  scale_color_manual(values = viridis(4)[1:3]) +
  scale_x_date(breaks = seq(1920, 2025, 2) %>% paste0("-01-01") %>% as.Date,
               labels = date_format("%y")) +
  theme(legend.position = c(0.5, 0.9),
        legend.title = element_blank()) +
  scale_y_log10(breaks = seq(100, 3000, 10),
                labels = dollar_format(accuracy = 1, prefix = "", suffix = " K"),
                limits = c(150, 350))
T102B %>%
  filter(a88 %in% c("22", "30", "20")) %>%
  ggplot() + theme_minimal() + ylab("Emploi salarié (en milliers)") + xlab("") +
  geom_line(aes(x = date, y = value, color = A88, linetype = A88)) +
  scale_color_manual(values = viridis(4)[1:3]) +
  scale_x_date(breaks = seq(1920, 2025, 2) %>% paste0("-01-01") %>% as.Date,
               labels = date_format("%y")) +
  theme(legend.position = c(0.5, 0.9),
        legend.title = element_blank()) +
  scale_y_log10(breaks = seq(100, 3000, 10),
                labels = dollar_format(accuracy = 1, prefix = "", suffix = " K"),
                limits = c(130, 300))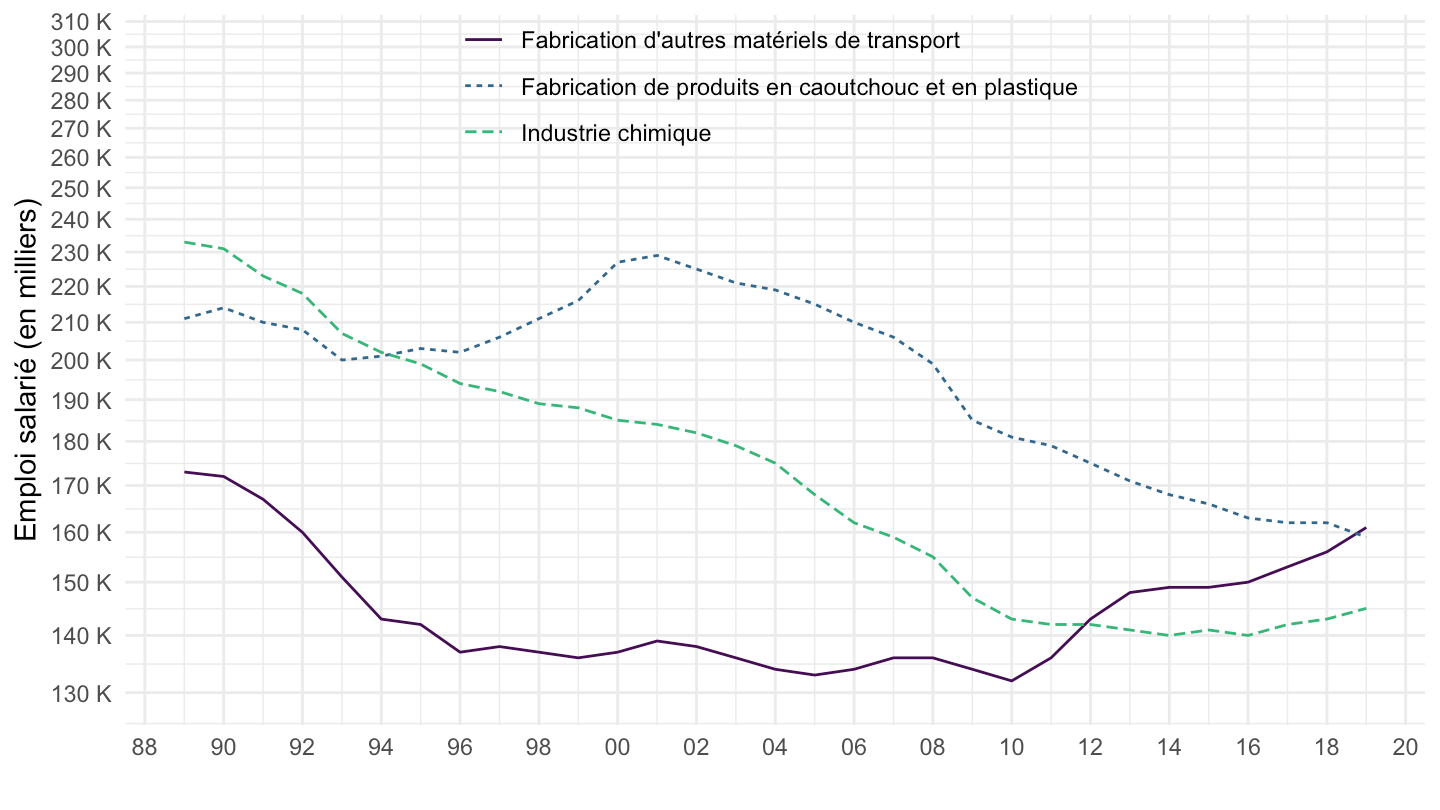
T102B %>%
  filter(a88 %in% c("26", "38", "27")) %>%
  ggplot() + theme_minimal() + ylab("Emploi salarié (en milliers)") + xlab("") +
  geom_line(aes(x = date, y = value, color = A88, linetype = A88)) +
  scale_color_manual(values = viridis(4)[1:3]) +
  scale_x_date(breaks = seq(1920, 2025, 2) %>% paste0("-01-01") %>% as.Date,
               labels = date_format("%y")) +
  theme(legend.position = c(0.5, 0.2),
        legend.title = element_blank()) +
  scale_y_log10(breaks = seq(20, 250, 20),
                labels = dollar_format(accuracy = 1, prefix = "", suffix = " K"),
                limits = c(20, 250))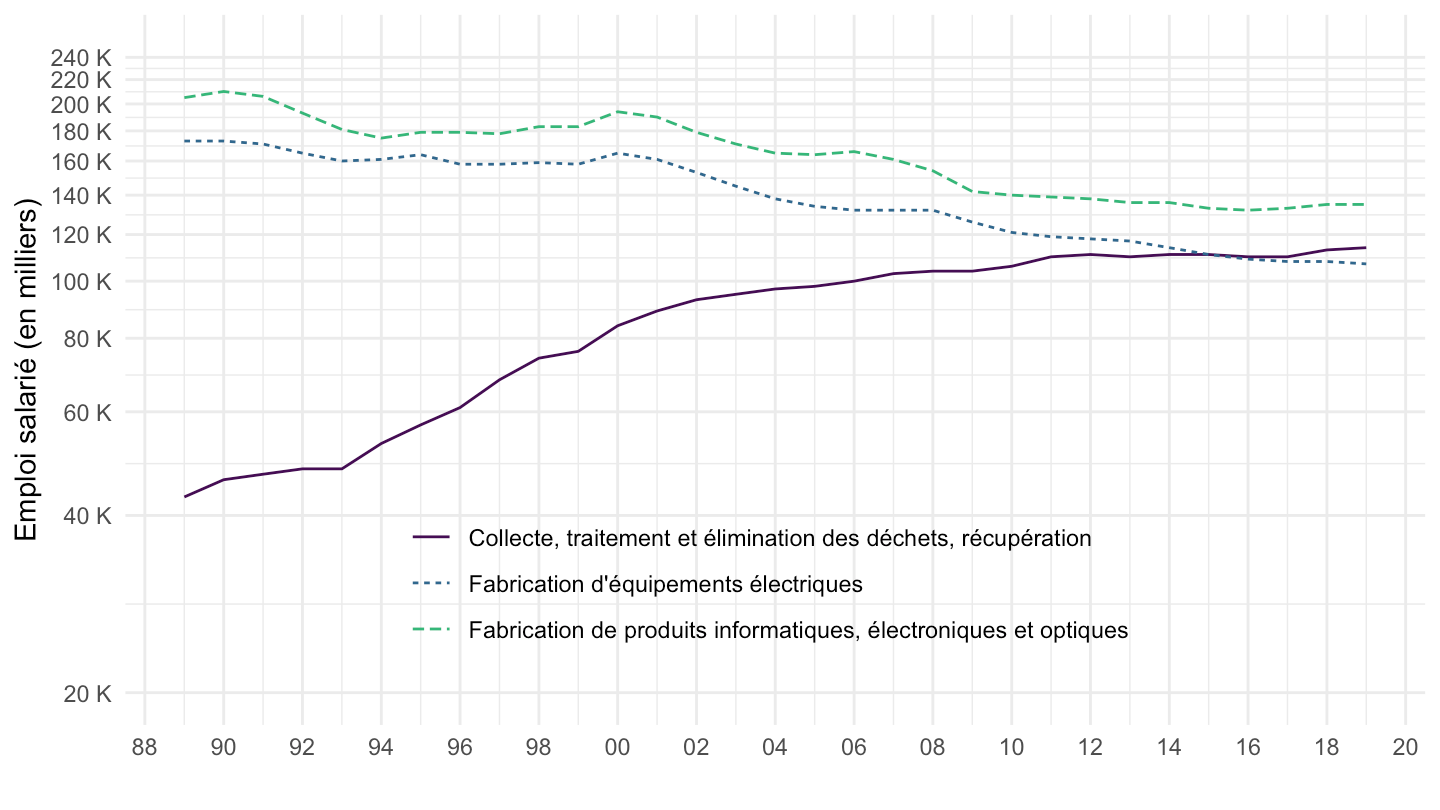
T102B %>%
  filter(a88 %in% c("23", "24", "21")) %>%
  ggplot() + theme_minimal() + ylab("Emploi salarié (en milliers)") + xlab("") +
  geom_line(aes(x = date, y = value, color = A88, linetype = A88)) +
  scale_color_manual(values = viridis(4)[1:3]) +
  scale_x_date(breaks = seq(1920, 2025, 2) %>% paste0("-01-01") %>% as.Date,
               labels = date_format("%y")) +
  theme(legend.position = c(0.5, 0.2),
        legend.title = element_blank()) +
  scale_y_log10(breaks = seq(20, 250, 20),
                labels = dollar_format(accuracy = 1, prefix = "", suffix = " K"),
                limits = c(40, 200))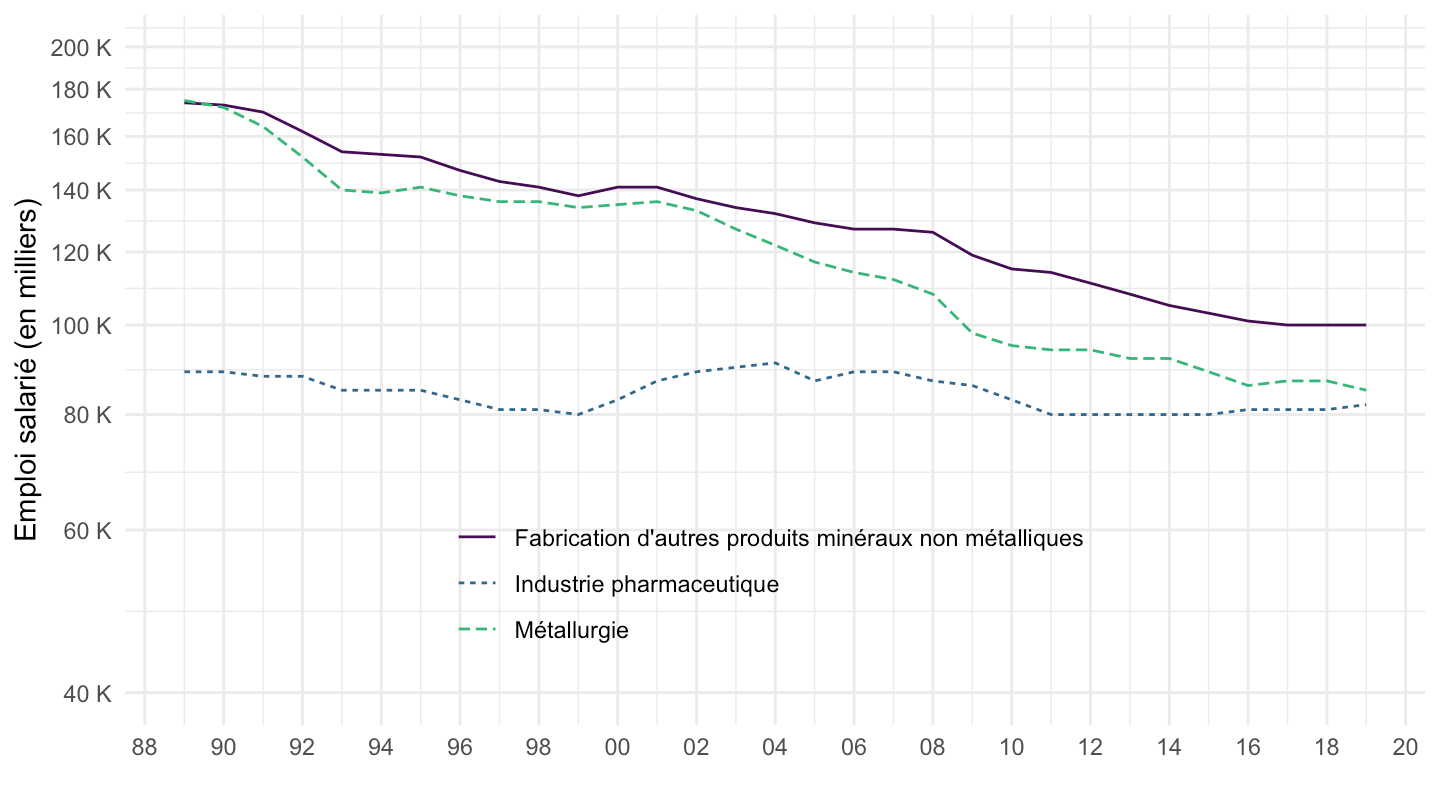
T102B %>%
  filter(a88 %in% c("32", "16", "17")) %>%
  ggplot() + theme_minimal() + ylab("Emploi salarié (en milliers)") + xlab("") +
  geom_line(aes(x = date, y = value, color = A88, linetype = A88)) +
  scale_color_manual(values = viridis(4)[1:3]) +
  scale_x_date(breaks = seq(1920, 2025, 2) %>% paste0("-01-01") %>% as.Date,
               labels = date_format("%y")) +
  theme(legend.position = c(0.74, 0.2),
        legend.title = element_blank()) +
  scale_y_log10(breaks = seq(20, 250, 10),
                labels = dollar_format(accuracy = 1, prefix = "", suffix = " K"),
                limits = c(50, 120))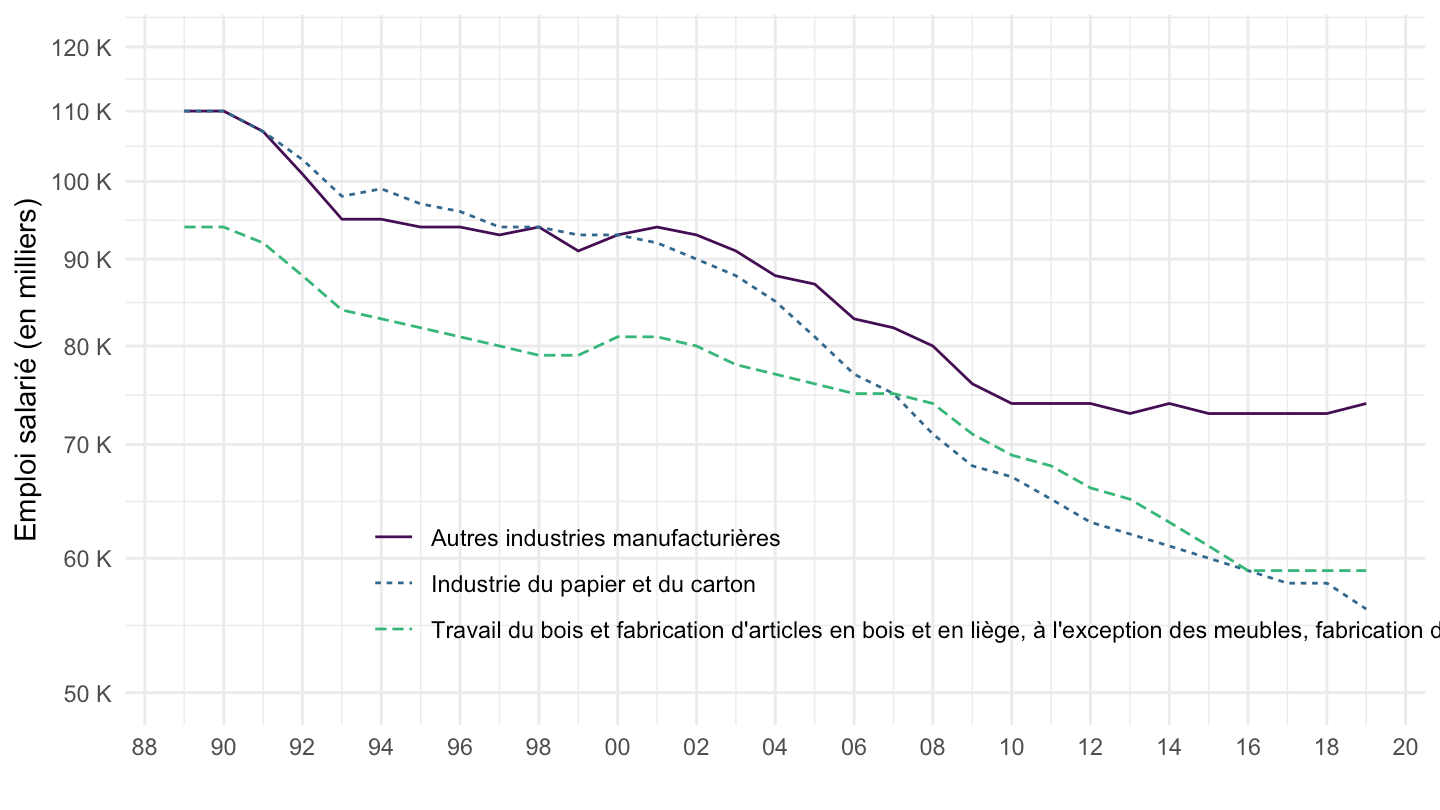
T102B %>%
  filter(a88 %in% c("18", "36", "13")) %>%
  ggplot() + theme_minimal() + ylab("Emploi salarié (en milliers)") + xlab("") +
  geom_line(aes(x = date, y = value, color = A88, linetype = A88)) +
  scale_color_manual(values = viridis(4)[1:3]) +
  scale_x_date(breaks = seq(1920, 2025, 2) %>% paste0("-01-01") %>% as.Date,
               labels = date_format("%y")) +
  theme(legend.position = c(0.7, 0.15),
        legend.title = element_blank()) +
  scale_y_log10(breaks = seq(20, 250, 10),
                labels = dollar_format(accuracy = 1, prefix = "", suffix = " K"),
                limits = c(20, 180))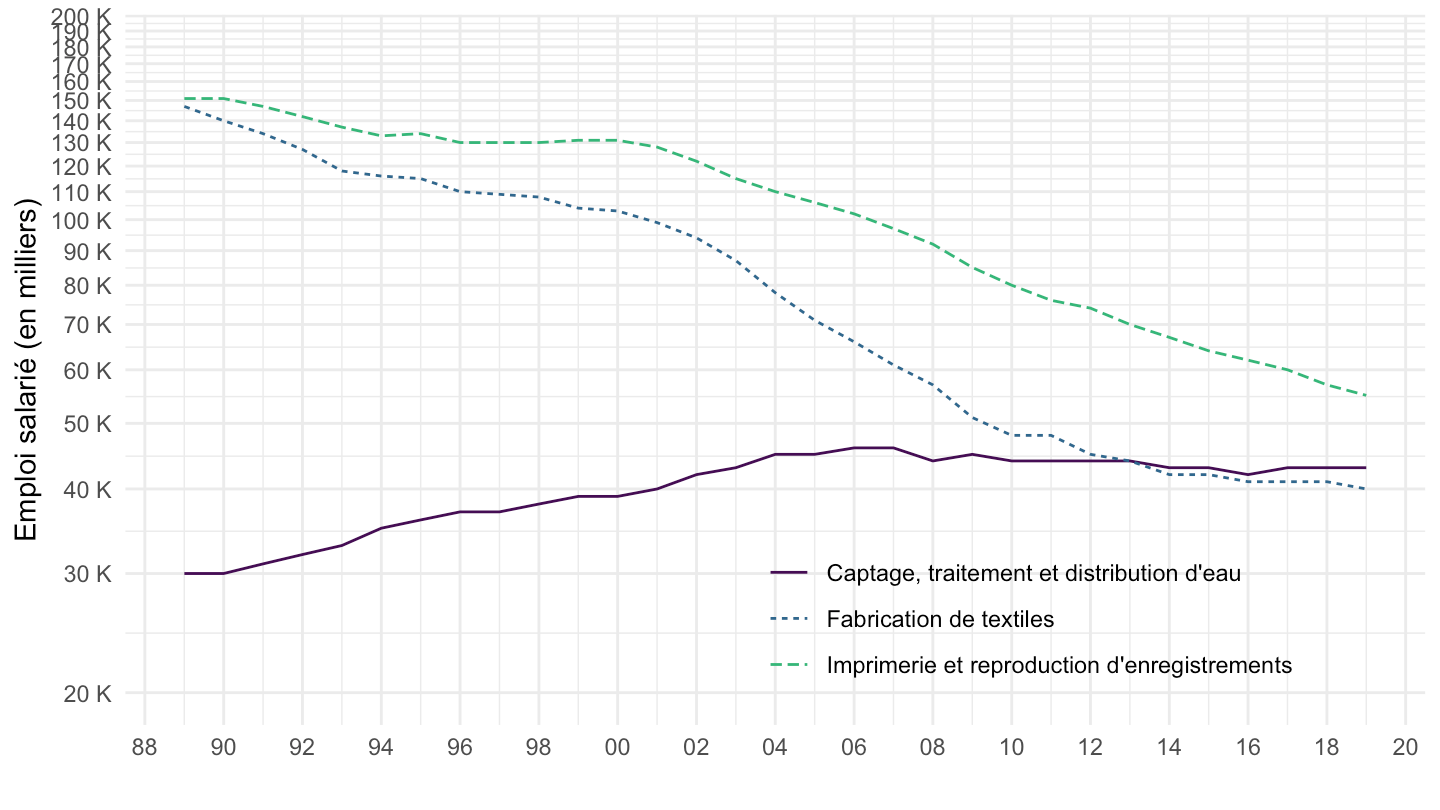
T102B %>%
  filter(a88 %in% c("11", "31", "15")) %>%
  ggplot() + theme_minimal() + ylab("Emploi salarié (en milliers)") + xlab("") +
  geom_line(aes(x = date, y = value, color = A88, linetype = A88)) +
  scale_color_manual(values = viridis(4)[1:3]) +
  scale_x_date(breaks = seq(1920, 2025, 2) %>% paste0("-01-01") %>% as.Date,
               labels = date_format("%y")) +
  theme(legend.position = c(0.7, 0.85),
        legend.title = element_blank()) +
  scale_y_log10(breaks = seq(20, 250, 10),
                labels = dollar_format(accuracy = 1, prefix = "", suffix = " K"),
                limits = c(20, 140))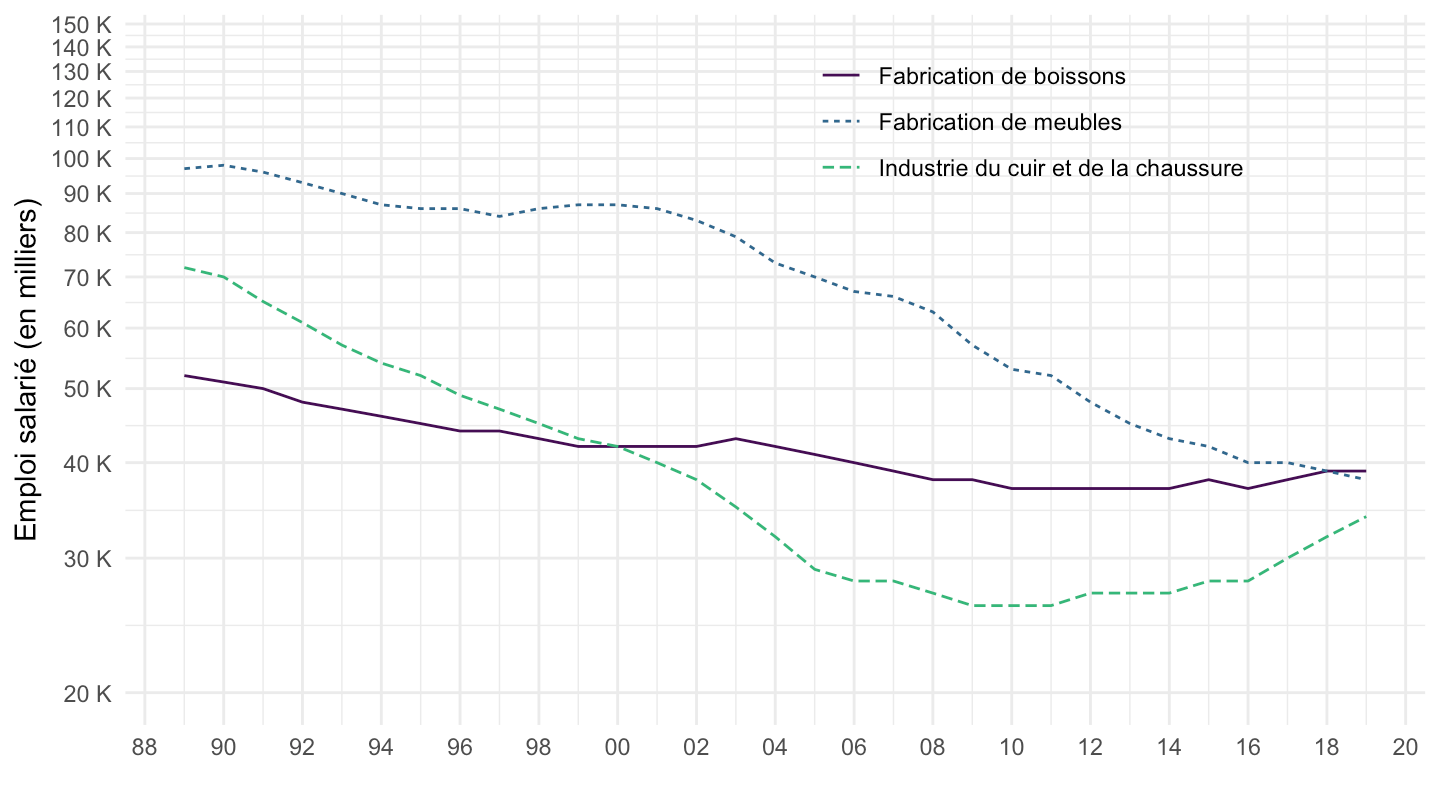
T102B %>%
  filter(a88 %in% c("14", "37", "08")) %>%
  ggplot() + theme_minimal() + ylab("Emploi salarié (en milliers)") + xlab("") +
  geom_line(aes(x = date, y = value, color = A88, linetype = A88)) +
  scale_color_manual(values = viridis(4)[1:3]) +
  scale_x_date(breaks = seq(1920, 2025, 2) %>% paste0("-01-01") %>% as.Date,
               labels = date_format("%y")) +
  theme(legend.position = c(0.7, 0.85),
        legend.title = element_blank()) +
  scale_y_log10(breaks = seq(10, 250, 10),
                labels = dollar_format(accuracy = 1, prefix = "", suffix = " K"))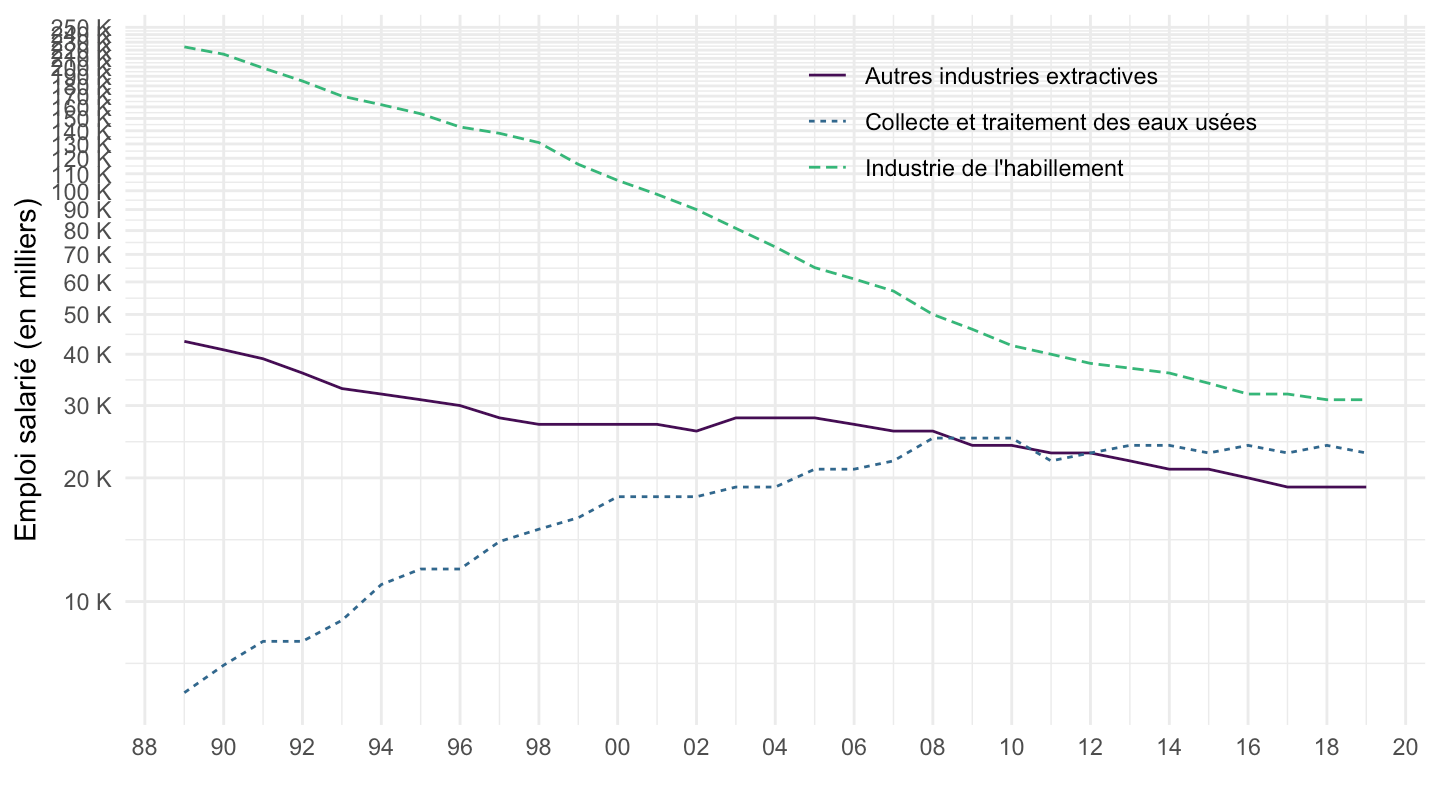
T102B %>%
  filter(a88 %in% c("19", "39", "12")) %>%
  ggplot() + theme_minimal() + ylab("Emploi salarié (en milliers)") + xlab("") +
  geom_line(aes(x = date, y = value, color = A88, linetype = A88)) +
  scale_color_manual(values = viridis(4)[1:3]) +
  scale_x_date(breaks = seq(1920, 2025, 2) %>% paste0("-01-01") %>% as.Date,
               labels = date_format("%y")) +
  theme(legend.position = c(0.6, 0.9),
        legend.title = element_blank()) +
  scale_y_log10(breaks = c(seq(1, 10, 1), seq(10, 250, 10)),
                labels = dollar_format(accuracy = 1, prefix = "", suffix = " K"),
                limits = c(1, 30))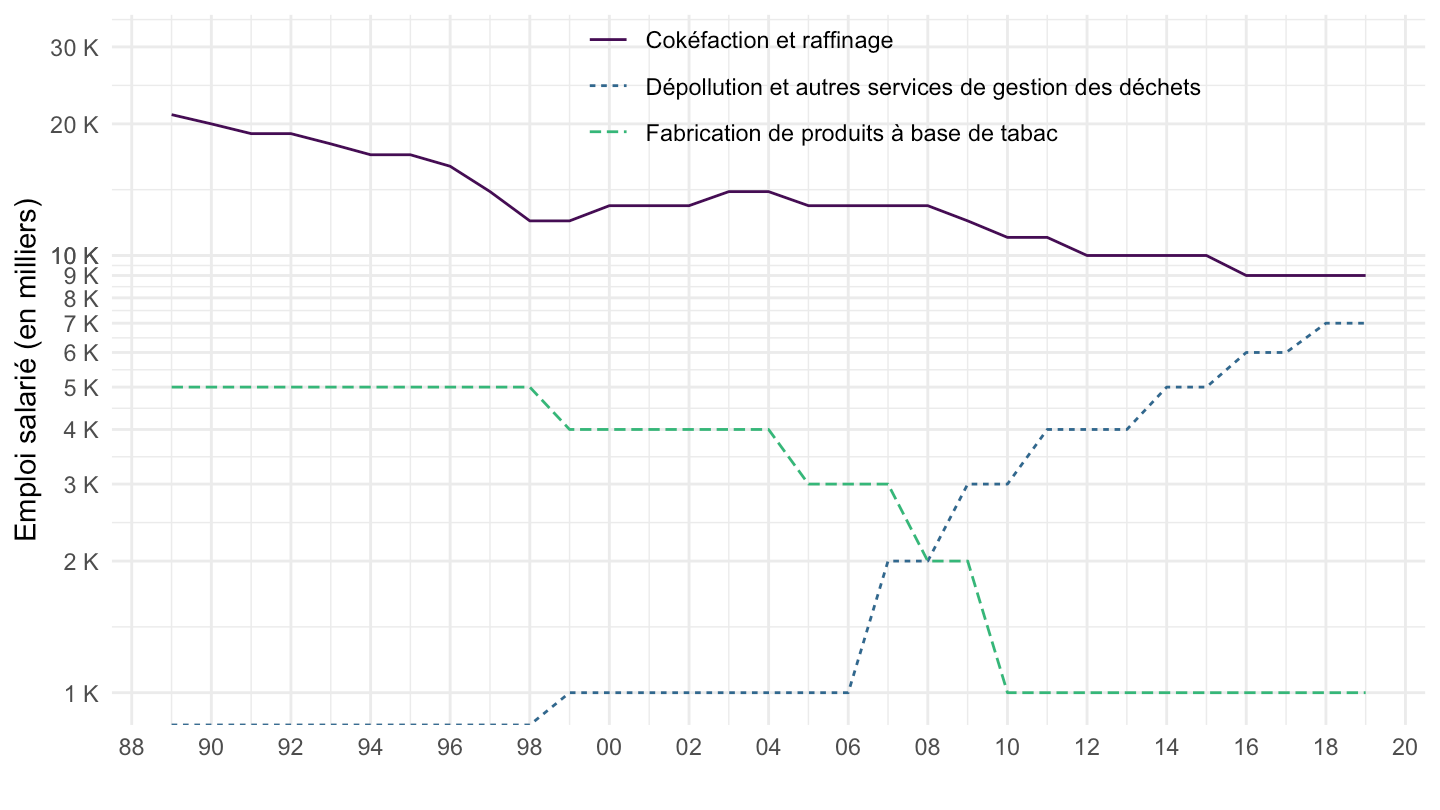
T102B %>%
  filter(a88 %in% c("05", "06", "07")) %>%
  ggplot() + theme_minimal() + ylab("Emploi salarié (en milliers)") + xlab("") +
  geom_line(aes(x = date, y = value, color = A88, linetype = A88)) +
  scale_color_manual(values = viridis(4)[1:3]) +
  scale_x_date(breaks = seq(1920, 2025, 2) %>% paste0("-01-01") %>% as.Date,
               labels = date_format("%y")) +
  theme(legend.position = c(0.6, 0.9),
        legend.title = element_blank()) +
  scale_y_log10(breaks = c(seq(1, 10, 1), seq(10, 250, 10)),
                labels = dollar_format(accuracy = 1, prefix = "", suffix = " K"),
                limits = c(1, 30))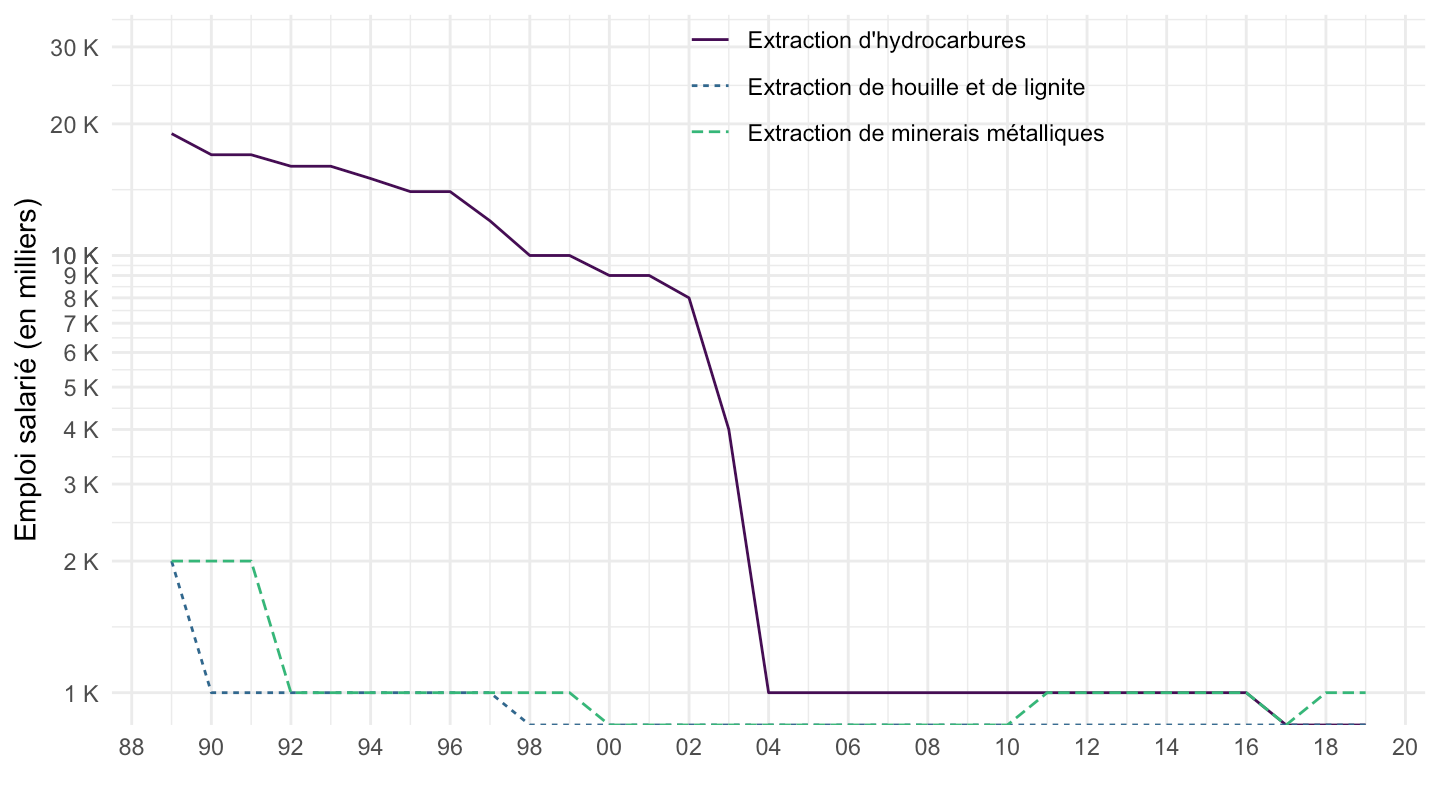
T102B %>%
  mutate(a88 = as.numeric(a88)) %>%
  filter(a88 > 39) %>%
  group_by(a88, A88) %>%
  summarise(Nobs = n(),
            value2018 = value[date == as.Date("2019-01-01")]) %>%
  arrange(-value2018) %>%
{if (is_html_output()) datatable(., filter = 'top', rownames = F) else .}T102B %>%
filter(a88 %in% c("84", "47", "85")) %>%
ggplot() + theme_minimal() + ylab("Emploi salarié (en milliers)") + xlab("") +
geom_line(aes(x = date, y = value, color = A88, linetype = A88)) +
scale_color_manual(values = viridis(4)[1:3]) +
scale_x_date(breaks = seq(1920, 2025, 1) %>% paste0("-01-01") %>% as.Date,
labels = date_format("%y")) +
theme(legend.position = c(0.6, 0.6),
legend.title = element_blank()) +
scale_y_log10(breaks = seq(200, 3000, 100),
labels = dollar_format(accuracy = 1, prefix = "", suffix = " K"))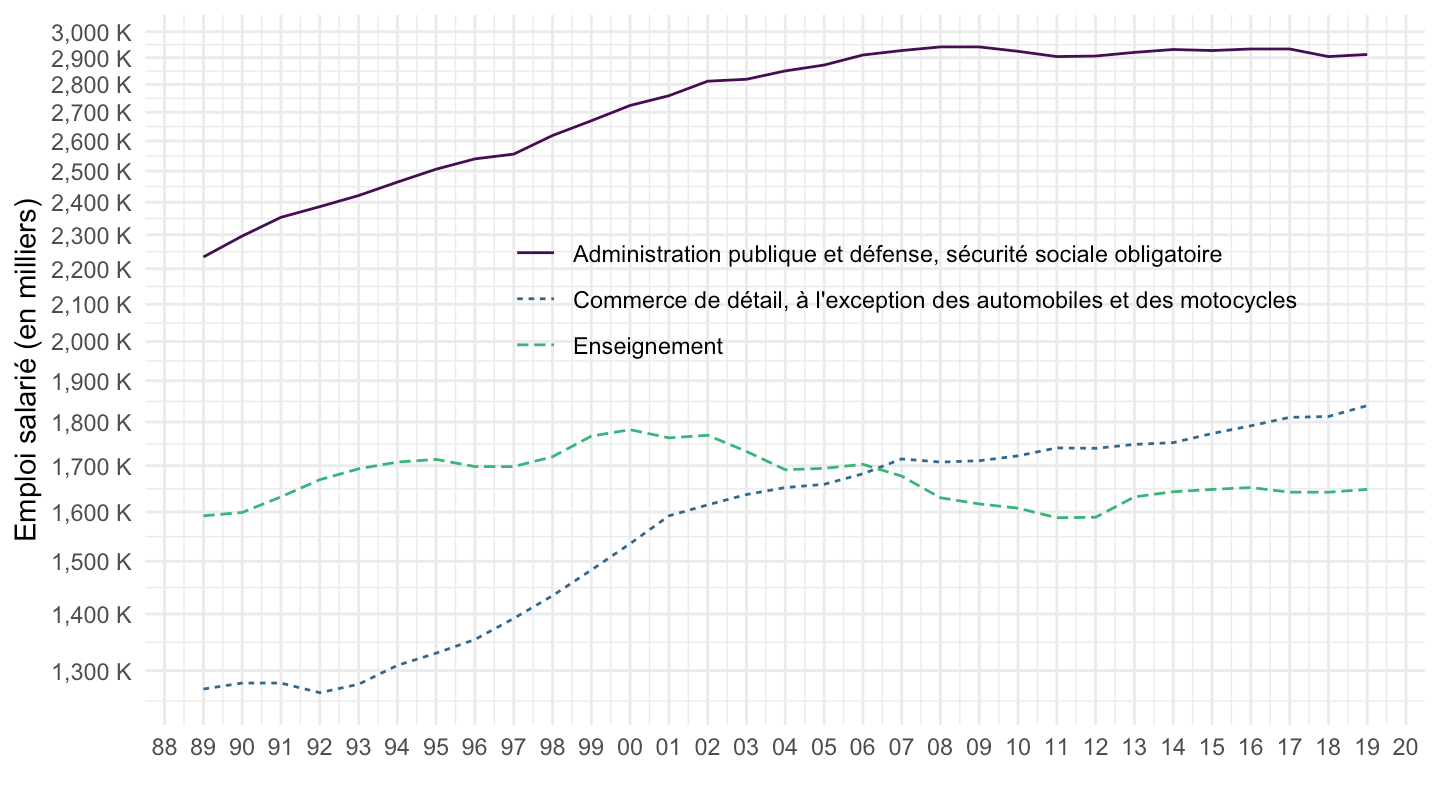
T102B %>%
  filter(a88 %in% c("86", "88", "43")) %>%
  ggplot() + theme_minimal() + ylab("Emploi salarié (en milliers)") + xlab("") +
  geom_line(aes(x = date, y = value, color = A88, linetype = A88)) +
  scale_color_manual(values = viridis(4)[1:3]) +
  scale_x_date(breaks = seq(1920, 2025, 2) %>% paste0("-01-01") %>% as.Date,
               labels = date_format("%y")) +
  theme(legend.position = c(0.7, 0.2),
        legend.title = element_blank()) +
  scale_y_log10(breaks = seq(200, 3000, 100),
                labels = dollar_format(accuracy = 1, prefix = "", suffix = " K"))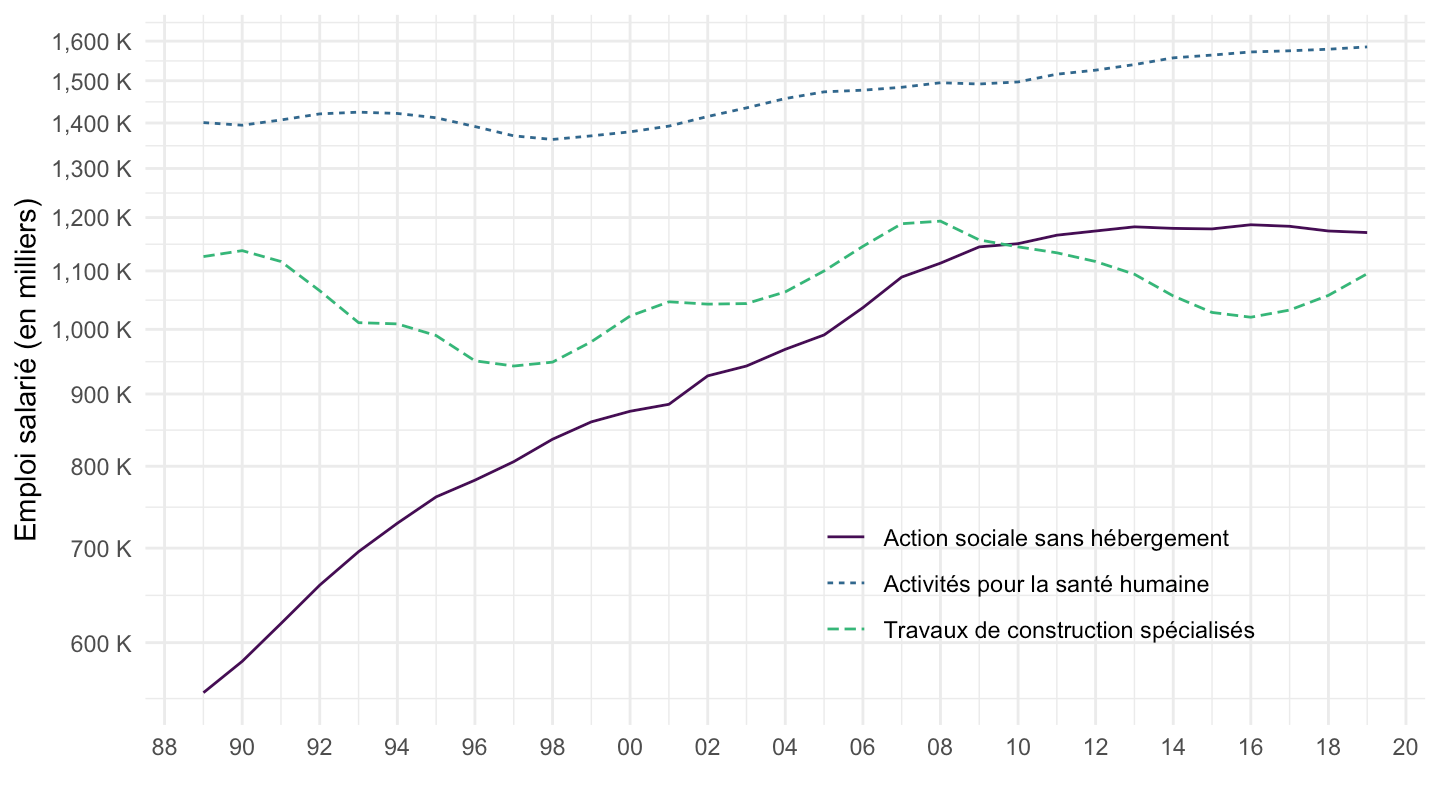
T102B %>%
  filter(a88 %in% c("46", "78", "56")) %>%
  ggplot() + theme_minimal() + ylab("Emploi salarié (en milliers)") + xlab("") +
  geom_line(aes(x = date, y = value, color = A88, linetype = A88)) +
  scale_color_manual(values = viridis(4)[1:3]) +
  scale_x_date(breaks = seq(1920, 2025, 2) %>% paste0("-01-01") %>% as.Date,
               labels = date_format("%y")) +
  theme(legend.position = c(0.6, 0.15),
        legend.title = element_blank()) +
  scale_y_log10(breaks = seq(200, 3000, 100),
                labels = dollar_format(accuracy = 1, prefix = "", suffix = " K"))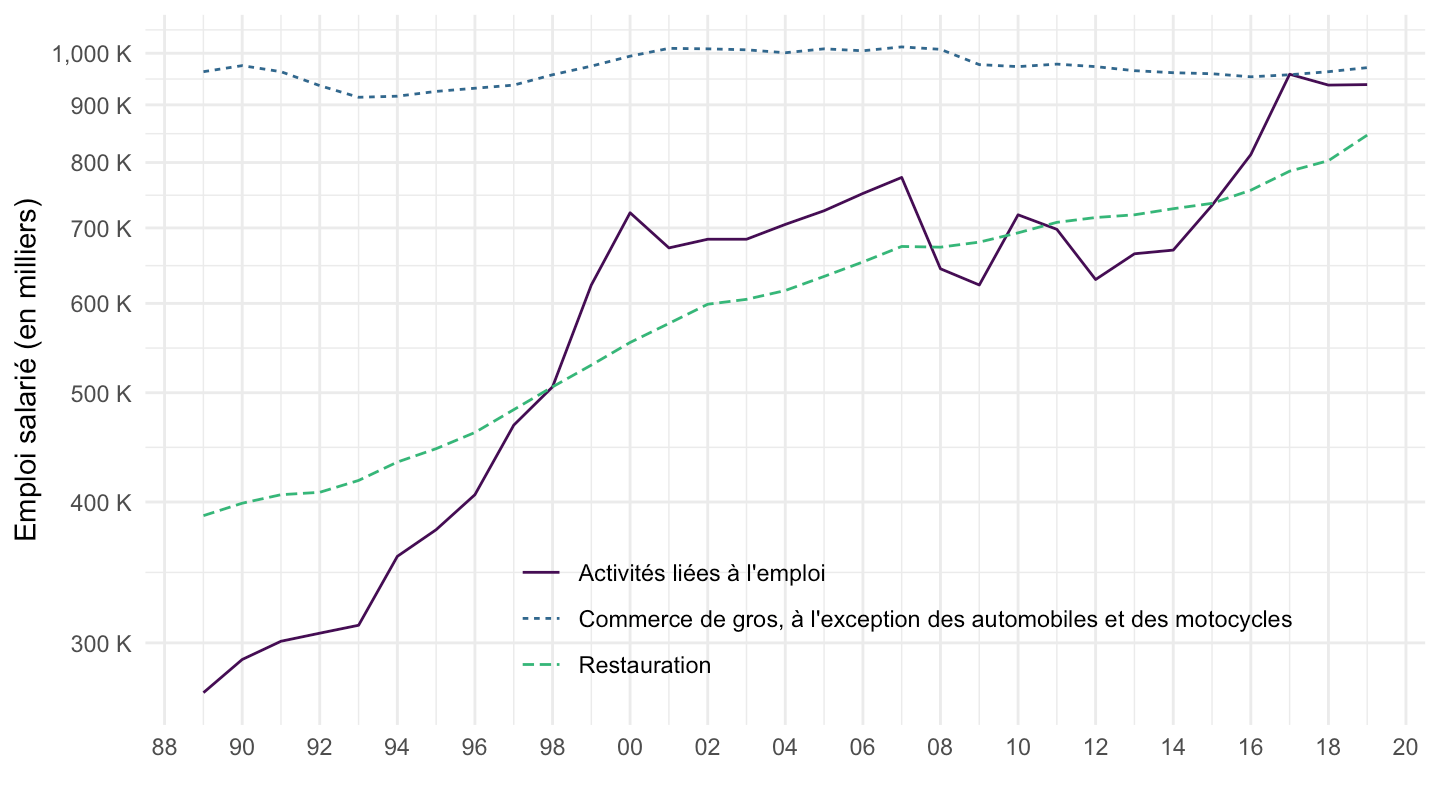
T102B %>%
  filter(a88 %in% c("49", "87", "64")) %>%
  ggplot() + theme_minimal() + ylab("Emploi salarié (en milliers)") + xlab("") +
  geom_line(aes(x = date, y = value, color = A88, linetype = A88)) +
  scale_color_manual(values = viridis(4)[1:3]) +
  scale_x_date(breaks = seq(1920, 2025, 2) %>% paste0("-01-01") %>% as.Date,
               labels = date_format("%y")) +
  theme(legend.position = c(0.6, 0.15),
        legend.title = element_blank()) +
  scale_y_log10(breaks = seq(200, 3000, 100),
                labels = dollar_format(accuracy = 1, prefix = "", suffix = " K"))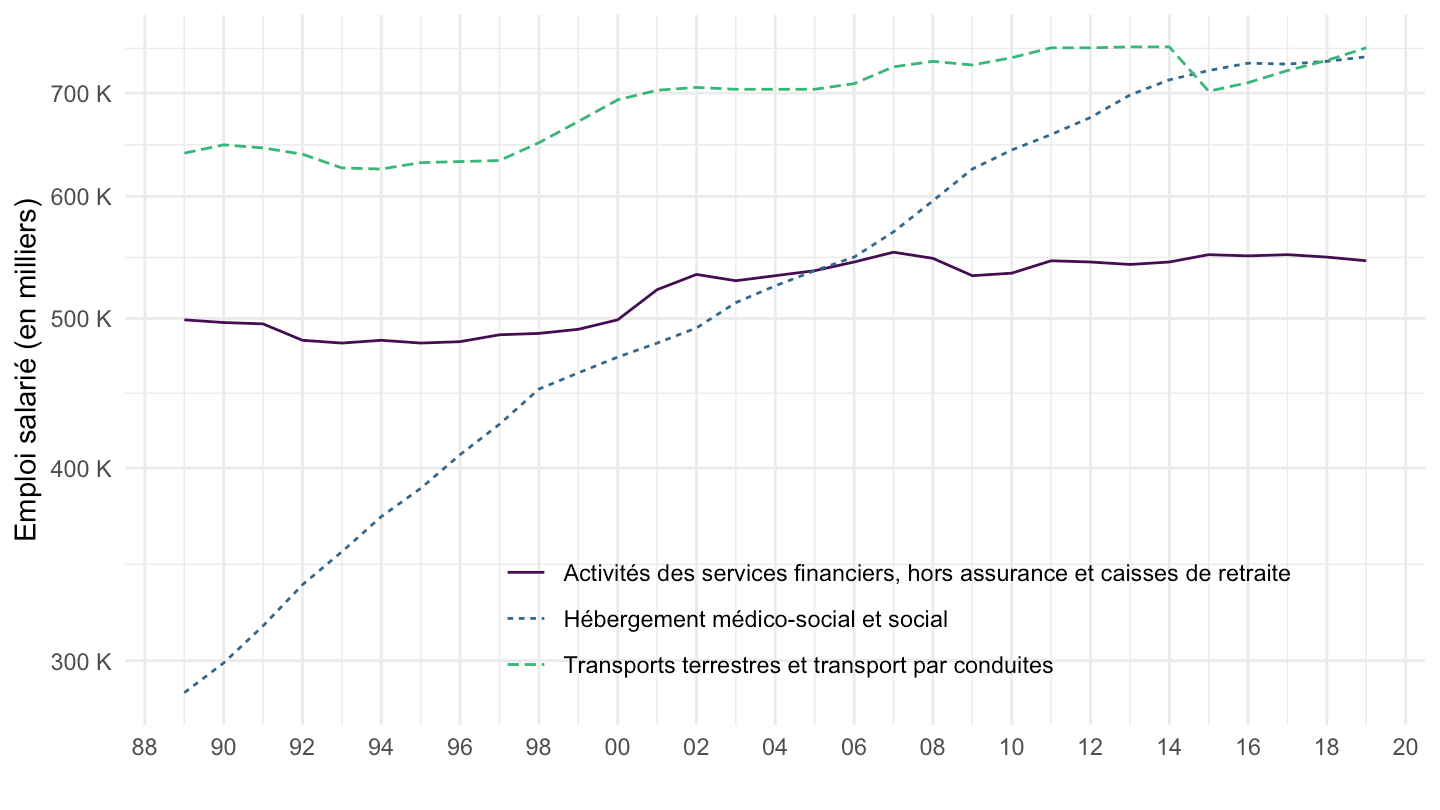
T102B %>%
  filter(a88 %in% c("81", "97", "71")) %>%
  ggplot() + theme_minimal() + ylab("Emploi salarié (en milliers)") + xlab("") +
  geom_line(aes(x = date, y = value, color = A88, linetype = A88)) +
  scale_color_manual(values = viridis(4)[1:3]) +
  scale_x_date(breaks = seq(1920, 2025, 2) %>% paste0("-01-01") %>% as.Date,
               labels = date_format("%y")) +
  theme(legend.position = c(0.6, 0.15),
        legend.title = element_blank()) +
  scale_y_log10(breaks = seq(200, 3000, 100),
                labels = dollar_format(accuracy = 1, prefix = "", suffix = " K"))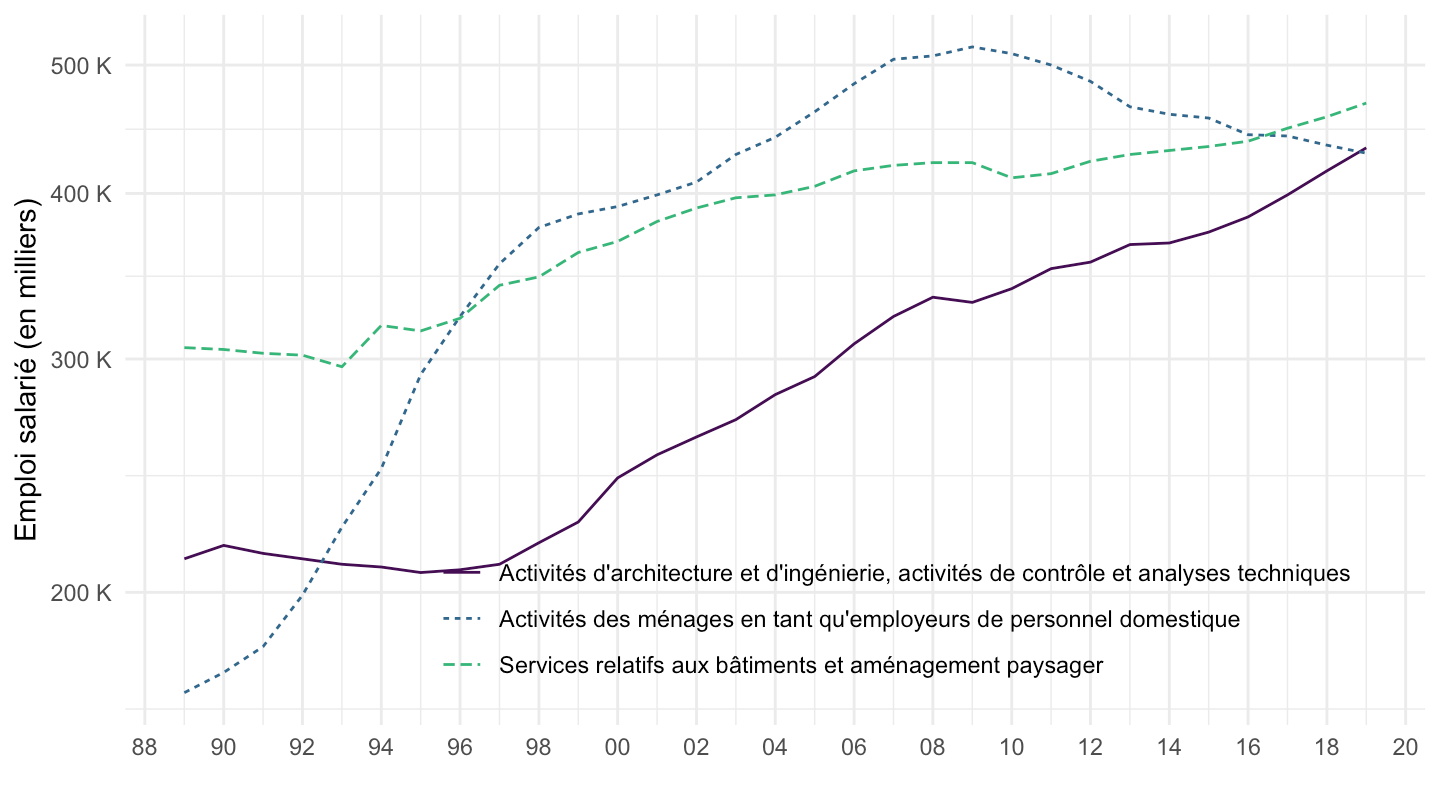
T102B %>%
  filter(a88 %in% c("70", "62", "45")) %>%
  ggplot() + theme_minimal() + ylab("Emploi salarié (en milliers)") + xlab("") +
  geom_line(aes(x = date, y = value, color = A88, linetype = A88)) +
  scale_color_manual(values = viridis(4)[1:3]) +
  scale_x_date(breaks = seq(1920, 2025, 2) %>% paste0("-01-01") %>% as.Date,
               labels = date_format("%y")) +
  theme(legend.position = c(0.6, 0.15),
        legend.title = element_blank()) +
  scale_y_log10(breaks = seq(100, 3000, 100),
                labels = dollar_format(accuracy = 1, prefix = "", suffix = " K"))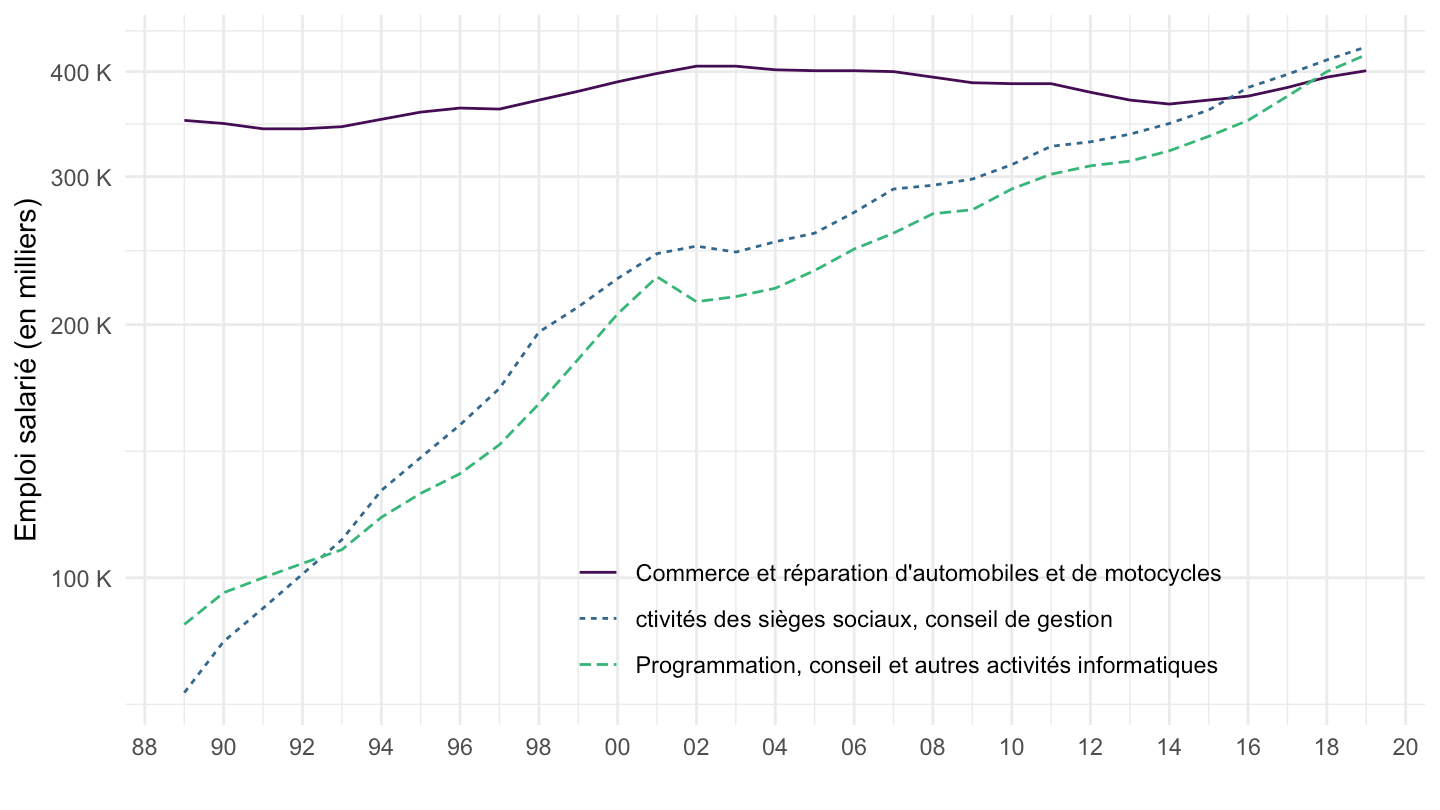
T102B %>%
  filter(a88 %in% c("52", "94", "82")) %>%
  ggplot() + theme_minimal() + ylab("Emploi salarié (en milliers)") + xlab("") +
  geom_line(aes(x = date, y = value, color = A88, linetype = A88)) +
  scale_color_manual(values = viridis(4)[1:3]) +
  scale_x_date(breaks = seq(1920, 2025, 2) %>% paste0("-01-01") %>% as.Date,
               labels = date_format("%y")) +
  theme(legend.position = c(0.6, 0.15),
        legend.title = element_blank()) +
  scale_y_log10(breaks = seq(20, 3000, 20),
                labels = dollar_format(accuracy = 1, prefix = "", suffix = " K"),
                limits = c(80, 380))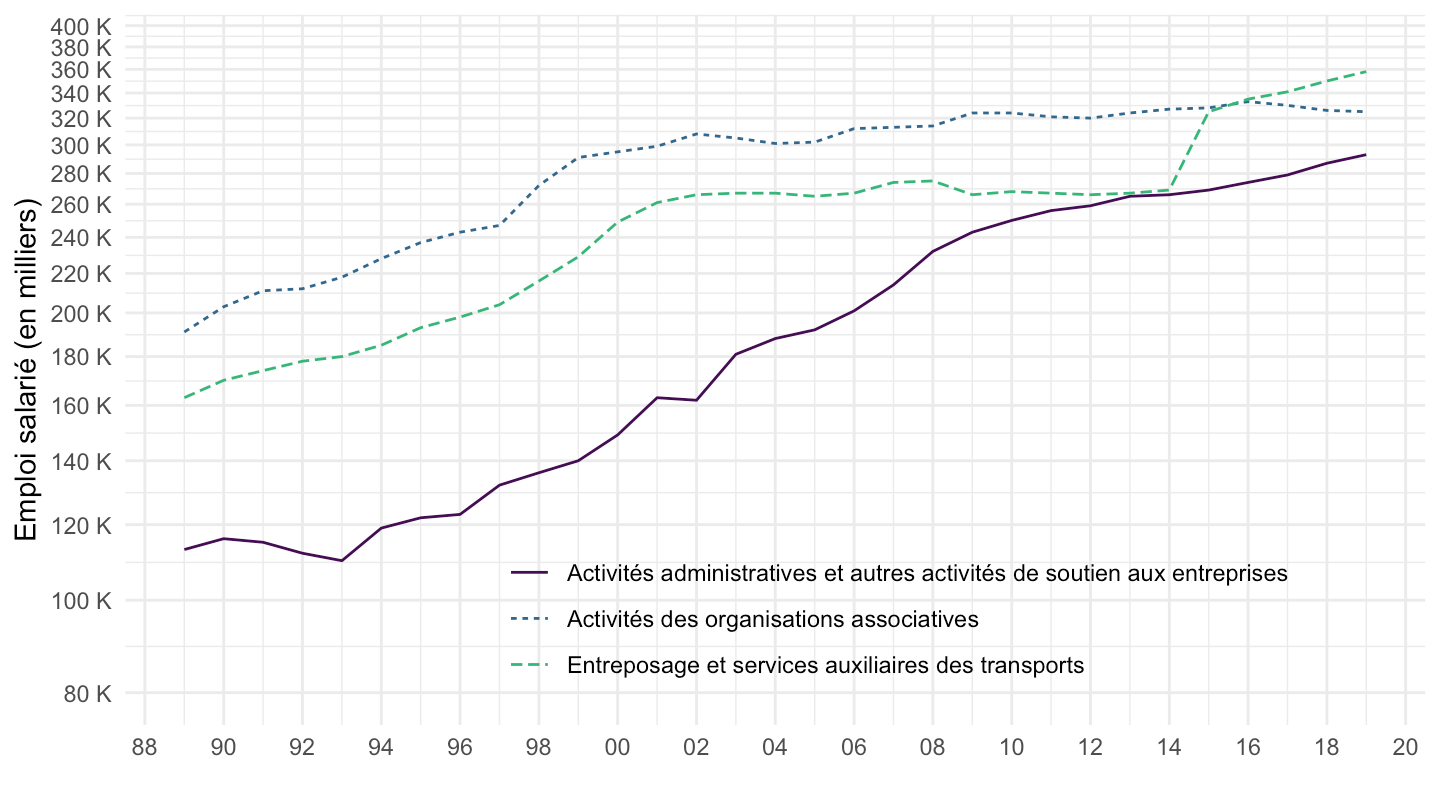
T102B %>%
  filter(a88 %in% c("69", "68", "53")) %>%
  ggplot() + theme_minimal() + ylab("Emploi salarié (en milliers)") + xlab("") +
  geom_line(aes(x = date, y = value, color = A88, linetype = A88)) +
  scale_color_manual(values = viridis(4)[1:3]) +
  scale_x_date(breaks = seq(1920, 2025, 2) %>% paste0("-01-01") %>% as.Date,
               labels = date_format("%y")) +
  theme(legend.position = c(0.6, 0.15),
        legend.title = element_blank()) +
  scale_y_log10(breaks = seq(20, 3000, 20),
                labels = dollar_format(accuracy = 1, prefix = "", suffix = " K"),
                limits = c(160, 380))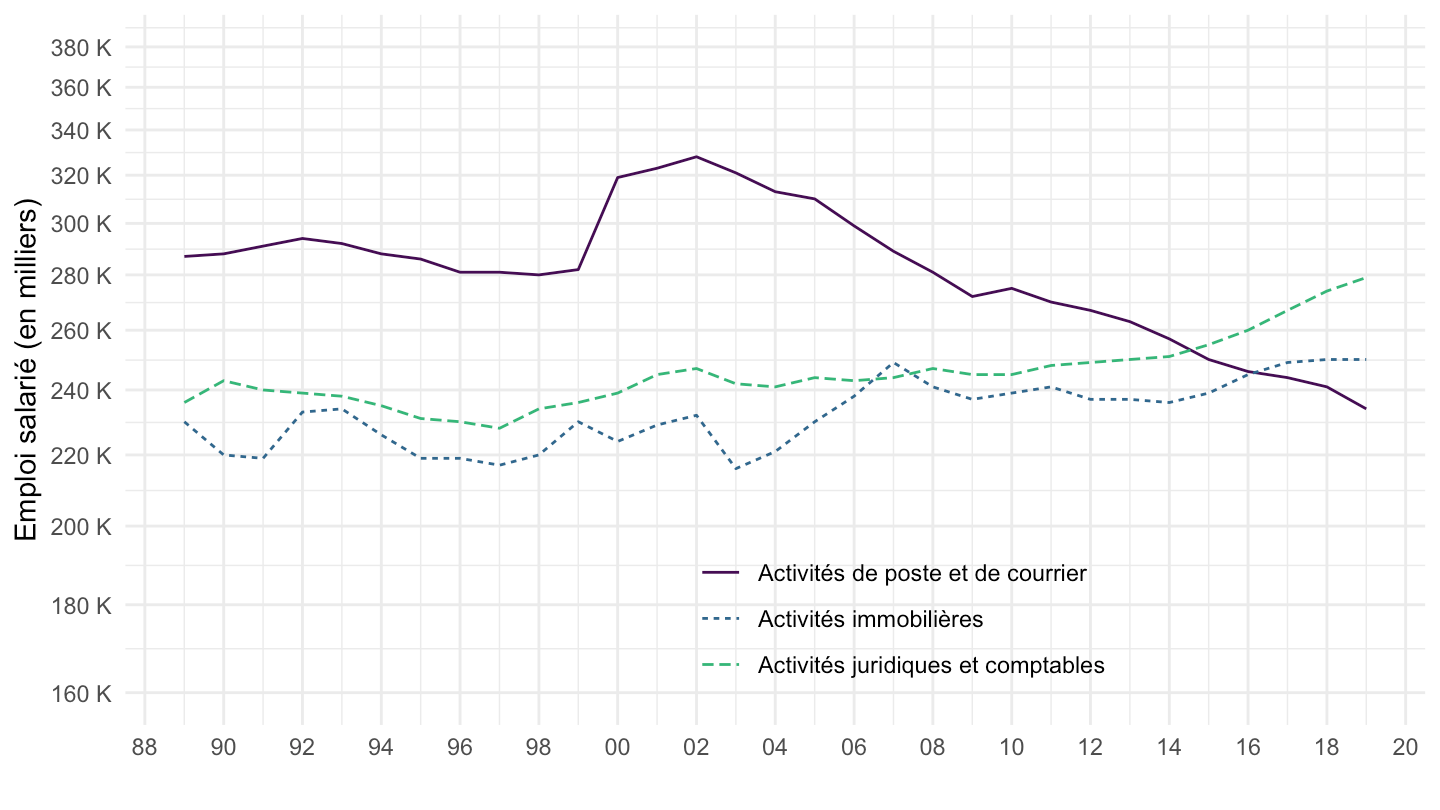
T102B %>%
  filter(a88 %in% c("55", "96", "65")) %>%
  ggplot() + theme_minimal() + ylab("Emploi salarié (en milliers)") + xlab("") +
  geom_line(aes(x = date, y = value, color = A88, linetype = A88)) +
  scale_color_manual(values = viridis(4)[1:3]) +
  scale_x_date(breaks = seq(1920, 2025, 2) %>% paste0("-01-01") %>% as.Date,
               labels = date_format("%y")) +
  theme(legend.position = c(0.6, 0.15),
        legend.title = element_blank()) +
  scale_y_log10(breaks = seq(20, 3000, 20),
                labels = dollar_format(accuracy = 1, prefix = "", suffix = " K"),
                limits = c(120, 260))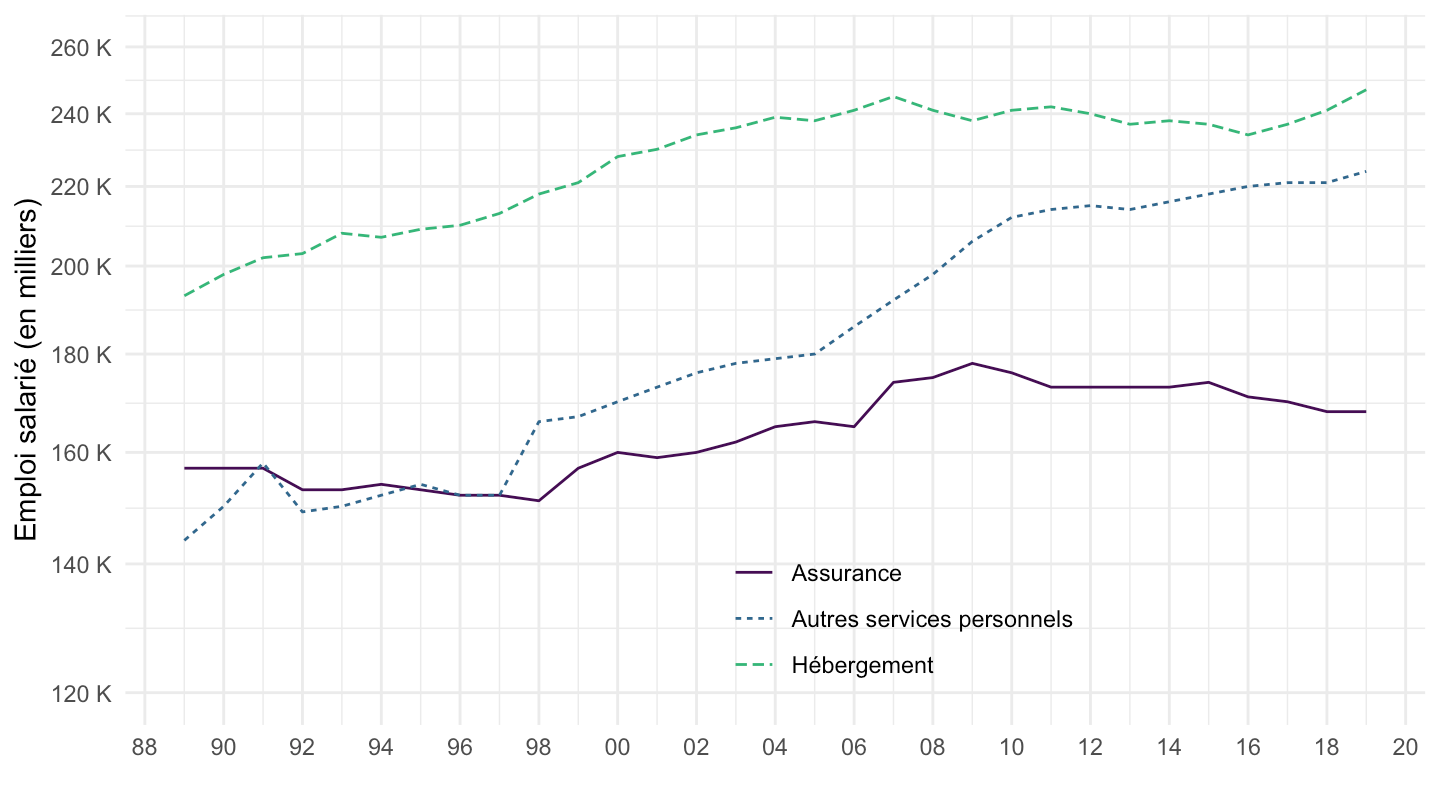
T102B %>%
  filter(a88 %in% c("72", "42", "80")) %>%
  ggplot() + theme_minimal() + ylab("Emploi salarié (en milliers)") + xlab("") +
  geom_line(aes(x = date, y = value, color = A88, linetype = A88)) +
  scale_color_manual(values = viridis(4)[1:3]) +
  scale_x_date(breaks = seq(1920, 2025, 2) %>% paste0("-01-01") %>% as.Date,
               labels = date_format("%y")) +
  theme(legend.position = c(0.6, 0.15),
        legend.title = element_blank()) +
  scale_y_log10(breaks = seq(20, 3000, 20),
                labels = dollar_format(accuracy = 1, prefix = "", suffix = " K"),
                limits = c(100, 180))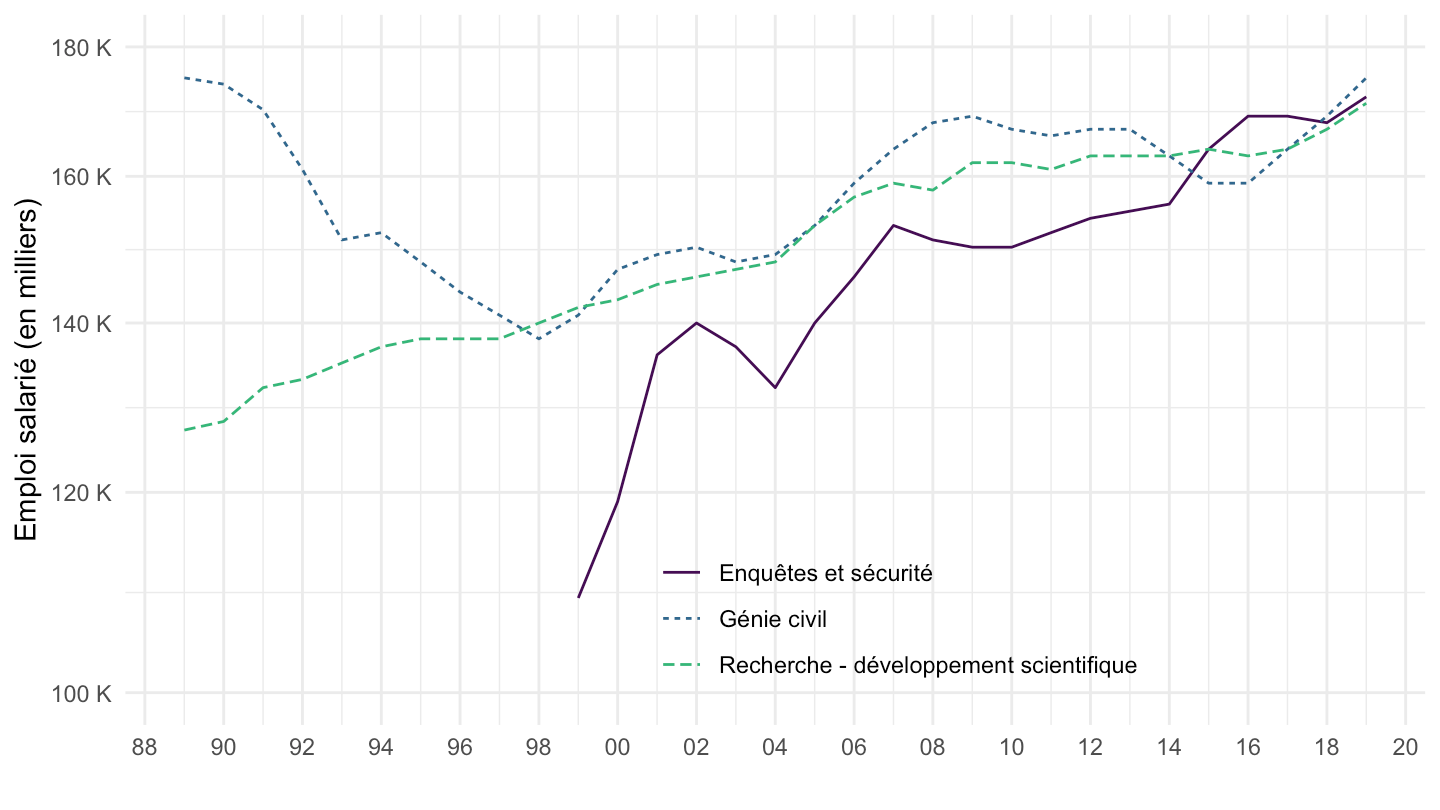
T102B %>%
  filter(a88 %in% c("66", "93", "41")) %>%
  ggplot() + theme_minimal() + ylab("Emploi salarié (en milliers)") + xlab("") +
  geom_line(aes(x = date, y = value, color = A88, linetype = A88)) +
  scale_color_manual(values = viridis(4)[1:3]) +
  scale_x_date(breaks = seq(1920, 2025, 2) %>% paste0("-01-01") %>% as.Date,
               labels = date_format("%y")) +
  theme(legend.position = c(0.6, 0.15),
        legend.title = element_blank()) +
  scale_y_log10(breaks = seq(20, 3000, 20),
                labels = dollar_format(accuracy = 1, prefix = "", suffix = " K"),
                limits = c(60, 180))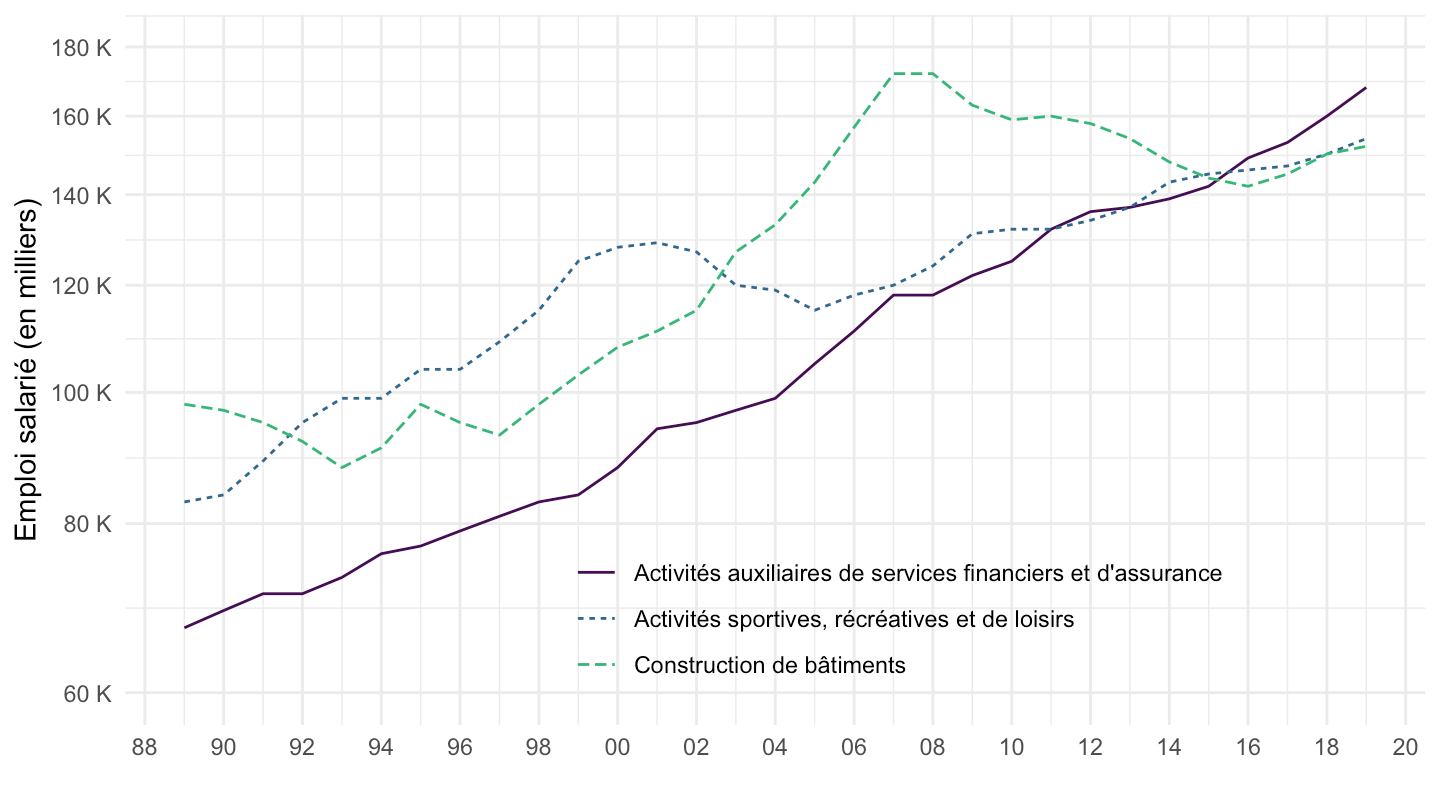
T102B %>%
  filter(a88 %in% c("73", "58", "61")) %>%
  ggplot() + theme_minimal() + ylab("Emploi salarié (en milliers)") + xlab("") +
  geom_line(aes(x = date, y = value, color = A88, linetype = A88)) +
  scale_color_manual(values = viridis(4)[1:3]) +
  scale_x_date(breaks = seq(1920, 2025, 2) %>% paste0("-01-01") %>% as.Date,
               labels = date_format("%y")) +
  theme(legend.position = c(0.6, 0.15),
        legend.title = element_blank()) +
  scale_y_log10(breaks = seq(20, 3000, 20),
                labels = dollar_format(accuracy = 1, prefix = "", suffix = " K"),
                limits = c(100, 180))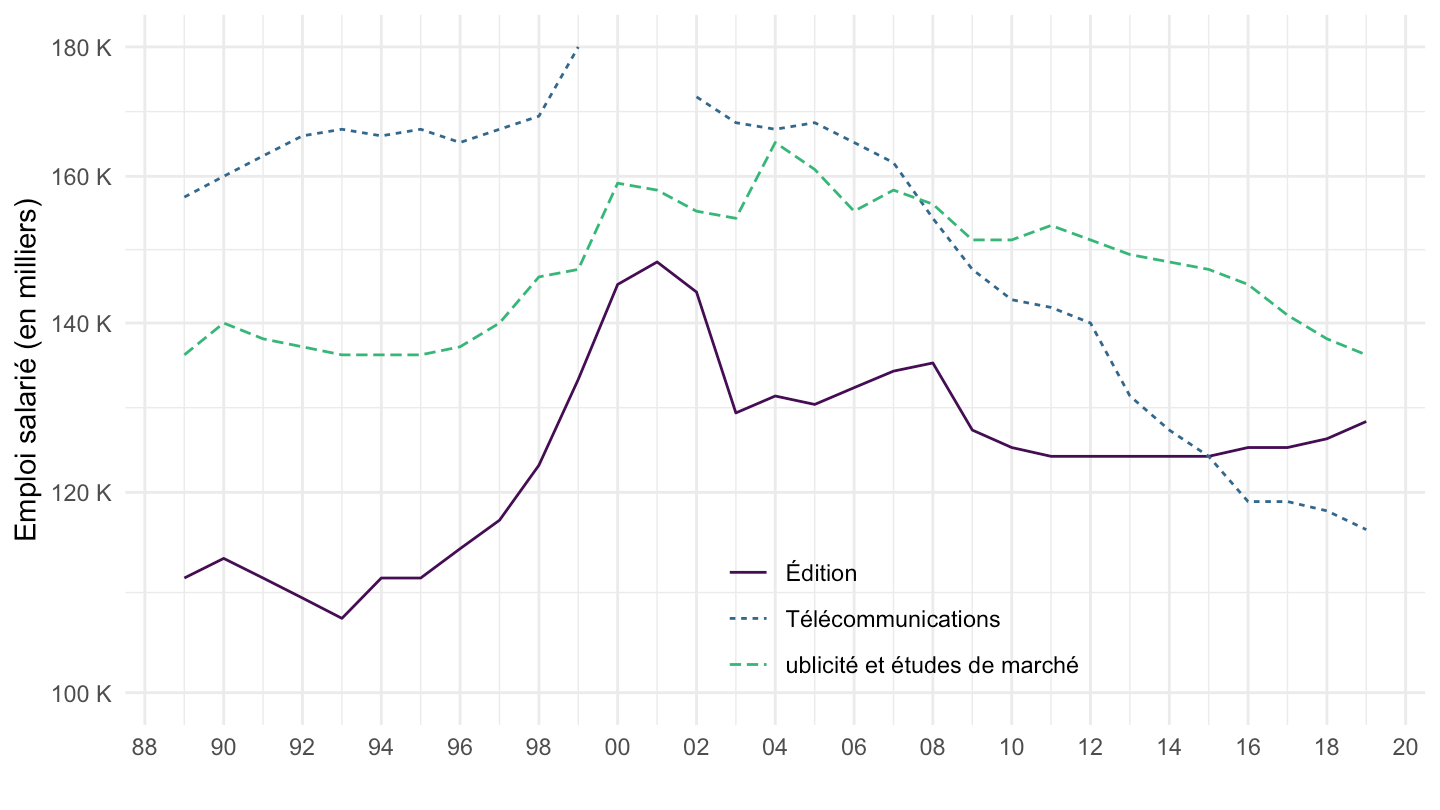
T102B %>%
  filter(a88 %in% c("77", "90", "51")) %>%
  ggplot() + theme_minimal() + ylab("Emploi salarié (en milliers)") + xlab("") +
  geom_line(aes(x = date, y = value, color = A88, linetype = A88)) +
  scale_color_manual(values = viridis(4)[1:3]) +
  scale_x_date(breaks = seq(1920, 2025, 2) %>% paste0("-01-01") %>% as.Date,
               labels = date_format("%y")) +
  theme(legend.position = c(0.6, 0.15),
        legend.title = element_blank()) +
  scale_y_log10(breaks = seq(20, 3000, 20),
                labels = dollar_format(accuracy = 1, prefix = "", suffix = " K"))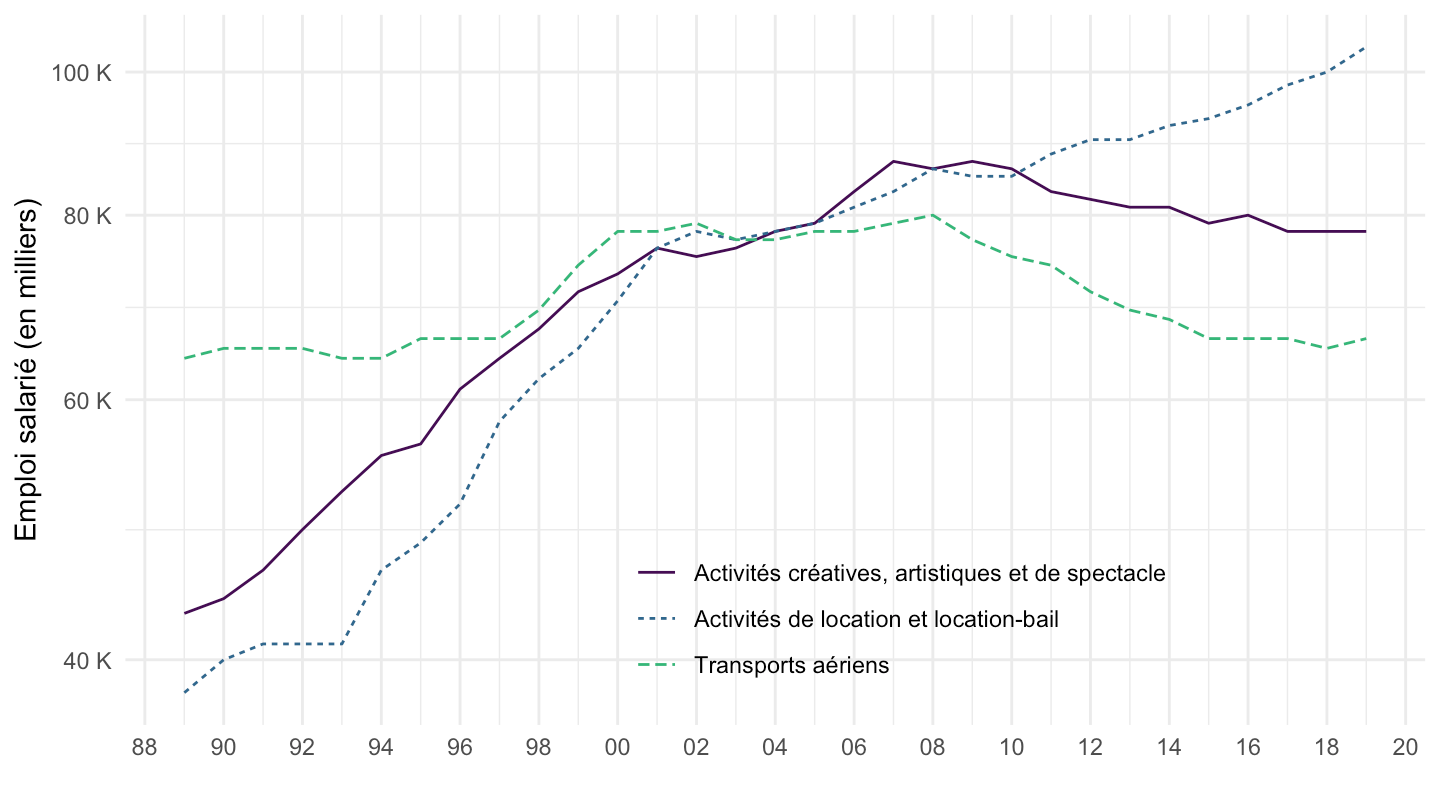
T102B %>%
  filter(a88 %in% c("63", "74", "59")) %>%
  ggplot() + theme_minimal() + ylab("Emploi salarié (en milliers)") + xlab("") +
  geom_line(aes(x = date, y = value, color = A88, linetype = A88)) +
  scale_color_manual(values = viridis(4)[1:3]) +
  scale_x_date(breaks = seq(1920, 2025, 2) %>% paste0("-01-01") %>% as.Date,
               labels = date_format("%y")) +
  theme(legend.position = c(0.7, 0.85),
        legend.title = element_blank()) +
  scale_y_log10(breaks = seq(10, 3000, 10),
                labels = dollar_format(accuracy = 1, prefix = "", suffix = " K"))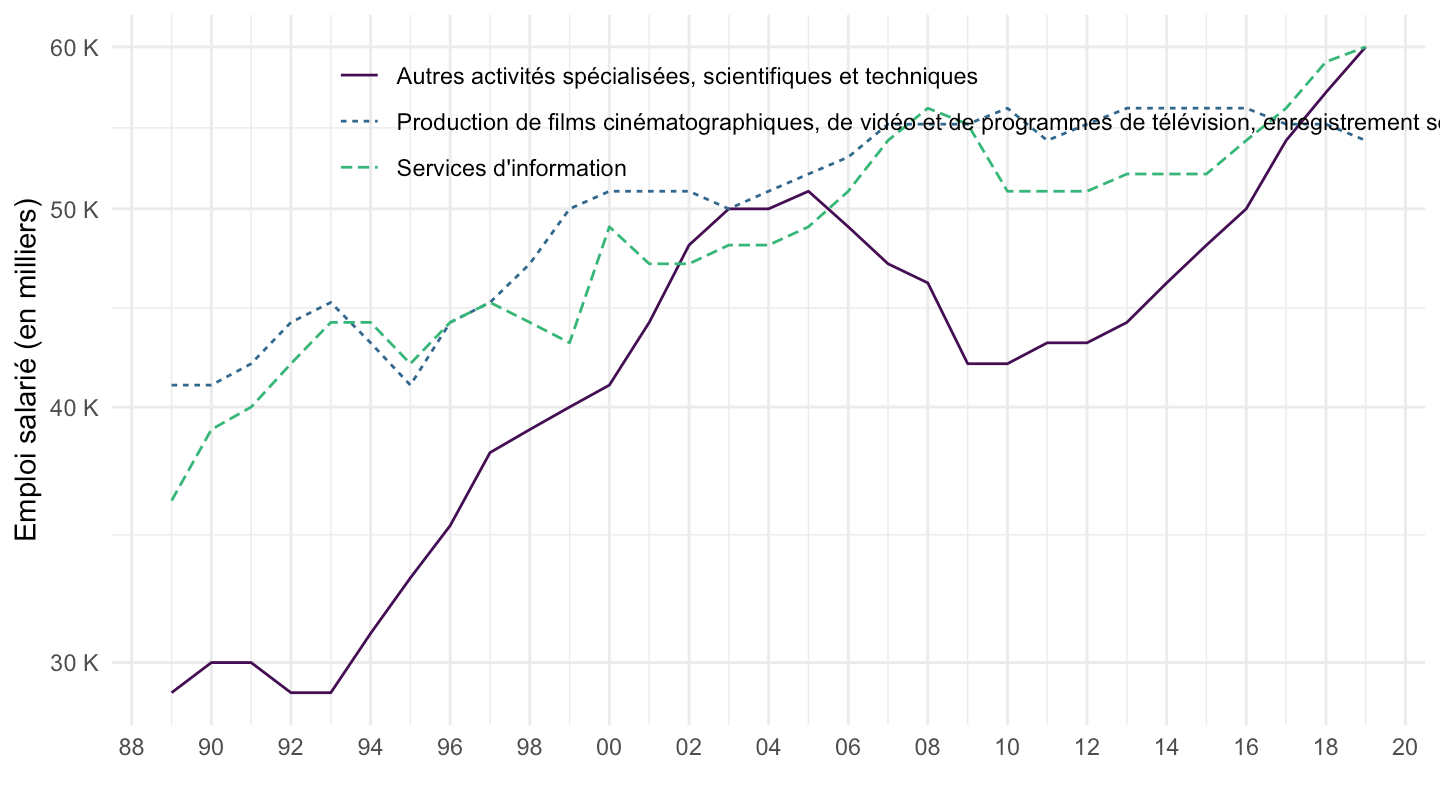
T102B %>%
  filter(a88 %in% c("79", "91", "60")) %>%
  ggplot() + theme_minimal() + ylab("Emploi salarié (en milliers)") + xlab("") +
  geom_line(aes(x = date, y = value, color = A88, linetype = A88)) +
  scale_color_manual(values = viridis(4)[1:3]) +
  scale_x_date(breaks = seq(1920, 2025, 2) %>% paste0("-01-01") %>% as.Date,
               labels = date_format("%y")) +
  theme(legend.position = c(0.5, 0.85),
        legend.title = element_blank()) +
  scale_y_log10(breaks = seq(20, 3000, 5),
                labels = dollar_format(accuracy = 1, prefix = "", suffix = " K"))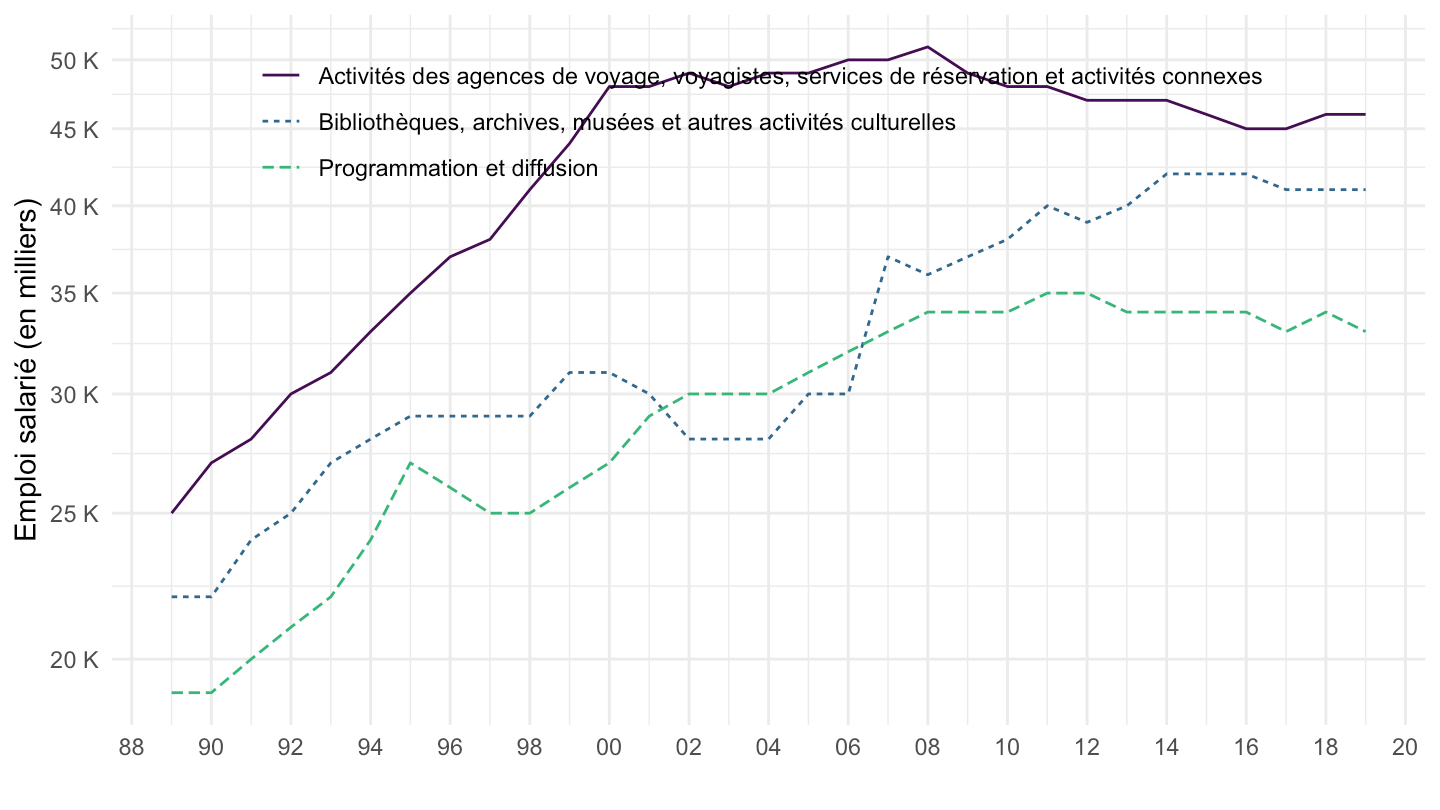
T102B %>%
  filter(a88 %in% c("95", "92", "75")) %>%
  ggplot() + theme_minimal() + ylab("Emploi salarié (en milliers)") + xlab("") +
  geom_line(aes(x = date, y = value, color = A88, linetype = A88)) +
  scale_color_manual(values = viridis(4)[1:3]) +
  scale_x_date(breaks = seq(1920, 2025, 2) %>% paste0("-01-01") %>% as.Date,
               labels = date_format("%y")) +
  theme(legend.position = c(0.4, 0.7),
        legend.title = element_blank()) +
  scale_y_log10(breaks = seq(5, 3000, 5),
                labels = dollar_format(accuracy = 1, prefix = "", suffix = " K"))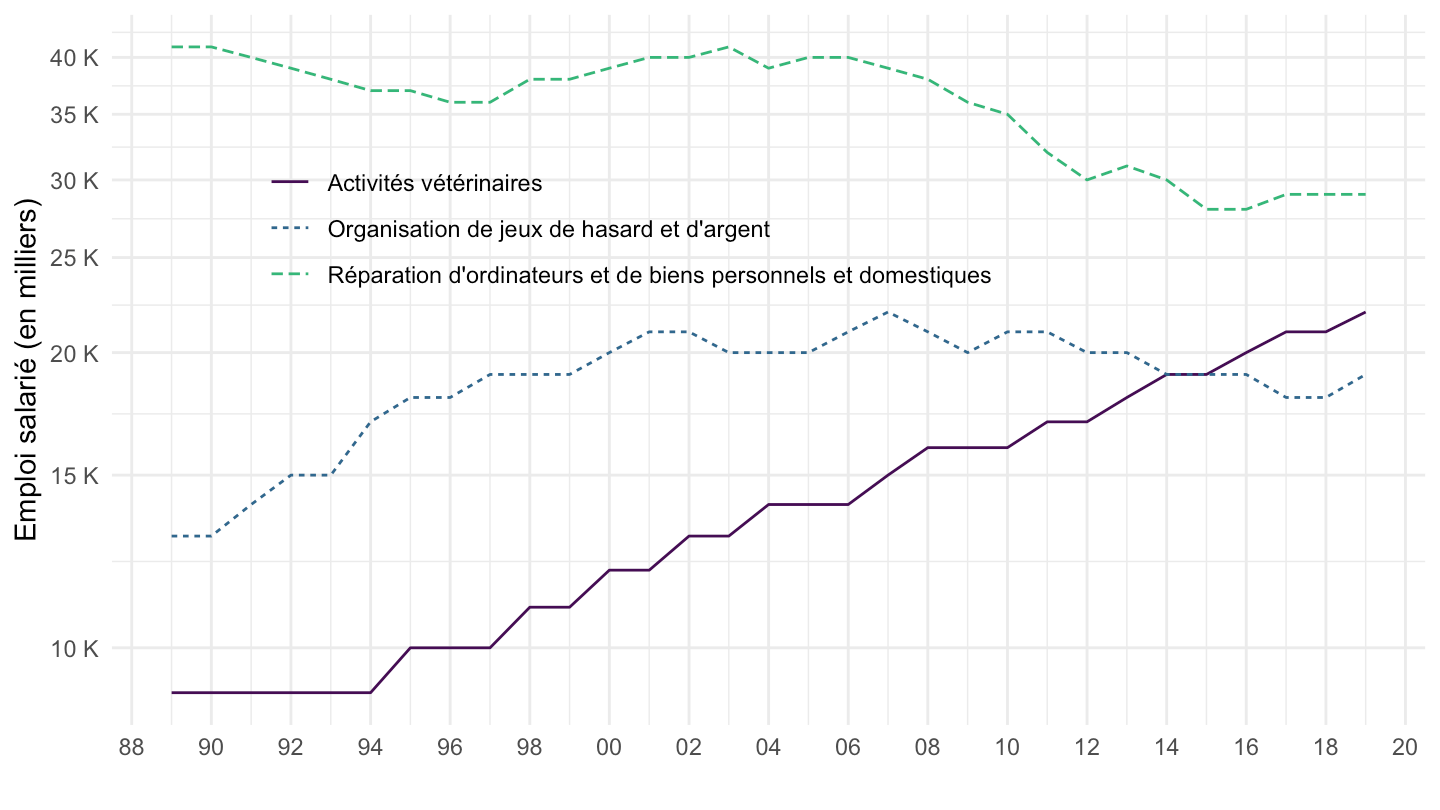
T102B %>%
  filter(a88 %in% c("99", "50", "98")) %>%
  ggplot() + theme_minimal() + ylab("Emploi salarié (en milliers)") + xlab("") +
  geom_line(aes(x = date, y = value, color = A88, linetype = A88)) +
  scale_color_manual(values = viridis(4)[1:3]) +
  scale_x_date(breaks = seq(1920, 2025, 2) %>% paste0("-01-01") %>% as.Date,
               labels = date_format("%y")) +
  theme(legend.position = c(0.6, 0.7),
        legend.title = element_blank()) +
  scale_y_log10(breaks = seq(5, 3000, 1),
                labels = dollar_format(accuracy = 1, prefix = "", suffix = " K"))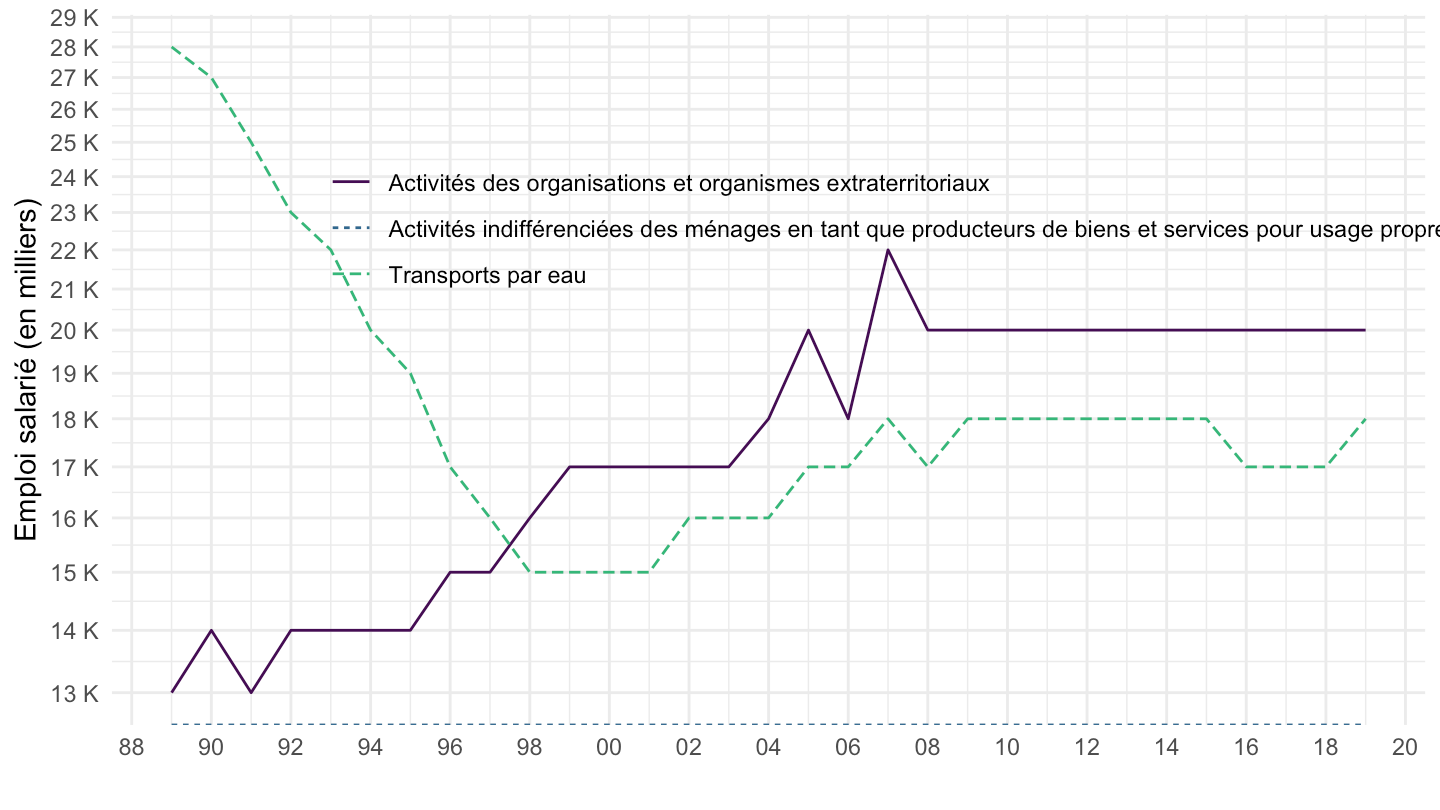
T102B %>%
  mutate(a88 = as.numeric(a88)) %>%
  filter(a88 >= 41, a88 <= 43) %>%
  group_by(a88, A88) %>%
  summarise(Nobs = n(),
            value2018 = value[date == as.Date("2019-01-01")]) %>%
  arrange(-value2018) %>%
{if (is_html_output()) print_table(.) else .}| a88 | A88 | Nobs | value2018 |
|---|---|---|---|
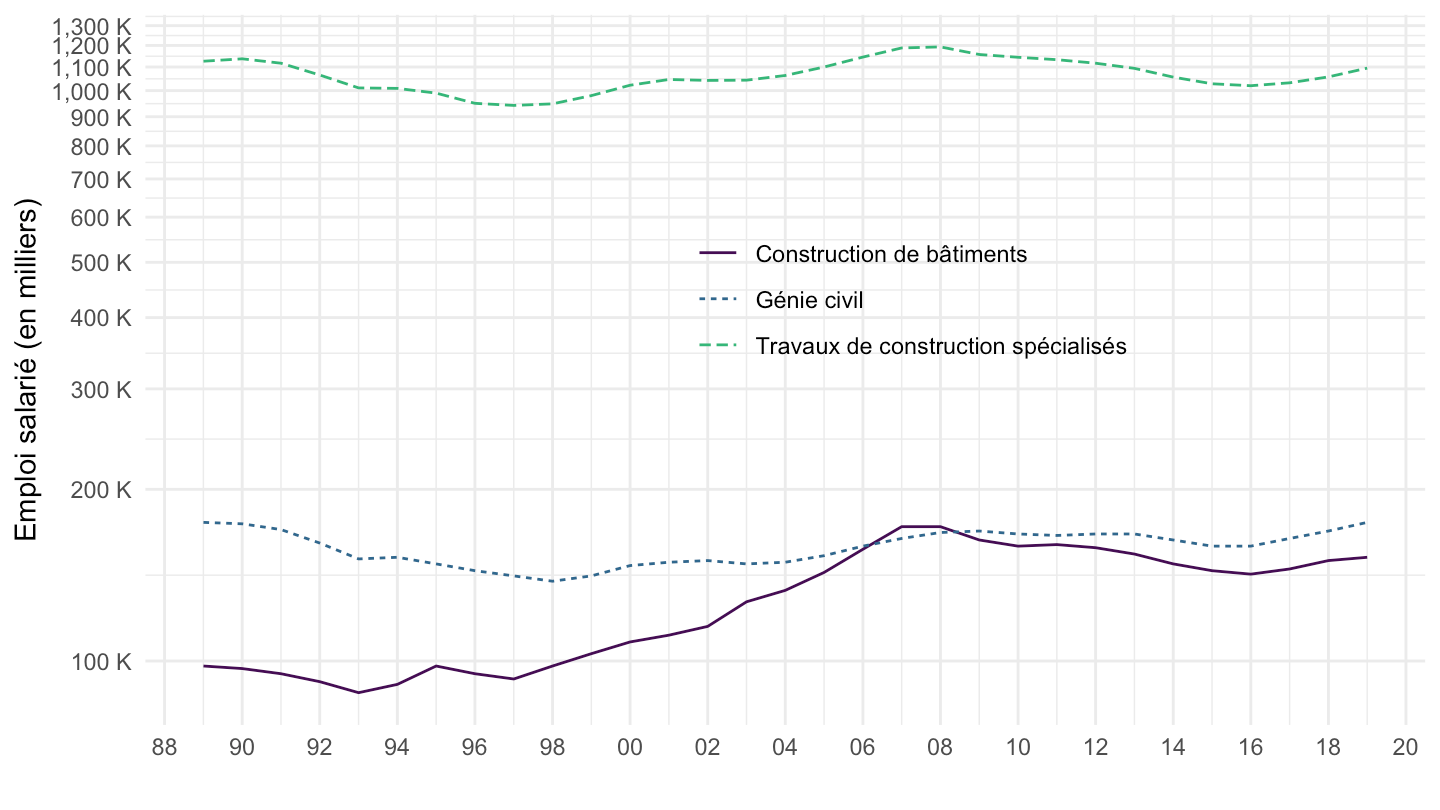
| 43 | Travaux de construction spécialisés | 31 | 1095 |
| 42 | Génie civil | 31 | 175 |
| 41 | Construction de bâtiments | 31 | 152 |
T102B %>%
  filter(a88 %in% c("41", "42", "43")) %>%
  ggplot() + theme_minimal() + ylab("Emploi salarié (en milliers)") + xlab("") +
  geom_line(aes(x = date, y = value, color = A88, linetype = A88)) +
  scale_color_manual(values = viridis(4)[1:3]) +
  scale_x_date(breaks = seq(1920, 2025, 2) %>% paste0("-01-01") %>% as.Date,
               labels = date_format("%y")) +
  theme(legend.position = c(0.6, 0.6),
        legend.title = element_blank()) +
  scale_y_log10(breaks = seq(100, 3000, 100),
                labels = dollar_format(accuracy = 1, prefix = "", suffix = " K"))