Code
SLS2010_IND03 |>
print_table_conditional()
Données - INSEE
Last data update: 13 août 2026, 14:53
Last compile: 05 sept. 2026, 02:55
SLS2010_SM01 |>
print_table_conditional()| date | Durée légale mensuelle (heures) | Salaire minimum brut (horaire) | Salaire minimum brut (mensuel) | Salaire minimum brut (annuel) | Salaire minimum net de prélèvement (mensuel) | Salaire minimum net de prélèvement (annuel) | Coût d'un salarié au Smic (mensuel) | Coût d'un salarié au Smic (annuel) |
|---|---|---|---|---|---|---|---|---|
| 2000-01-01 | 151.67 | 6.31 | 956.53 | 11478.40 | 755.57 | 9066.79 | 1172.33 | 14067.93 |
| 2001-01-01 | 151.67 | 6.54 | 991.90 | 11902.80 | 784.59 | 9415.11 | 1212.50 | 14549.98 |
| 2002-01-01 | 151.67 | 6.75 | 1023.75 | 12285.00 | 810.30 | 9723.58 | 1252.56 | 15030.70 |
| 2003-01-01 | 151.67 | 7.01 | 1063.18 | 12758.20 | 837.79 | 10053.46 | 1291.77 | 15501.21 |
| 2004-01-01 | 151.67 | 7.40 | 1122.33 | 13468.00 | 884.40 | 10612.78 | 1338.61 | 16063.28 |
| 2005-01-01 | 151.67 | 7.82 | 1186.03 | 14232.40 | 932.70 | 11192.36 | 1385.52 | 16626.29 |
| 2006-01-01 | 151.67 | 8.15 | 1236.08 | 14833.00 | 970.33 | 11643.91 | 1428.54 | 17142.50 |
| 2007-01-01 | 151.67 | 8.36 | 1267.18 | 15206.10 | 995.24 | 11942.87 | 1463.33 | 17560.00 |
| 2008-01-01 | 151.67 | 8.61 | 1305.34 | 15664.13 | 1025.22 | 12302.61 | 1507.15 | 18085.81 |
| 2009-01-01 | 151.67 | 8.77 | 1329.36 | 15952.30 | 1044.08 | 12528.94 | 1536.61 | 18439.26 |
| 2010-01-01 | 151.67 | 8.86 | 1343.77 | 16125.20 | 1055.39 | 12664.73 | 1555.14 | 18661.69 |
| 2011-01-01 | 151.67 | 9.02 | 1367.40 | 16408.82 | 1073.96 | 12887.48 | 1581.47 | 18977.61 |
| 2012-01-01 | 151.67 | 9.31 | 1412.02 | 16944.20 | 1107.35 | 13288.18 | 1632.95 | 19595.43 |
SLS2010_SM02 |>
print_table_conditional()SLS2010_TC01 |>
filter(SEXE == "Ensemble") |>
select(1, 4, 5, 6) |>
gather(variable, value, -date) |>
mutate(value = value / 100) |>
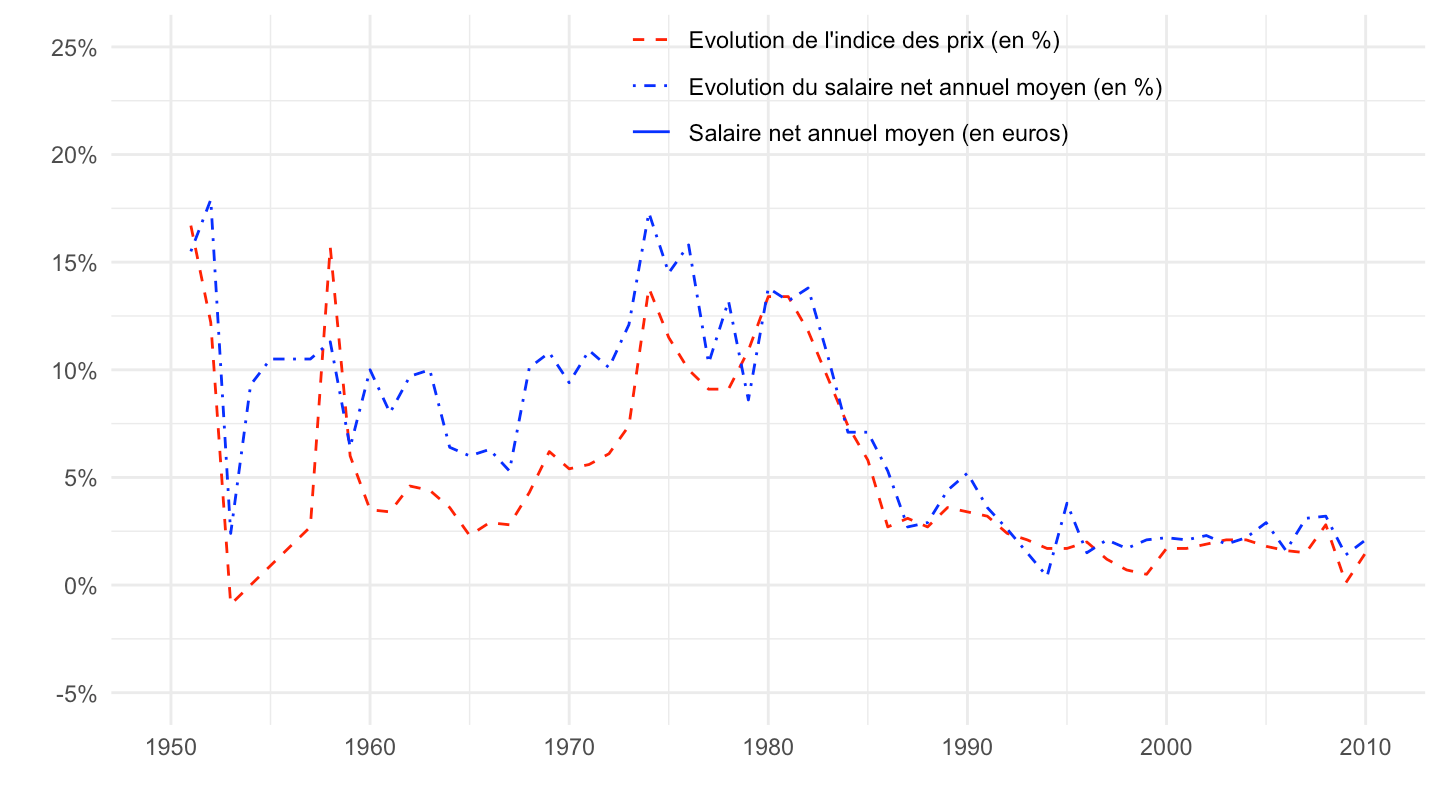
ggplot() + geom_line(aes(x = date, y = value, color = variable, linetype = variable)) +
theme_minimal() + xlab("") + ylab("") +
scale_color_manual(values = c("red", "blue", "blue")) +
scale_linetype_manual(values = c("dashed", "dotdash", "solid")) +
scale_x_date(breaks = seq(1940, 2100, 10) |> paste0("-01-01") |> as.Date(),
labels = date_format("%Y")) +
scale_y_continuous(breaks = 0.01*seq(-100, 500, 5),
labels = percent_format(accuracy = 1),
limits = c(-0.05, 0.25)) +
theme(legend.position = c(0.6, 0.9),
legend.title = element_blank())