Code
VE2 %>%
  group_by(centile) %>%
  summarise(Nobs = n()) %>%
print_table_conditional()Données - INSEE
VE2 %>%
group_by(centile) %>%
summarise(Nobs = n()) %>%
print_table_conditional()VE2 %>%
group_by(variable) %>%
summarise(Nobs = n()) %>%
print_table_conditional()| variable | Nobs |
|---|---|
| Patrimoine brut hors reste | 101 |
| Patrimoine financier | 101 |
| Patrimoine immobilier | 101 |
| Patrimoine professionnel | 101 |
VE2 %>%
  ggplot + geom_line(aes(x = centile, y = value, color = variable)) +
  theme_minimal()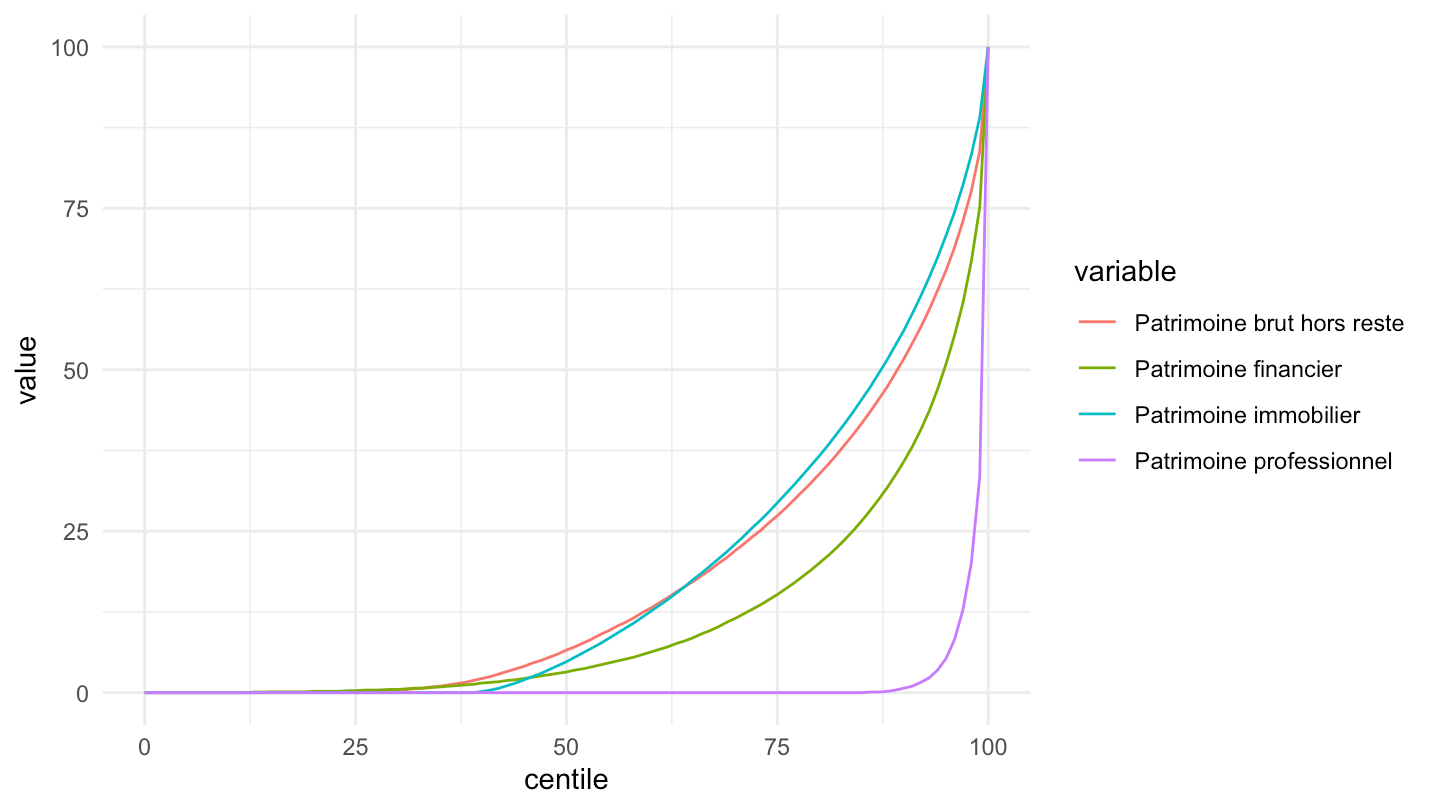
VE2 %>%
  filter(!grepl("brut", variable)) %>%
  mutate(variable = factor(variable, levels = c("Patrimoine immobilier", "Patrimoine financier", "Patrimoine professionnel"))) %>%
  ggplot + geom_line(aes(x = centile/100, y = value/100, color = variable)) +
  theme_minimal() +
  xlab("Part cumulée de la population (%)") + ylab("Part cumulée du patrimoine (%)") +
  scale_x_continuous(breaks = 0.01*seq(0, 100, 20),
                     labels = percent_format(a = 1)) +
  scale_y_continuous(breaks = 0.01*seq(0, 100, 20),
                     labels = percent_format(a = 1)) +
  geom_segment(aes(x = 0, y = 0, xend = 1, yend = 1), linetype = "dashed") +
  theme(legend.title = element_blank()) +
geom_text(aes(x = 0.5, y = 0.55, label = "égalité parfaite"), angle = 45)+ coord_equal(ratio = 1) 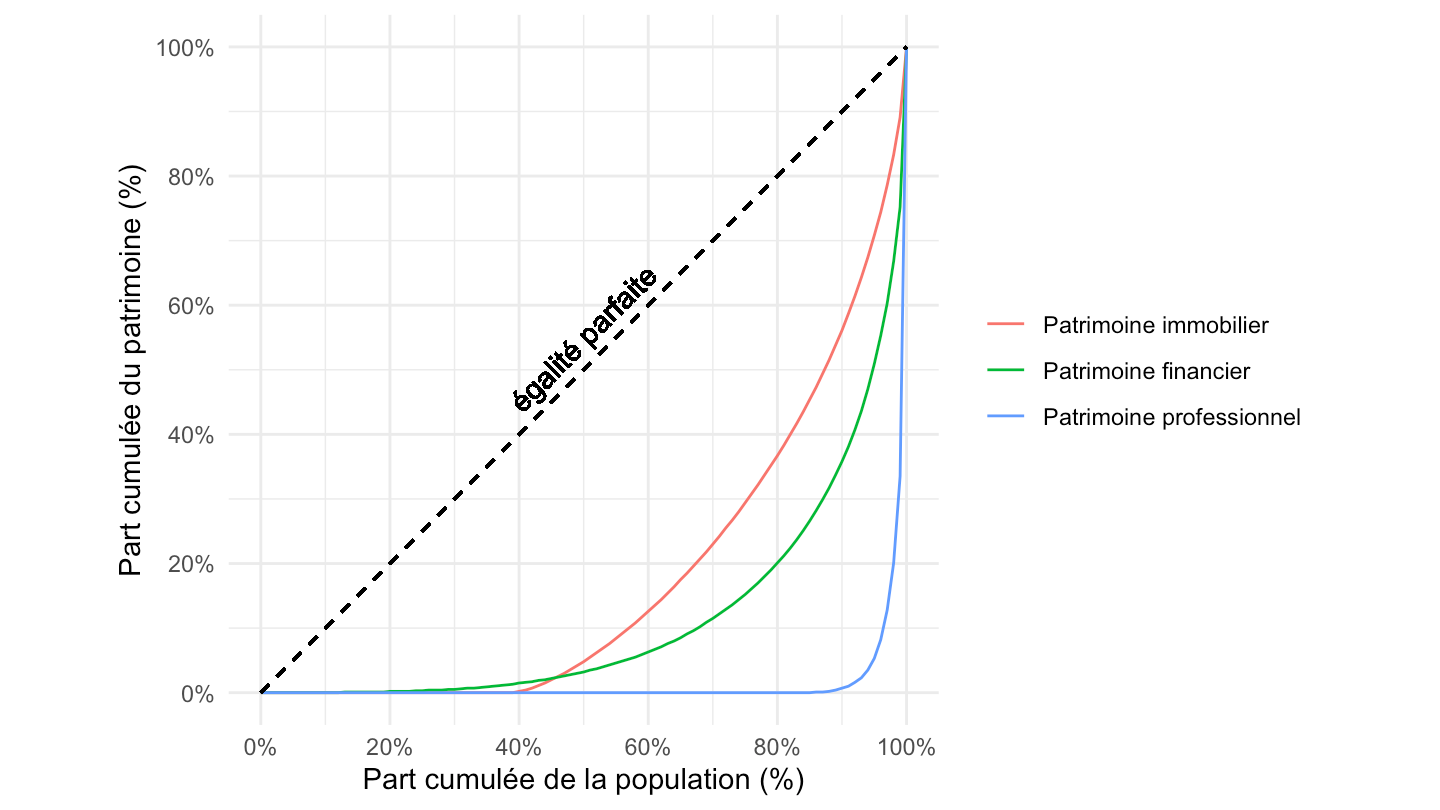
VE2 %>%
  mutate(centile = 1-centile/100,
         value = 1-value/100) %>%
  ggplot + geom_line(aes(x = centile, y = value, color = variable)) +
  theme_minimal()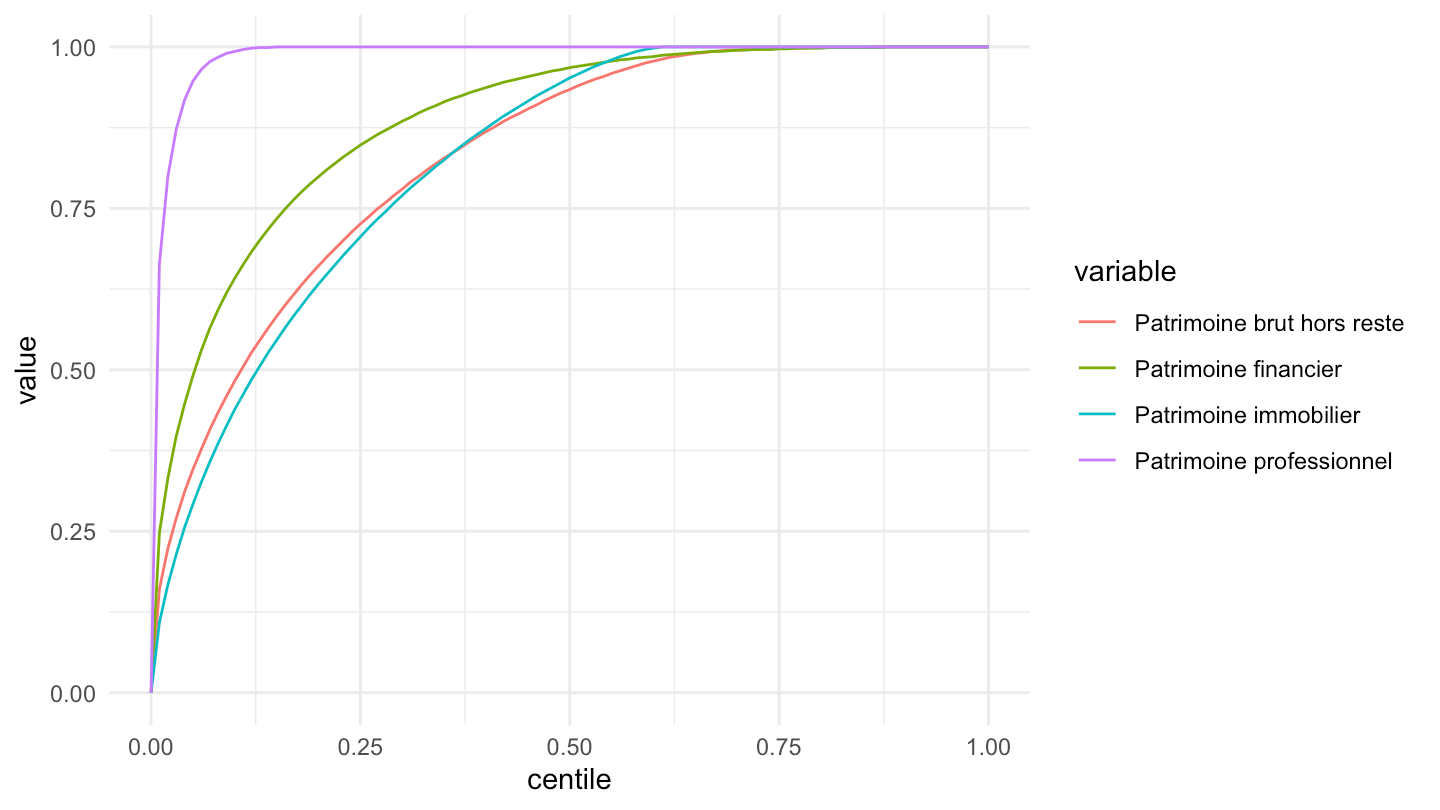
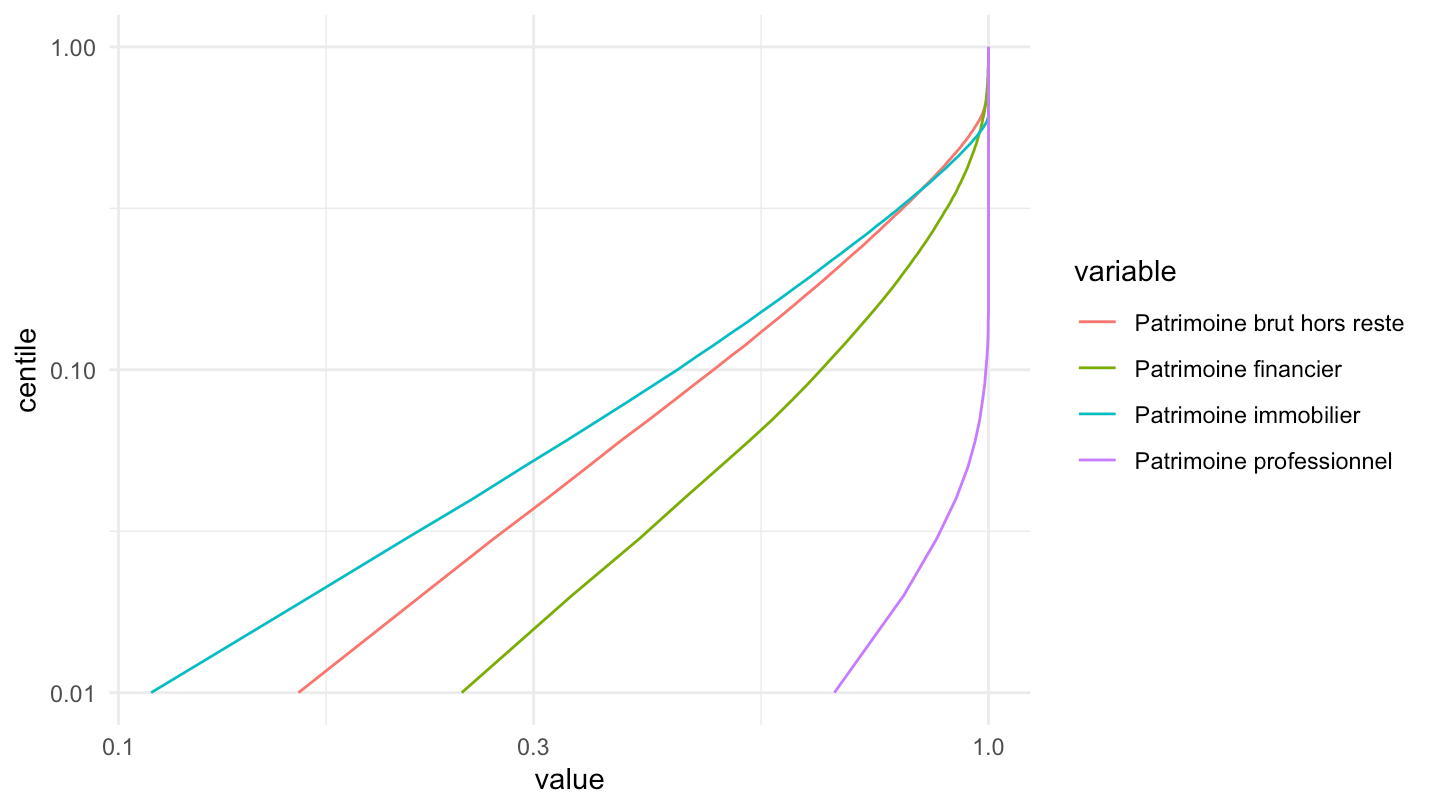
VE2 %>%
  mutate(centile = 1-centile/100,
         value = 1-value/100) %>%
  arrange(centile) %>%
  filter(centile != 0) %>%
  ggplot + geom_line(aes(x = value, y = centile, color = variable)) +
  theme_minimal() +
  scale_x_log10() + scale_y_log10()