
Last observation: 2023 (N = 4)
First observation: 1960 (N = 4)
Last data update: 04 Nov 2026, 12:28
Last compile: 04 Nov 2026, 12:55
F1 |>
  group_by(date) |>
  summarise(Nobs = n()) |>
print_table_conditional()F1 |>
left_join(variable, by = "Variable") |>
group_by(variable, Variable) |>
summarise(Nobs = n()) |>
print_table_conditional()| variable | Variable | Nobs |
|---|---|---|
| PA_RDB | Pouvoir d’achat du RDB | 64 |
| PA_RDB_ARB | Pouvoir d’achat du revenu arbitrable | 64 |
| PA_RDB_ARB_UC | Pouvoir d’achat du revenu arbitrable par UC | 64 |
| PA_RDB_UC | Pouvoir d’achat du RDB par UC | 64 |
ig_b("insee", "RPM2024", "F1", "fig3")
Rouge: 211, 104, 121 ->
Bleu: 69, 100, 156 ->
plot_lineaire <- F1 |>
  left_join(variable, by = "Variable") |>
  filter(variable %in% c("PA_RDB", "PA_RDB_UC")) |>
  ggplot(aes(x = date, y = value, color = Variable)) + geom_line(size = 1.5) +
  theme_minimal() + xlab("") + ylab("") +
  scale_x_date(breaks = seq(1960, 2100, 7) |> paste0("-01-01") |> as.Date(),
               labels = date_format("%Y")) +
  scale_y_continuous(breaks = seq(100, 1000, 100)) +
  scale_color_manual(values = c("#45639c", "#d3687a")) +
  theme(legend.title = element_blank(),
        panel.grid.major.x = element_blank(),
        panel.grid.minor.x = element_blank(),
        panel.grid.minor.y = element_blank(),
        legend.position = "top") +
  labs(subtitle = "Échelle linéaire")

plot_lineaire
plot_log <- plot_lineaire + scale_y_log10(breaks = seq(100, 1000, 100)) +
  labs(subtitle = "Échelle logarithmique")

plot_log
ggpubr::ggarrange(plot_lineaire, plot_log, common.legend = T)
plot_lineaire_2025 <- F1_2025 |>
  left_join(variable, by = "Variable") |>
  filter(variable %in% c("PA_RDB", "PA_RDB_UC")) |>
  ggplot(aes(x = date, y = value, color = Variable)) + geom_line(size = 1.5) +
  theme_minimal() + xlab("") + ylab("") +
  scale_x_date(breaks = seq(1960, 2100, 10) |> paste0("-01-01") |> as.Date(),
               labels = date_format("%Y")) +
  scale_y_continuous(breaks = seq(100, 1000, 100)) +
  scale_color_manual(values = c("#45639c", "#d3687a")) +
  theme(legend.title = element_blank(),
        panel.grid.major.x = element_blank(),
        panel.grid.minor.x = element_blank(),
        panel.grid.minor.y = element_blank(),
        legend.position = "top") +
  labs(subtitle = "Échelle linéaire")

plot_lineaire_2025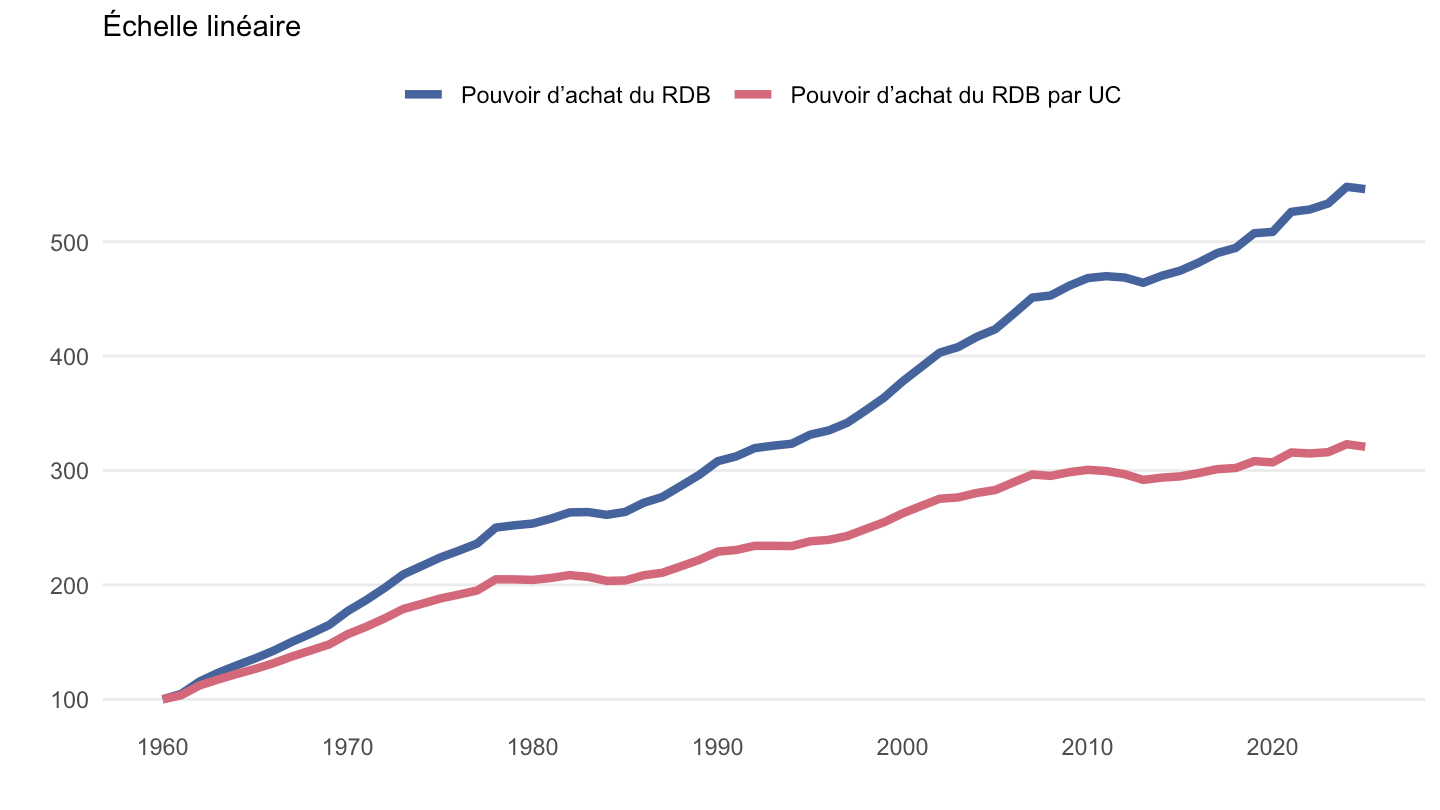
plot_log_2025 <- plot_lineaire_2025 + scale_y_log10(breaks = seq(100, 1000, 100)) +
  labs(subtitle = "Échelle logarithmique")

plot_log_2025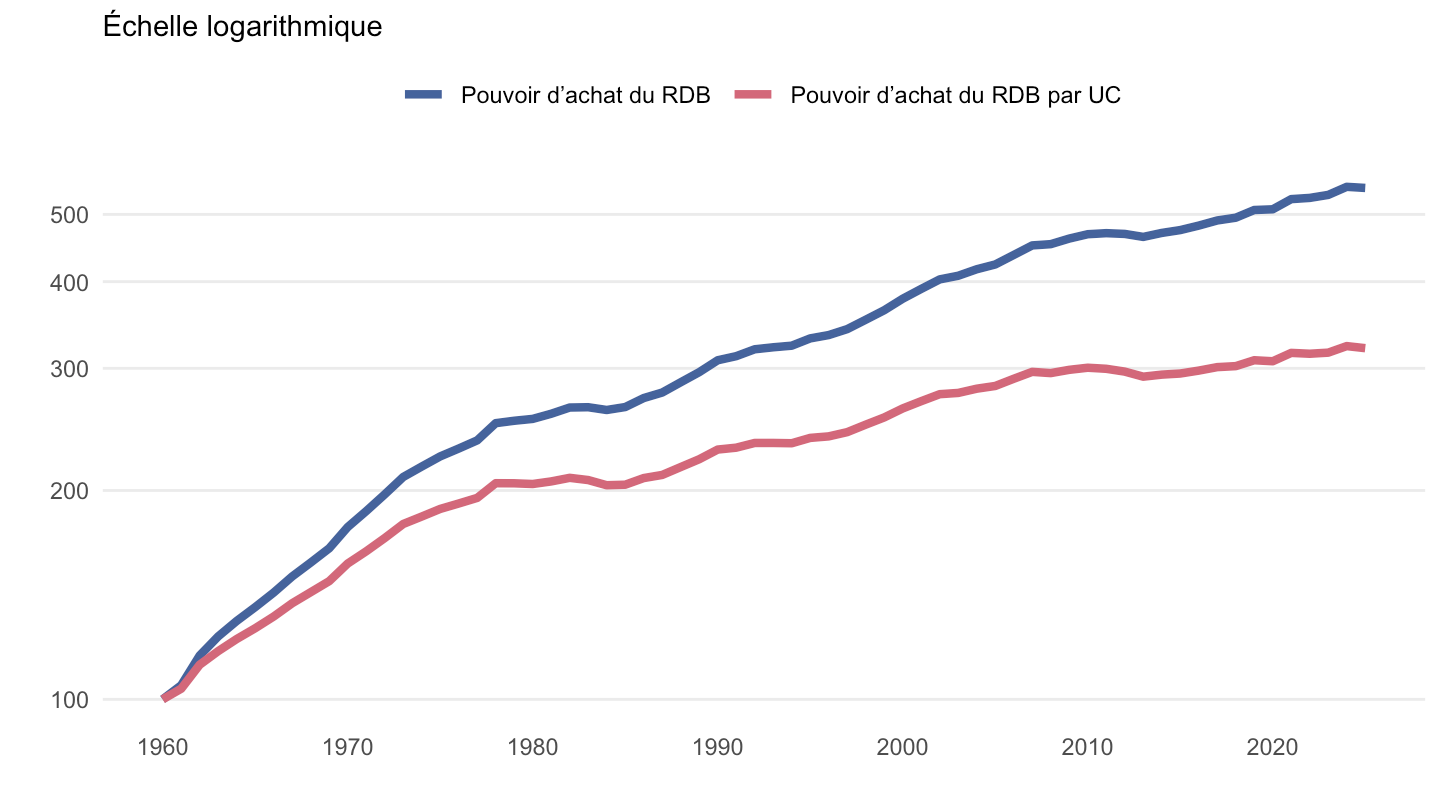
ggpubr::ggarrange(plot_lineaire_2025, plot_log_2025, common.legend = T)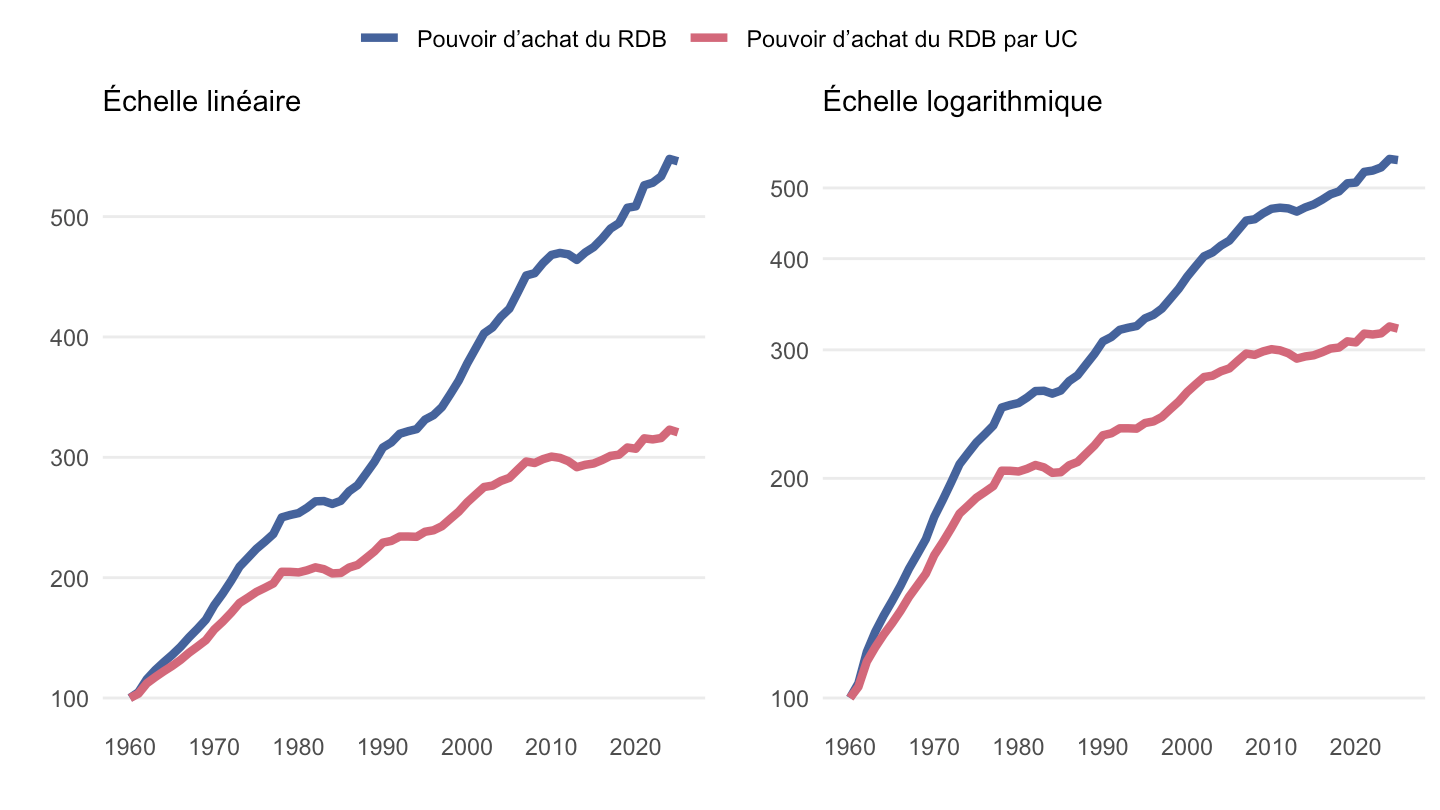
| source | dataset | Title | Updated |
|---|---|---|---|

