Code
`IPS-2015-SERVICES` %>%
  group_by(LAST_UPDATE) %>%
  summarise(Nobs = n()) %>%
  arrange(-Nobs) %>%
print_table_conditional()| LAST_UPDATE | Nobs |
|---|---|
| 2024-02-29 | 102152 |
Données - INSEE
`IPS-2015-SERVICES` %>%
group_by(LAST_UPDATE) %>%
summarise(Nobs = n()) %>%
arrange(-Nobs) %>%
print_table_conditional()| LAST_UPDATE | Nobs |
|---|---|
| 2024-02-29 | 102152 |
`IPS-2015-SERVICES` %>%
  left_join(CORRECTION, by = "CORRECTION") %>%
  group_by(CORRECTION, Correction) %>%
  summarise(Nobs = n()) %>%
  arrange(-Nobs) %>%
print_table_conditional()| CORRECTION | Correction | Nobs |
|---|---|---|
| BRUT | Non corrigé | 51076 |
| CVS-CJO | Corrigé des variations saisonnières et du nombre de jours ouvrables | 51076 |
`IPS-2015-SERVICES` %>%
  left_join(NAF2, by = "NAF2") %>%
  group_by(NAF2, Naf2) %>%
  summarise(Nobs = n()) %>%
  arrange(-Nobs) %>%
print_table_conditional()`IPS-2015-SERVICES` %>%
filter(nchar(NAF2) == 2) %>%
left_join(NAF2, by = "NAF2") %>%
group_by(NAF2, Naf2) %>%
summarise(Nobs = n()) %>%
arrange(-Nobs) %>%
print_table_conditional()`IPS-2015-SERVICES` %>%
group_by(IDBANK, TITLE_FR) %>%
summarise(Nobs = n()) %>%
arrange(-Nobs) %>%
print_table_conditional()`IPS-2015-SERVICES` %>%
group_by(TIME_PERIOD) %>%
summarise(Nobs = n()) %>%
arrange(desc(TIME_PERIOD)) %>%
print_table_conditional()`IPS-2015-SERVICES` %>%
filter(NAF2 %in% c("H", "I", "J"),
CORRECTION == "CVS-CJO") %>%
left_join(NAF2, by = "NAF2") %>%
select_if(function(col) length(unique(col)) > 1) %>%
month_to_date %>%
group_by(Naf2) %>%
mutate(OBS_VALUE = 100*OBS_VALUE/OBS_VALUE[date == as.Date("2005-03-01")]) %>%
ggplot() + ylab("Indice de Production dans les Services") + xlab("") + theme_minimal() +
geom_line(aes(x = date, y = OBS_VALUE, color = Naf2)) +
scale_color_manual(values = viridis(4)[1:3]) +
scale_x_date(breaks = seq(1920, 2025, 2) %>% paste0("-01-01") %>% as.Date,
labels = date_format("%y")) +
theme(legend.position = c(0.25, 0.8),
legend.title = element_blank()) +
scale_y_log10(breaks = seq(-60, 300, 10))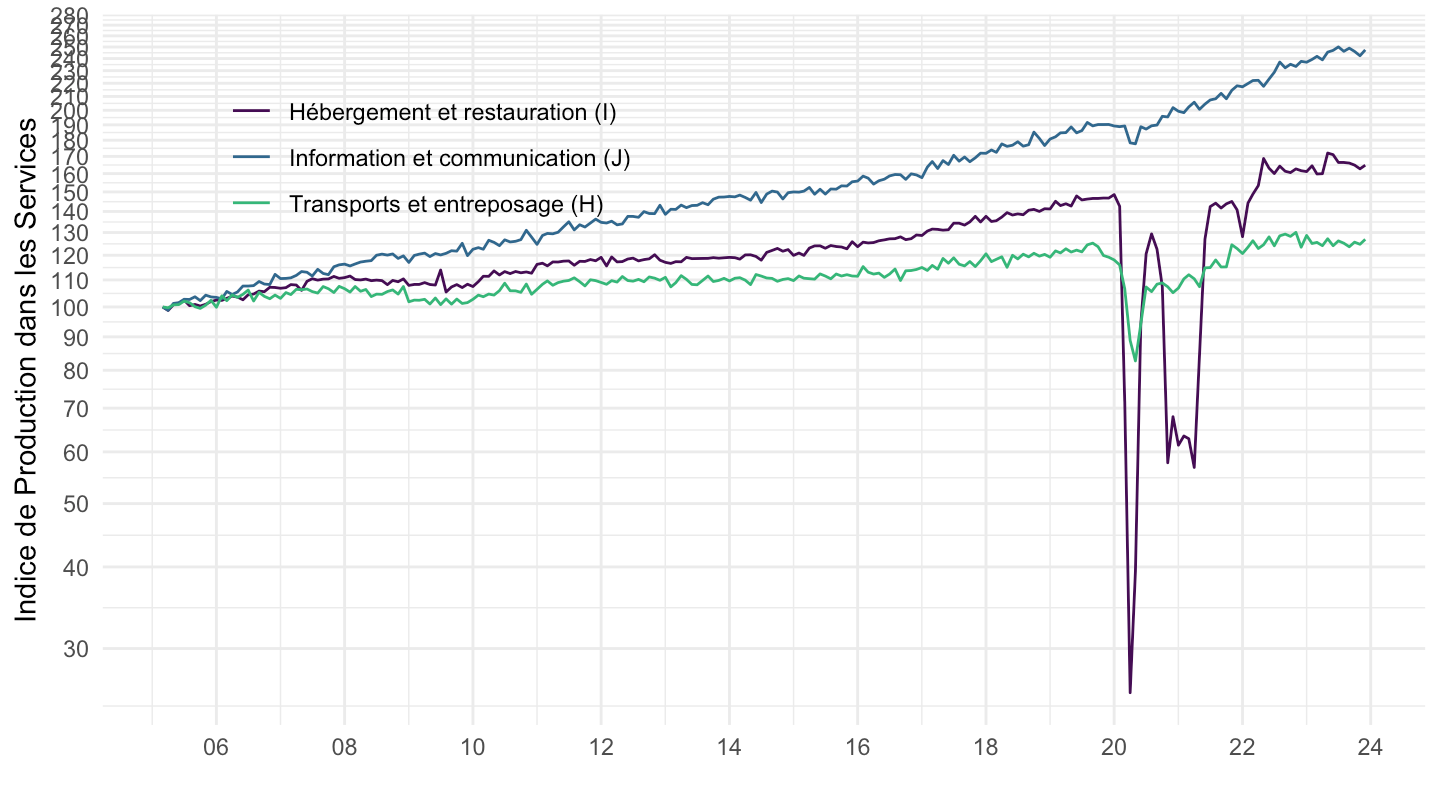
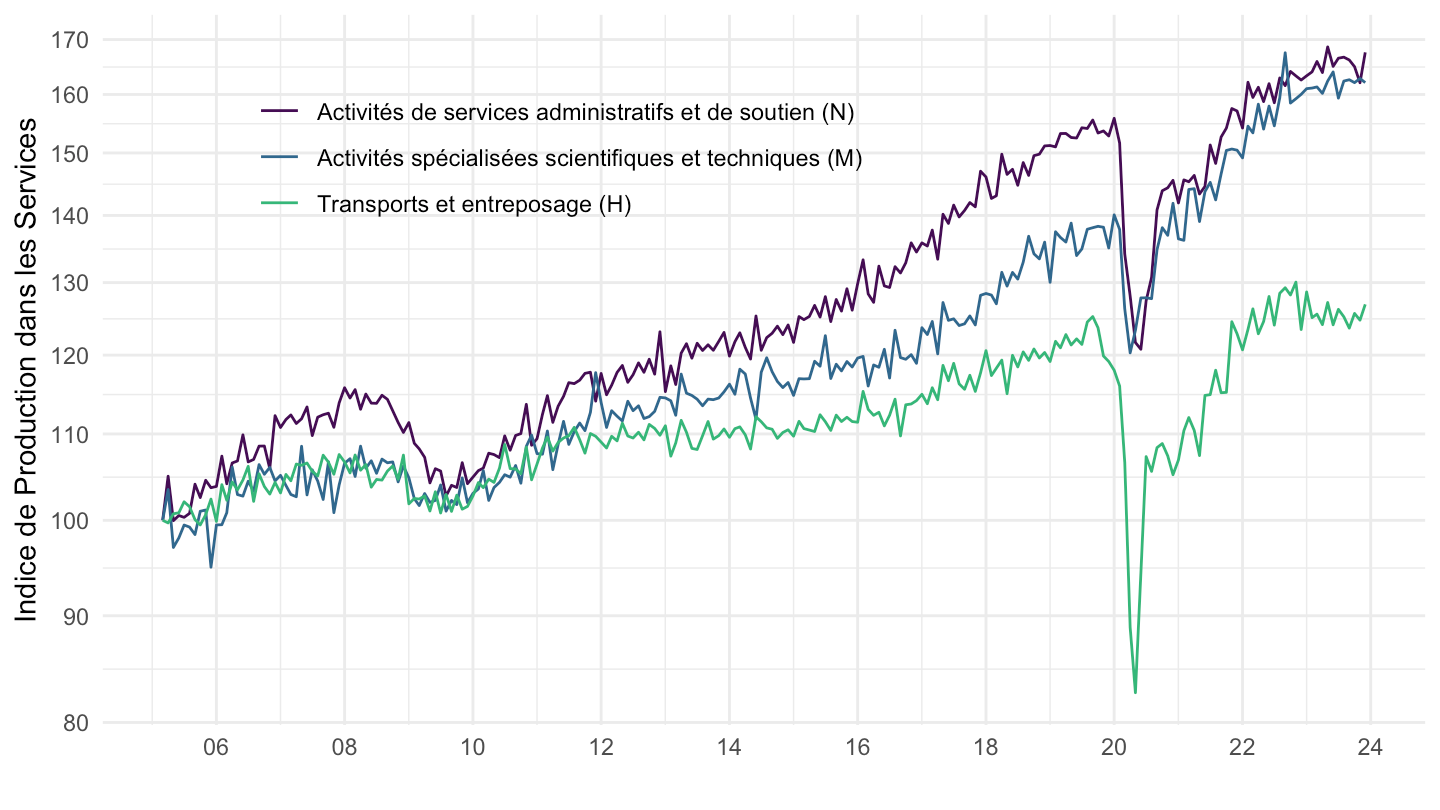
`IPS-2015-SERVICES` %>%
  filter(NAF2 %in% c("H", "M", "N"),
         CORRECTION == "CVS-CJO") %>%
  left_join(NAF2, by = "NAF2") %>%
  select_if(function(col) length(unique(col)) > 1) %>%
  month_to_date %>%
  group_by(Naf2) %>%
  mutate(OBS_VALUE = 100*OBS_VALUE/OBS_VALUE[date == as.Date("2005-03-01")]) %>%
  ggplot() + ylab("Indice de Production dans les Services") + xlab("") + theme_minimal() +
  geom_line(aes(x = date, y = OBS_VALUE, color = Naf2)) +
  scale_color_manual(values = viridis(4)[1:3]) +
  scale_x_date(breaks = seq(1920, 2025, 2) %>% paste0("-01-01") %>% as.Date,
               labels = date_format("%y")) +
  theme(legend.position = c(0.35, 0.8),
        legend.title = element_blank()) +
  scale_y_log10(breaks = seq(-60, 300, 10))