Last data update: 17 sept. 2026, 22:35
Last compile: 08 oct. 2026, 01:27
fig1 |>
  select(annee, `Constructions (murs)` = constructions, `Terrains bâtis (foncier)` = terrains_batis,
         `Autres actifs non financiers` = autres_anf, `Patrimoine financier net` = patrimoine_financier_net) |>
  pivot_longer(-annee, names_to = "composante", values_to = "contribution") |>
  ggplot(aes(x = annee, y = contribution, fill = composante)) +
  geom_col() +
  geom_line(data = fig1, aes(x = annee, y = patrimoine_pct), inherit.aes = FALSE, linewidth = 1) +
  geom_hline(yintercept = 0, color = "grey40", linewidth = 0.4) +
  scale_fill_brewer(palette = "Set2", name = NULL) +
  theme_minimal(base_size = 13) +
  labs(x = NULL, y = "%",
       title = "Évolution du patrimoine économique national et contributions",
       subtitle = "la ligne noire est l'évolution totale du patrimoine (%) ; les barres, la contribution de chaque composante") +
  theme(legend.position = "bottom",
        panel.grid.minor = element_blank())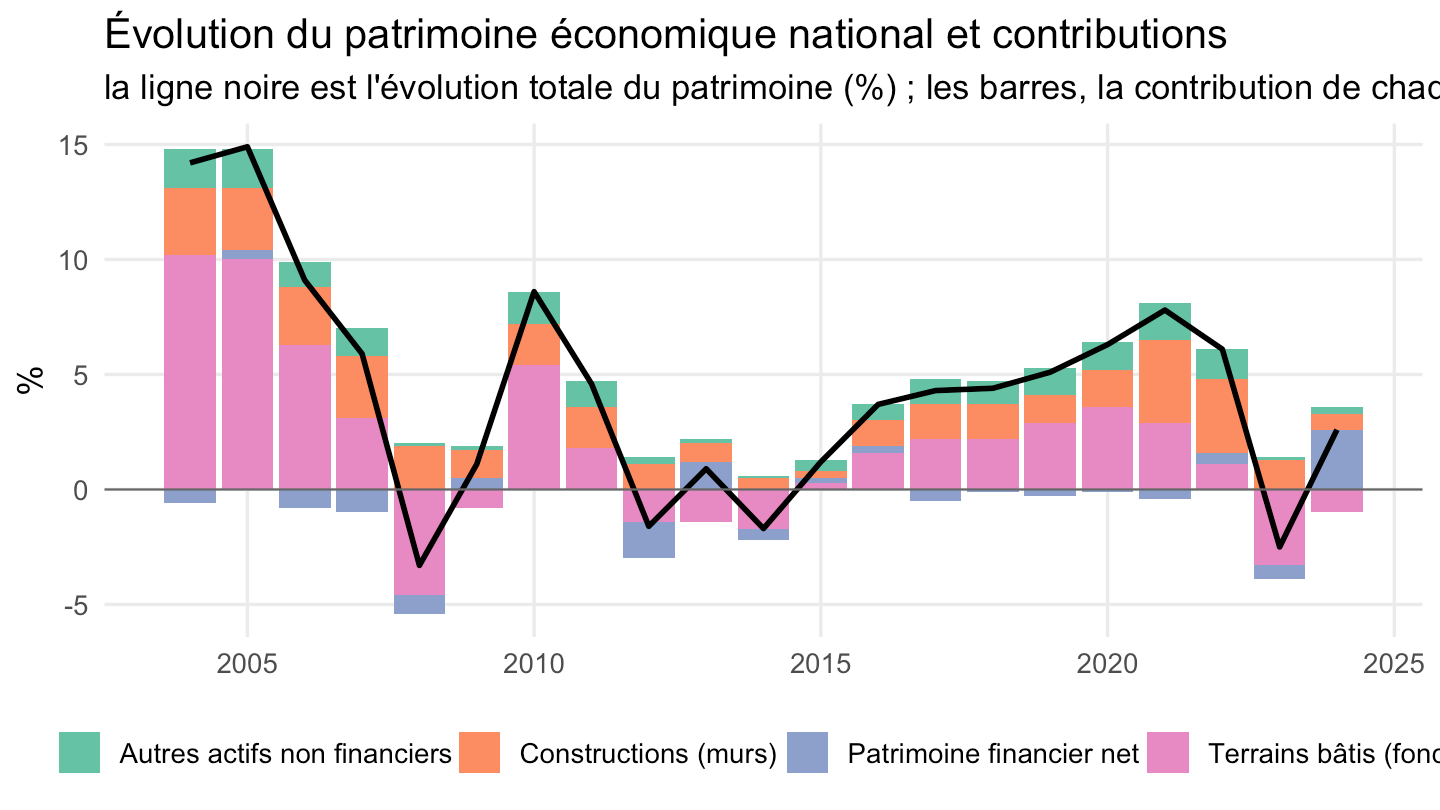
fig2 |>
  filter(agregat, poste != "Fonds propres³ = (Patrimoine net) + (Passif en actions)") |>
  mutate(poste = str_remove(poste, " ?= ?\\(.*"), poste = str_remove(poste, " ?\\(.*\\)"),
         poste = fct_reorder(poste, ensemble)) |>
  select(poste, Ménages = menages, `Sociétés non financières` = societes_non_financieres,
         `Sociétés financières` = societes_financieres, `Administrations publiques` = administrations_publiques) |>
  pivot_longer(-poste, names_to = "secteur", values_to = "montant") |>
  ggplot(aes(x = poste, y = montant, fill = secteur)) +
  geom_col(position = position_dodge(width = 0.8), width = 0.7) +
  geom_hline(yintercept = 0, color = "grey40", linewidth = 0.4) +
  coord_flip() +
  scale_fill_brewer(palette = "Set2", name = NULL) +
  theme_minimal(base_size = 11) +
  labs(x = NULL, y = "Milliards d'euros",
       title = "Patrimoine des secteurs institutionnels, fin 2024",
       subtitle = "agrégats principaux, par secteur") +
  theme(legend.position = "bottom",
        panel.grid.minor = element_blank(),
        panel.grid.major.y = element_blank())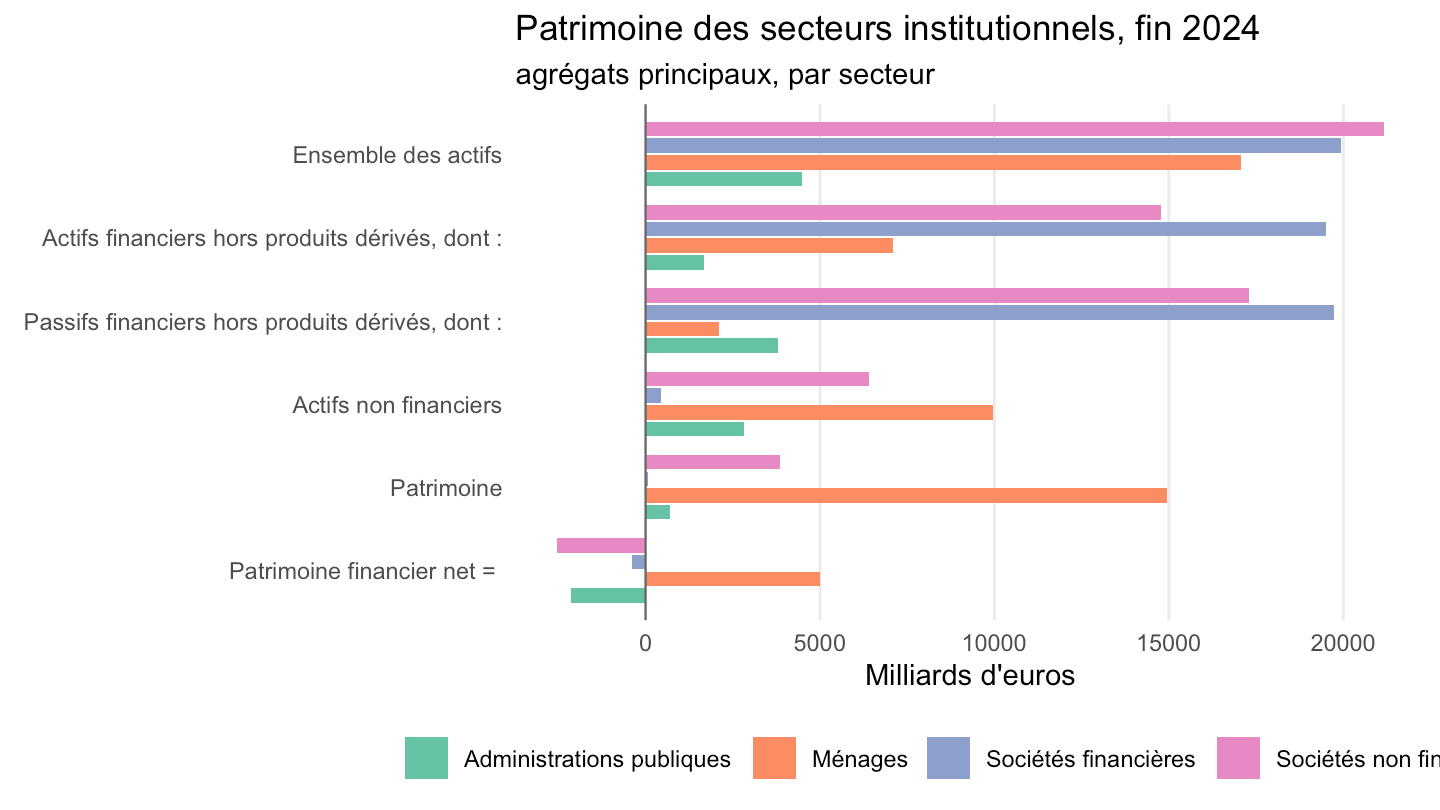
fig3 |>
  filter(secteur != "Patrimoine économique national") |>
  mutate(secteur = fct_reorder(secteur, ensemble_pct)) |>
  ggplot(aes(x = secteur, y = ensemble_pct)) +
  geom_col(fill = "#1B3F8B") +
  geom_text(aes(label = paste0(ensemble_pct, "%")), hjust = -0.15, size = 4) +
  coord_flip(clip = "off") +
  scale_y_continuous(expand = expansion(mult = c(0, 0.12))) +
  theme_minimal(base_size = 13) +
  labs(x = NULL, y = NULL,
       title = "Répartition du patrimoine économique national",
       subtitle = "par secteur institutionnel, fin 2024") +
  theme(panel.grid.minor = element_blank(),
        panel.grid.major.y = element_blank())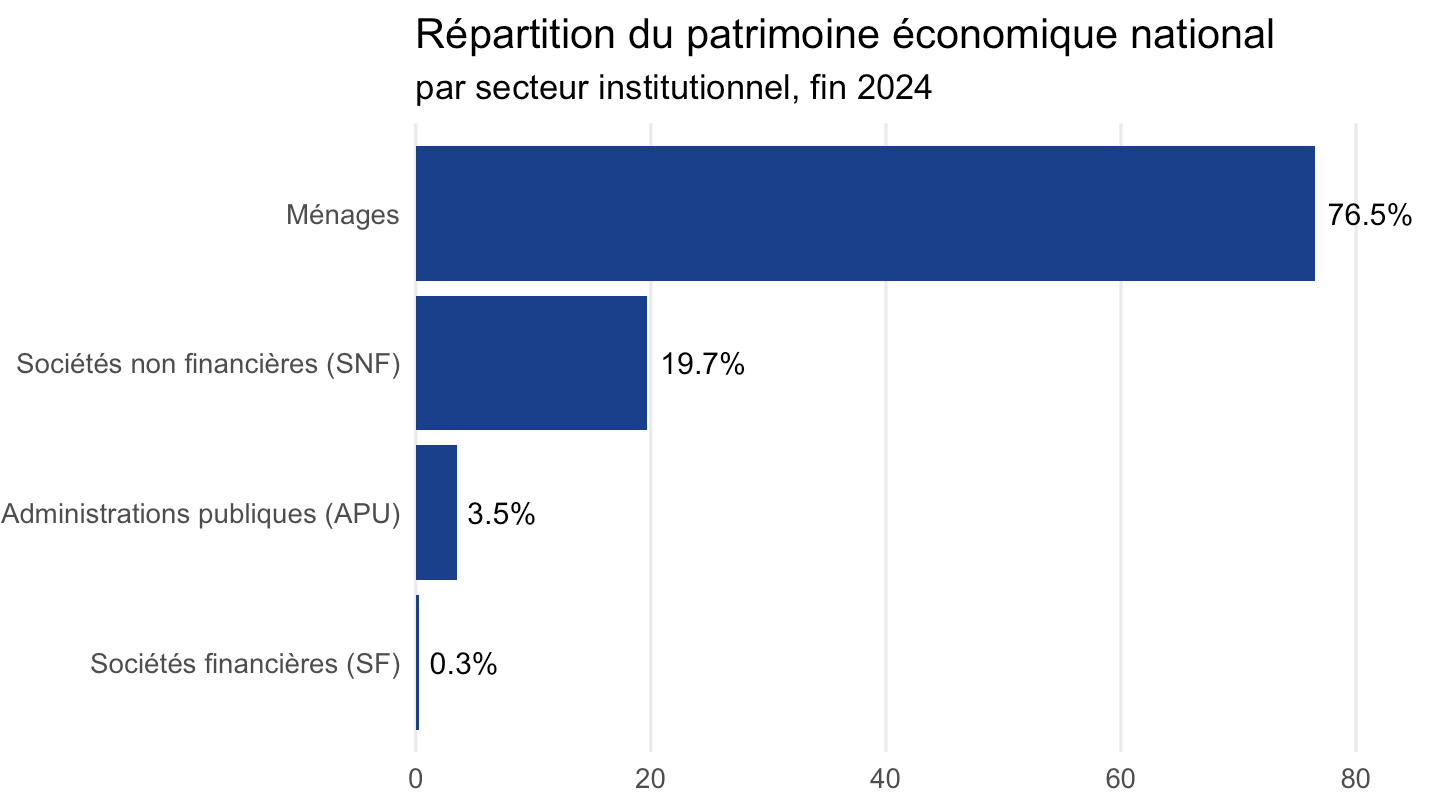
fig4 |>
  filter(agregat, poste != "Fonds propres³ des sociétés") |>
  mutate(poste = str_remove(poste, " ?\\(.*"), poste = str_remove(poste, "²|³")) |>
  ggplot(aes(x = poste, y = `2024_2023`, fill = secteur)) +
  geom_col(position = position_dodge(width = 0.8), width = 0.7) +
  geom_hline(yintercept = 0, color = "grey40", linewidth = 0.4) +
  coord_flip() +
  scale_fill_brewer(palette = "Set2", name = NULL) +
  theme_minimal(base_size = 11) +
  labs(x = NULL, y = "Évolution 2024/2023 (%)",
       title = "Évolution du patrimoine des secteurs institutionnels",
       subtitle = "agrégats principaux, par secteur") +
  theme(legend.position = "bottom",
        panel.grid.minor = element_blank(),
        panel.grid.major.y = element_blank())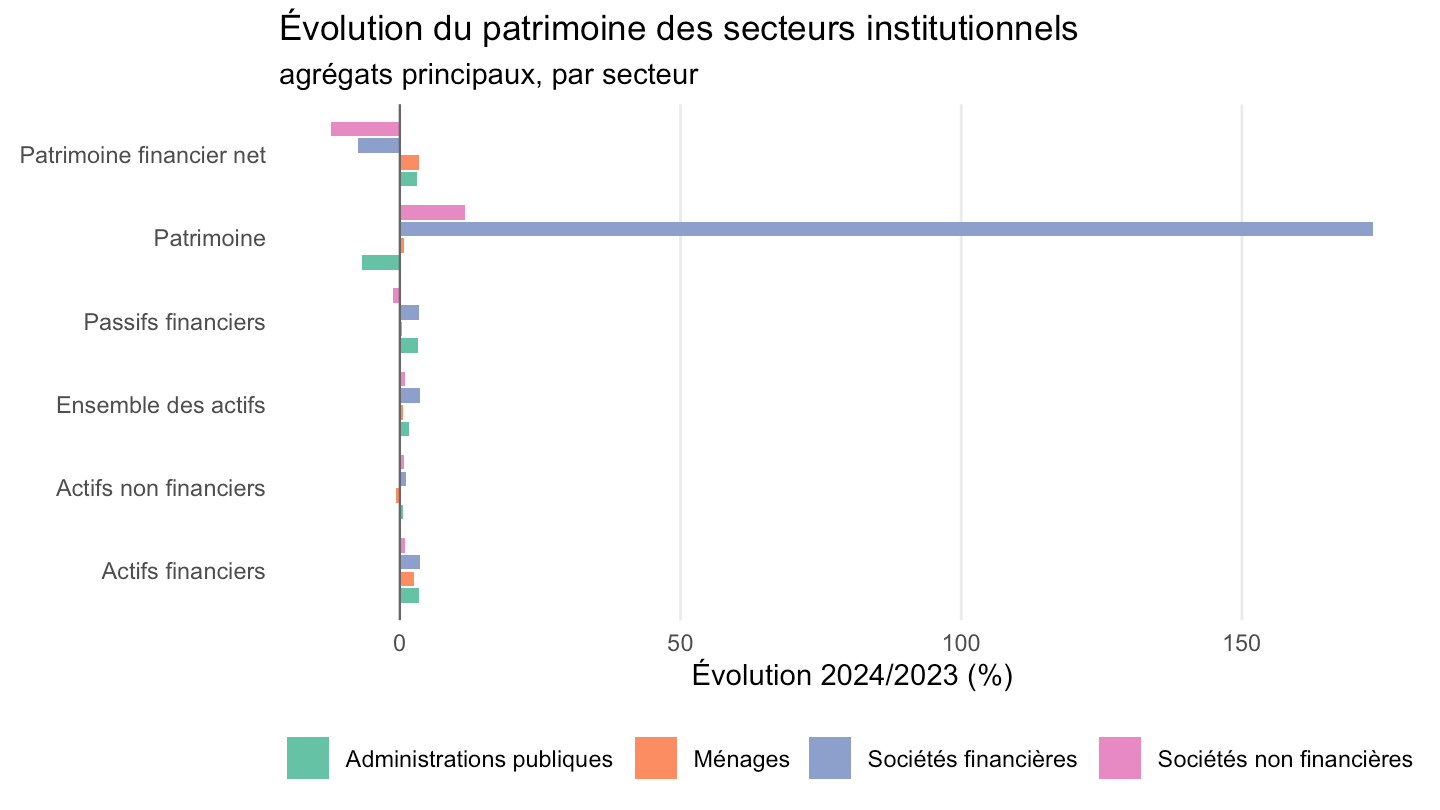
fig_encadre |>
  rename(`Assurance-vie` = assurance_vie, `Droits à pension` = droits_a_pension) |>
  pivot_longer(-annee, names_to = "type", values_to = "montant") |>
  ggplot(aes(x = annee, y = montant, fill = type)) +
  geom_col(position = "stack") +
  scale_fill_manual(values = c("Assurance-vie" = "#1B3F8B", "Droits à pension" = "#E8737A"), name = NULL) +
  theme_minimal(base_size = 13) +
  labs(x = NULL, y = "Milliards d'euros",
       title = "Encours de droits à pension et d'assurance-vie au sein des fonds de pension",
       subtitle = "2004-2024") +
  theme(legend.position = "bottom",
        panel.grid.minor = element_blank())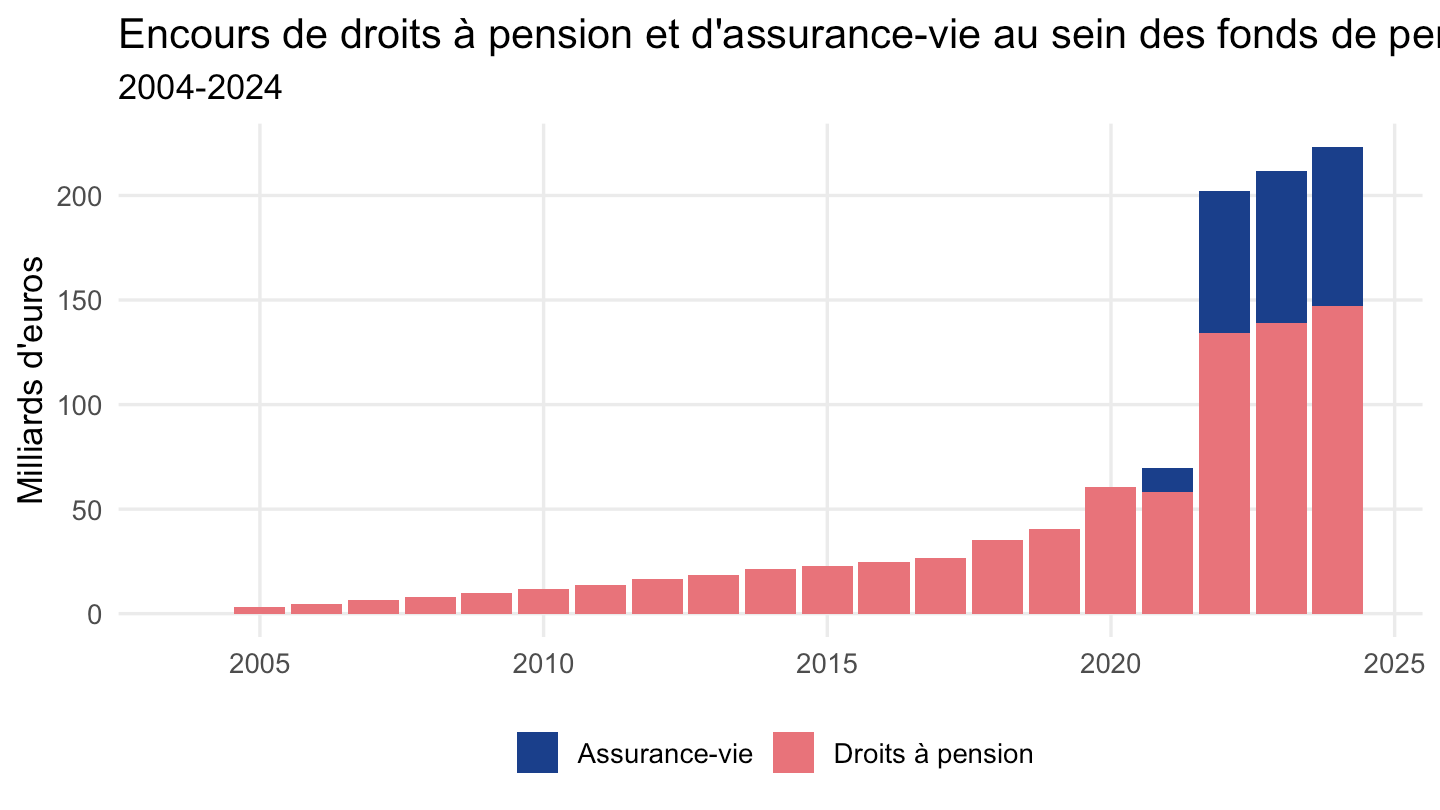
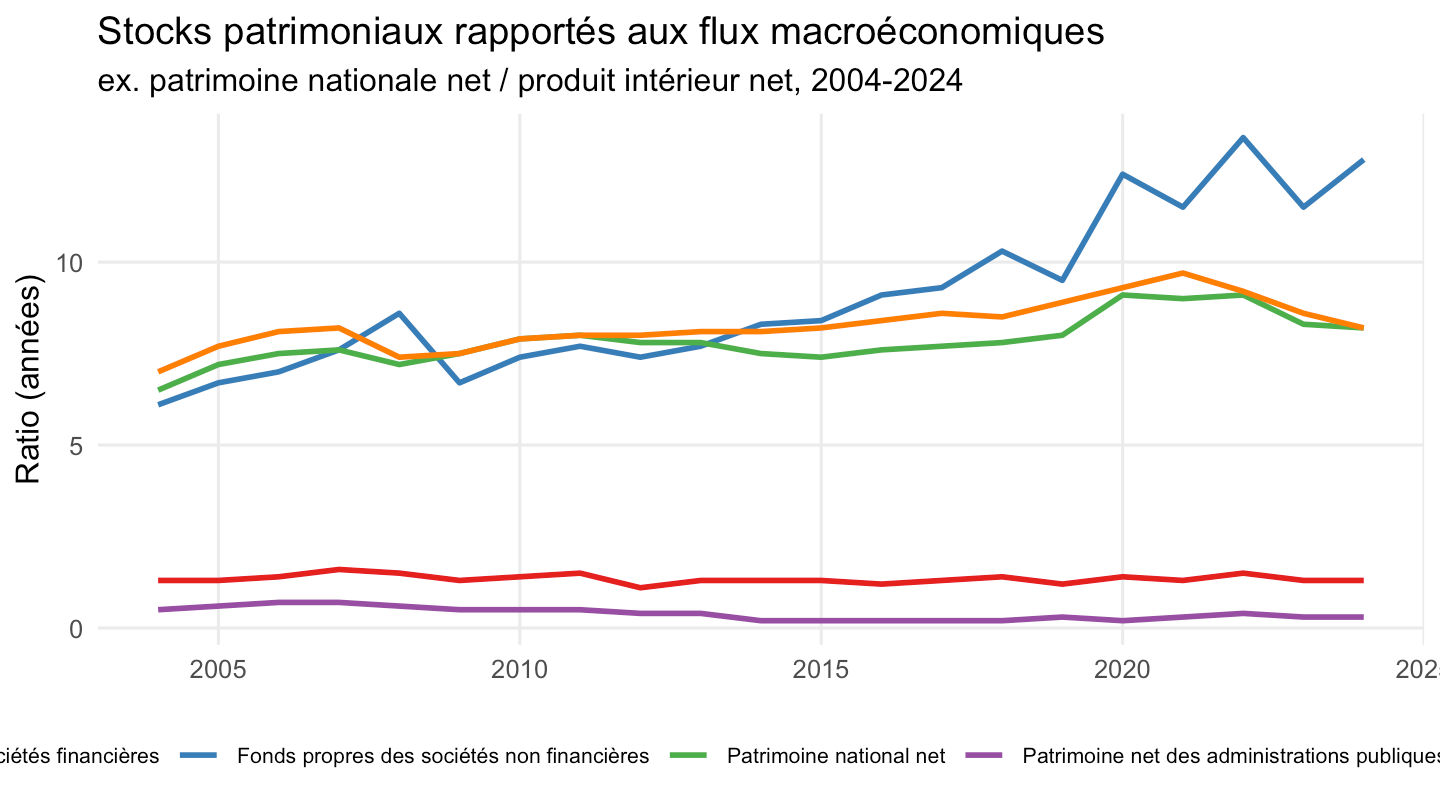
tc |>
  filter(section == "Ratio") |>
  mutate(agregat = str_remove(agregat, " / .*")) |>
  ggplot(aes(x = annee, y = value, color = agregat)) +
  geom_line(linewidth = 1) +
  scale_color_brewer(palette = "Set1", name = NULL) +
  theme_minimal(base_size = 12) +
  labs(x = NULL, y = "Ratio (années)",
       title = "Stocks patrimoniaux rapportés aux flux macroéconomiques",
       subtitle = "ex. patrimoine nationale net / produit intérieur net, 2004-2024") +
  theme(legend.position = "bottom",
        legend.text = element_text(size = 8),
        panel.grid.minor = element_blank())