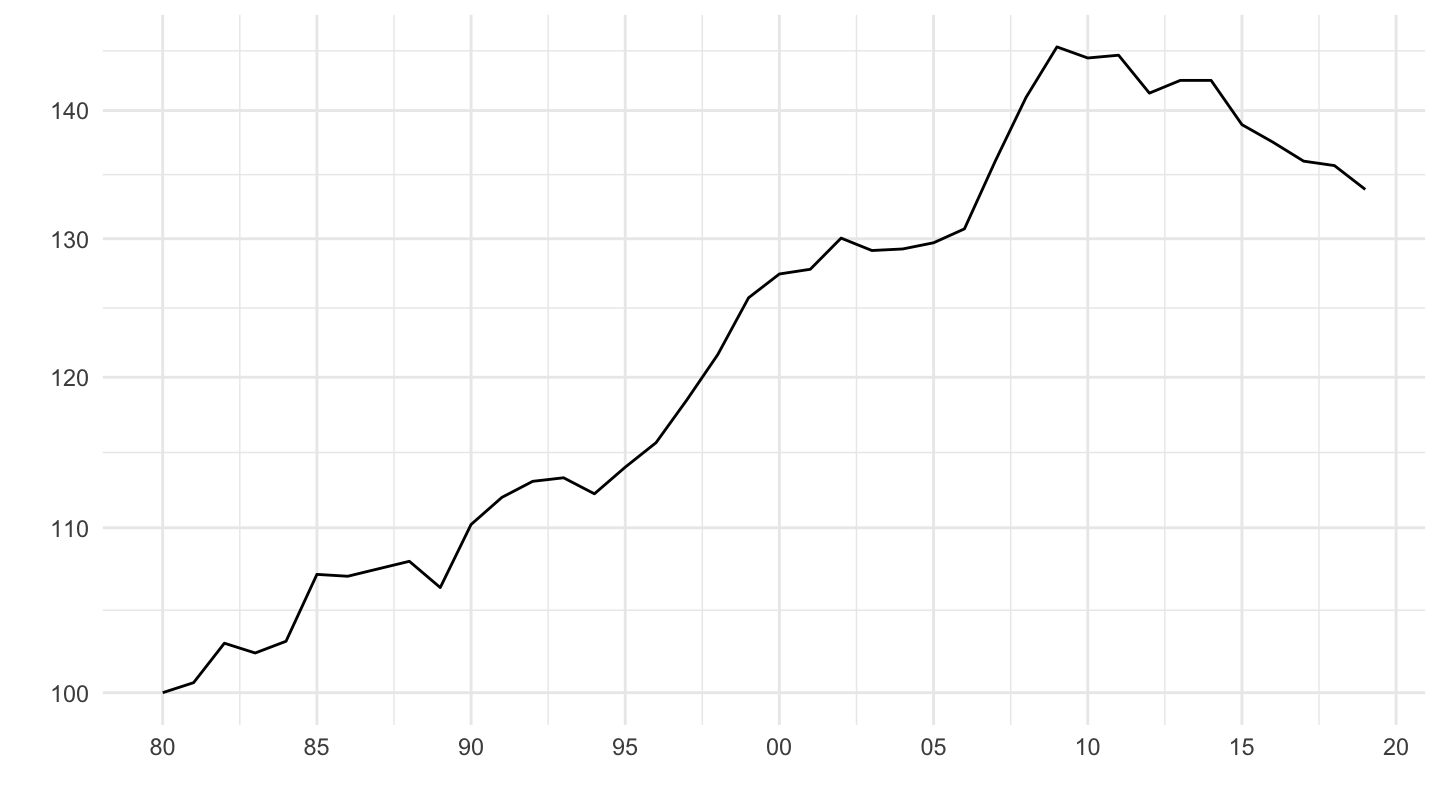
FPS2020 %>%
filter(sheet == "Figure 3",
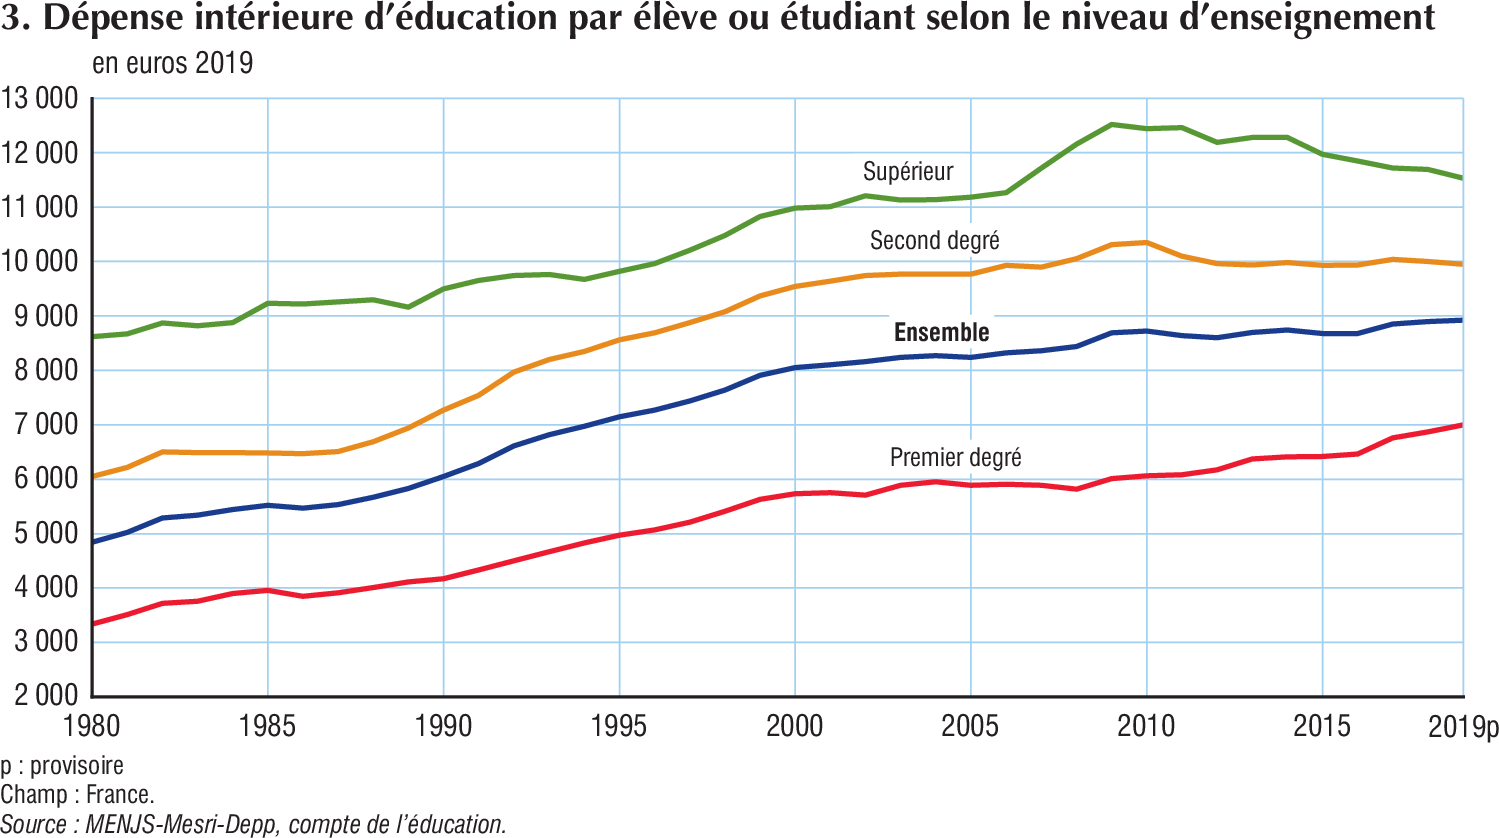
variable == "Supérieur") %>%
year_to_date2() %>%
group_by(variable) %>%
mutate(value = 100*value / value[1]) %>%
ggplot(.) + theme_minimal() + ylab("") + xlab("") +
geom_line(aes(x = date, y = value)) +
theme(legend.title = element_blank(),
legend.position = c(0.2, 0.8)) +
scale_x_date(breaks = seq(1950, 2022, 5) %>% paste0("-01-01") %>% as.Date,
labels = date_format("%y")) +
scale_color_manual(values = viridis(6)[1:5]) +
scale_y_log10(breaks = seq(0, 200, 10))