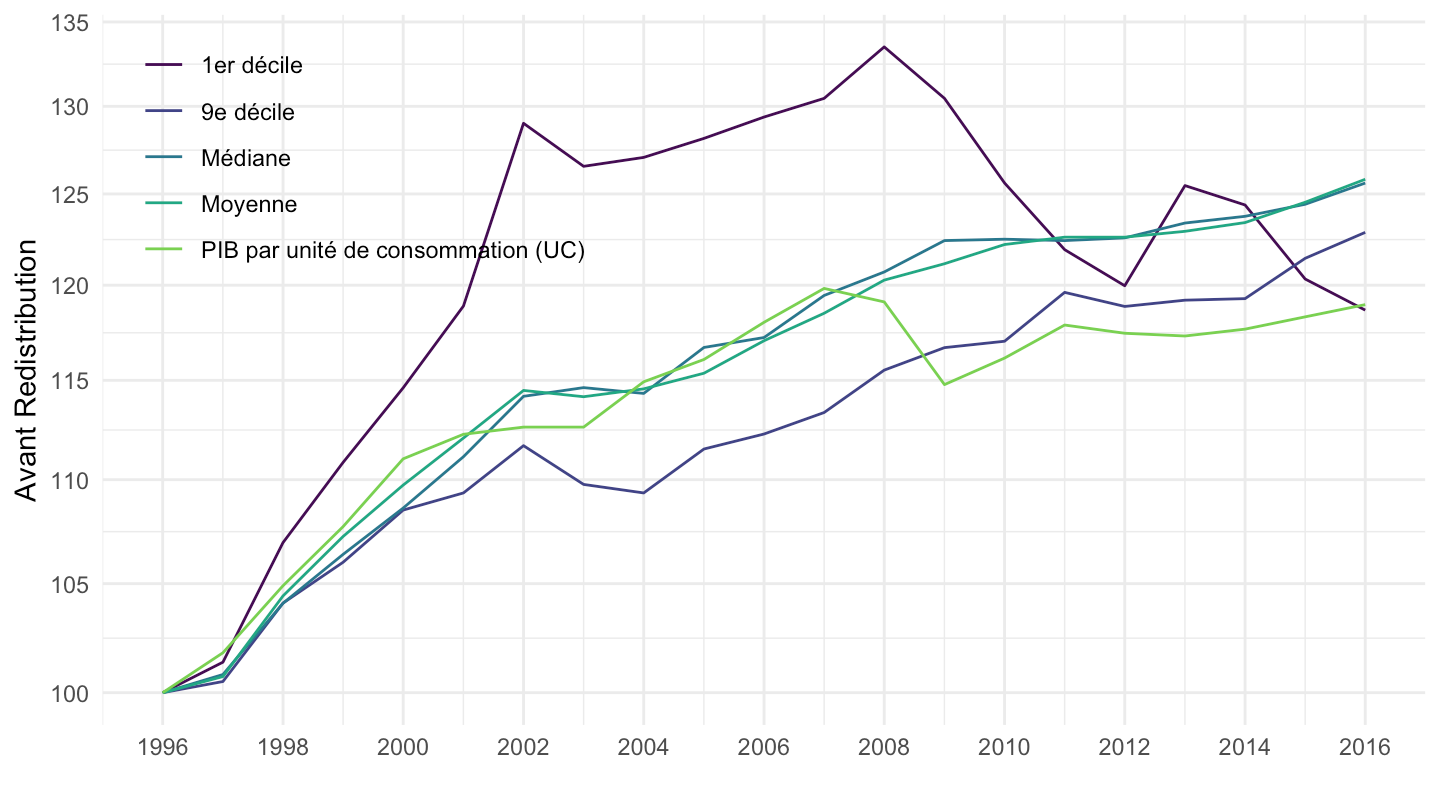
Last observation: 2016 (N = 8)
First observation: 1975 (N = 8)
Last data update: 02 août 2026, 11:04
Last compile: 16 oct. 2026, 01:38
FPS2019 |>
  group_by(variable) |>
  summarise(Nobs = n()) |>
print_table_conditional()| variable | Nobs |
|---|---|
| 1er décile | 25 |
| 9e décile | 25 |
| Actifs | 10 |
| Actifs BIT | 21 |
| Autres inactifs | 10 |
| Autres inactifs BIT | 21 |
| Moyenne | 25 |
| Médiane | 25 |
| PIB par unité de consommation (UC) | 42 |
| Retraités | 10 |
| Retraités BIT | 21 |
FPS2019 |>
  group_by(sheet) |>
  summarise(Nobs = n()) |>
print_table_conditional()| sheet | Nobs |
|---|---|
| Figure 2 | 142 |
| Figure 3 | 93 |
FPS2019 |>
  group_by(year) |>
  summarise(Nobs = n()) |>
  arrange(desc(year)) |>
print_table_conditional()i_g("bib/insee/FPS2019/E4-fig2.png")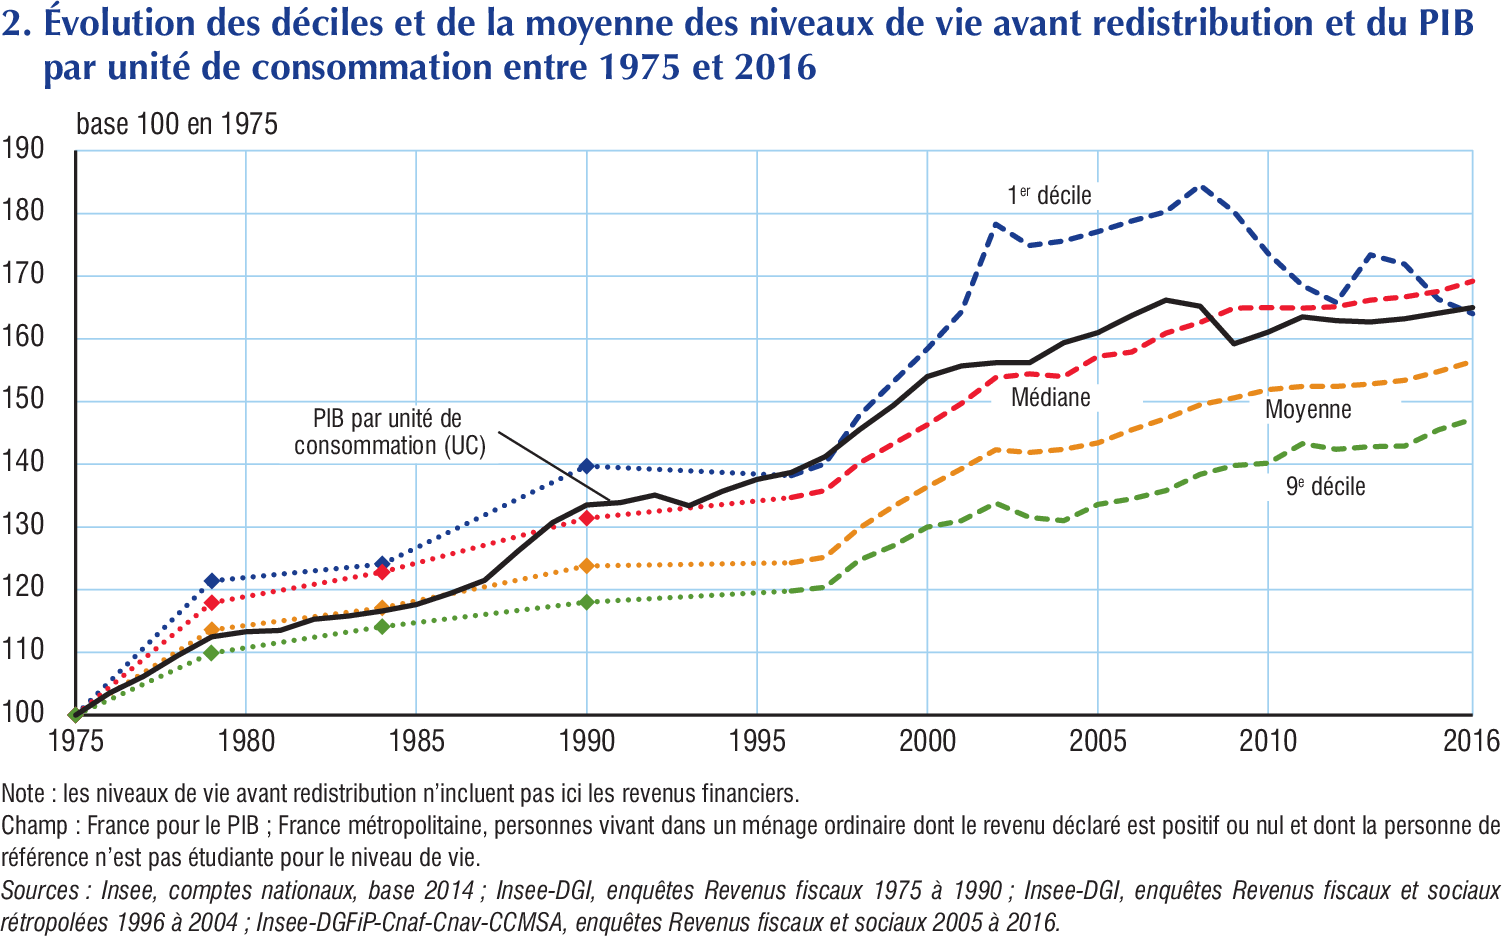
FPS2019 |>
  filter(sheet == "Figure 2") |>
  year_to_date2() |>
  ggplot() + theme_minimal() + ylab("Avant Redistribution") + xlab("") +
  geom_line(aes(x = date, y = value, color = variable)) +
  theme(legend.title = element_blank(),
        legend.position = c(0.2, 0.8)) +
  scale_x_date(breaks = seq(1950, 2100, 5) |> paste0("-01-01") |> as.Date(),
               labels = date_format("%Y")) +
  scale_color_manual(values = viridis(6)[1:5]) +
  scale_y_log10(breaks = seq(0, 200, 10))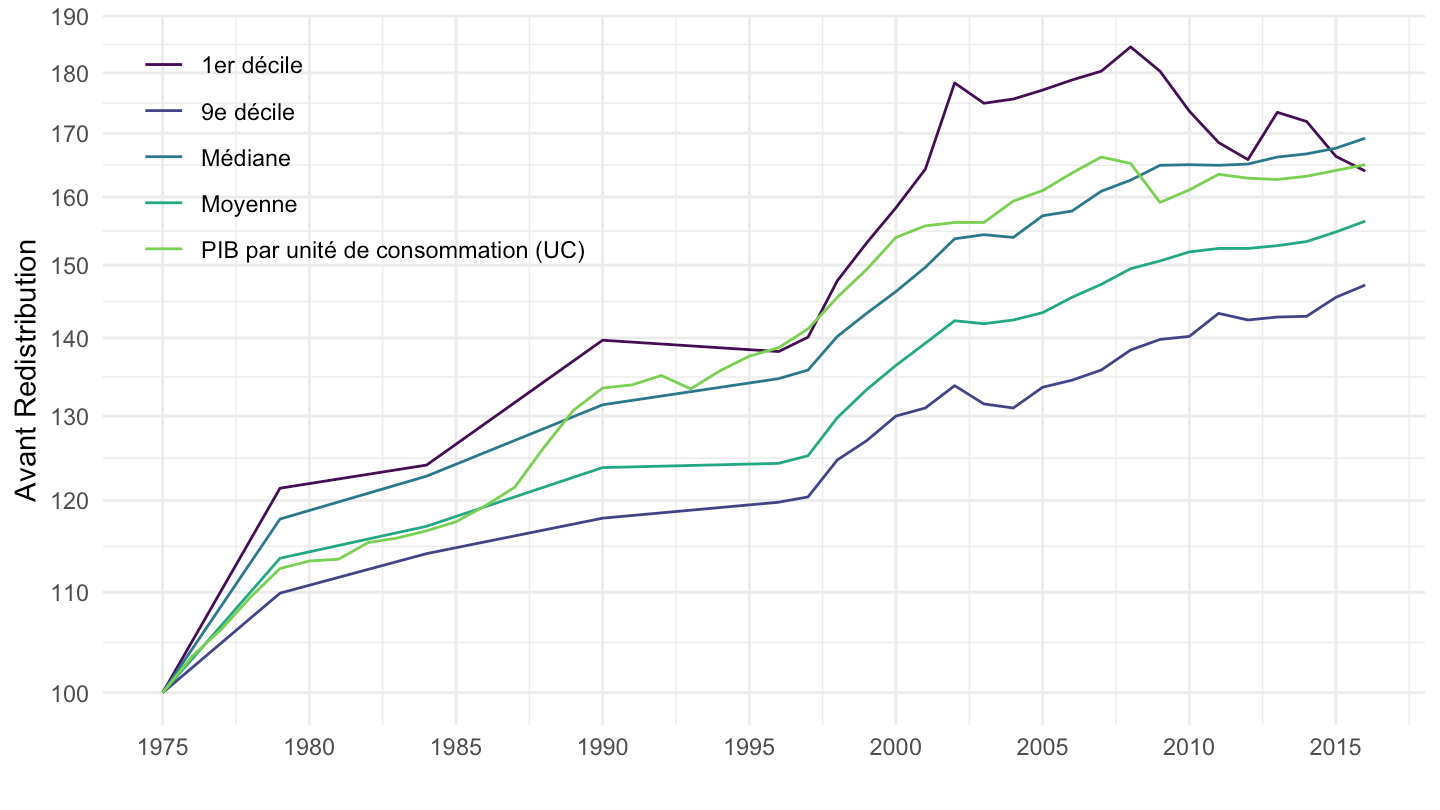
FPS2019 |>
  filter(sheet == "Figure 2") |>
  year_to_date2() |>
  filter(date >= as.Date("1990-01-01")) |>
  group_by(variable) |>
  mutate(value = 100*value/value[date == as.Date("1990-01-01")]) |>
  ggplot() + theme_minimal() + ylab("Avant Redistribution") + xlab("") +
  geom_line(aes(x = date, y = value, color = variable)) +
  theme(legend.title = element_blank(),
        legend.position = c(0.2, 0.8)) +
  scale_x_date(breaks = seq(1950, 2100, 2) |> paste0("-01-01") |> as.Date(),
               labels = date_format("%Y")) +
  scale_color_manual(values = viridis(6)[1:5]) +
  scale_y_log10(breaks = seq(0, 200, 5))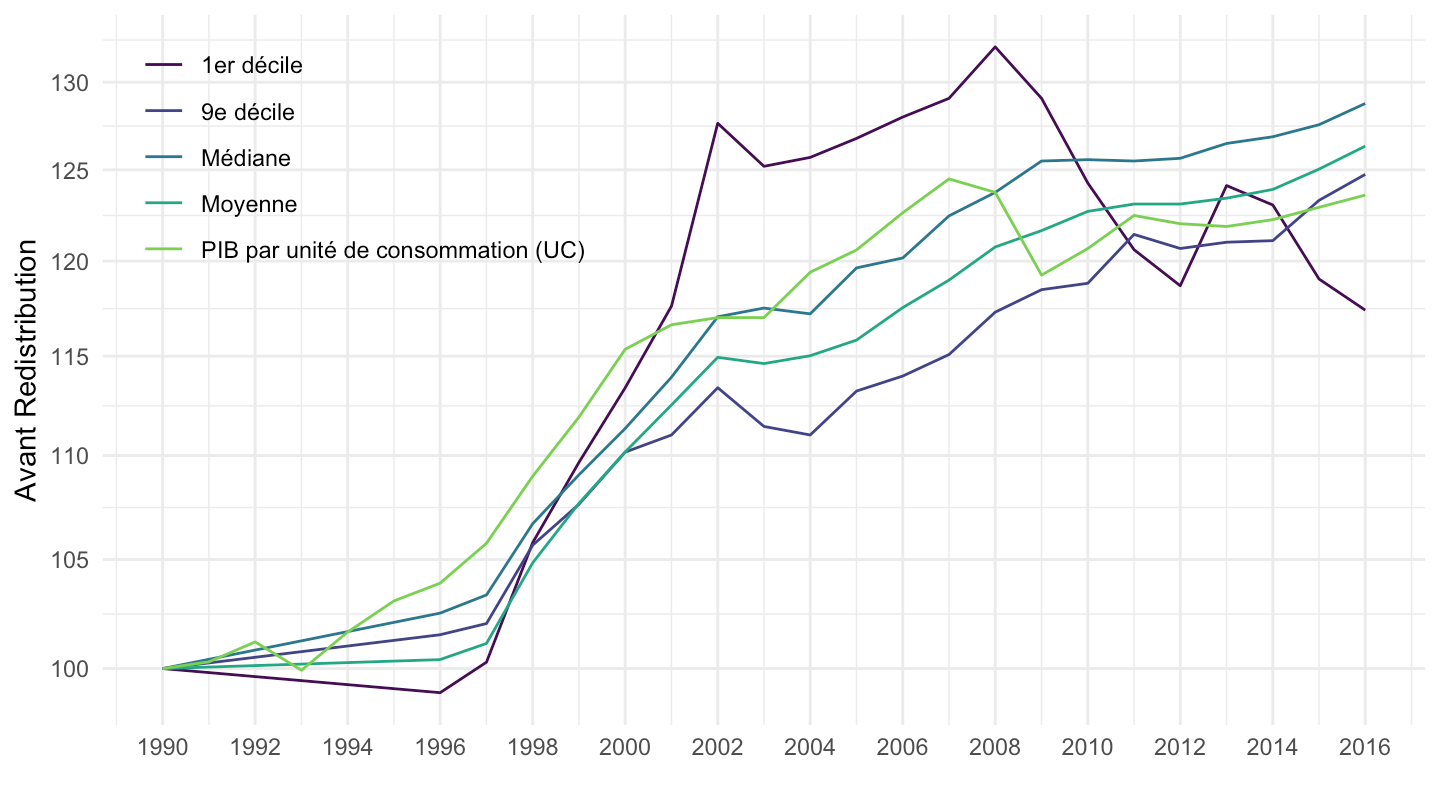
FPS2019 |>
  filter(sheet == "Figure 2") |>
  year_to_date2() |>
  filter(date >= as.Date("1996-01-01")) |>
  group_by(variable) |>
  mutate(value = 100*value/value[date == as.Date("1996-01-01")]) |>
  ggplot() + theme_minimal() + ylab("Avant Redistribution") + xlab("") +
  geom_line(aes(x = date, y = value, color = variable)) +
  theme(legend.title = element_blank(),
        legend.position = c(0.2, 0.8)) +
  scale_x_date(breaks = seq(1950, 2100, 2) |> paste0("-01-01") |> as.Date(),
               labels = date_format("%Y")) +
  scale_color_manual(values = viridis(6)[1:5]) +
  scale_y_log10(breaks = seq(0, 200, 5))