Code
FPORSOC23 %>%
  group_by(variable) %>%
  summarise(Nobs = n()) %>%
print_table_conditional()| variable | Nobs |
|---|---|
| RDB | 63 |
| RDB_arbitrable | 63 |
| RDB_arbitrable_evolution | 63 |
| RDB_evolution | 63 |
Données - INSEE
FPORSOC23 %>%
group_by(variable) %>%
summarise(Nobs = n()) %>%
print_table_conditional()| variable | Nobs |
|---|---|
| RDB | 63 |
| RDB_arbitrable | 63 |
| RDB_arbitrable_evolution | 63 |
| RDB_evolution | 63 |
FPORSOC23 %>%
  group_by(sheet) %>%
  summarise(Nobs = n()) %>%
print_table_conditional()| sheet | Nobs |
|---|---|
| Figure 3 | 252 |
FPORSOC23 %>%
  group_by(year) %>%
  summarise(Nobs = n()) %>%
  arrange(desc(year)) %>%
print_table_conditional()ig_b("insee", "FPORSOC23", "F29", "graphique3")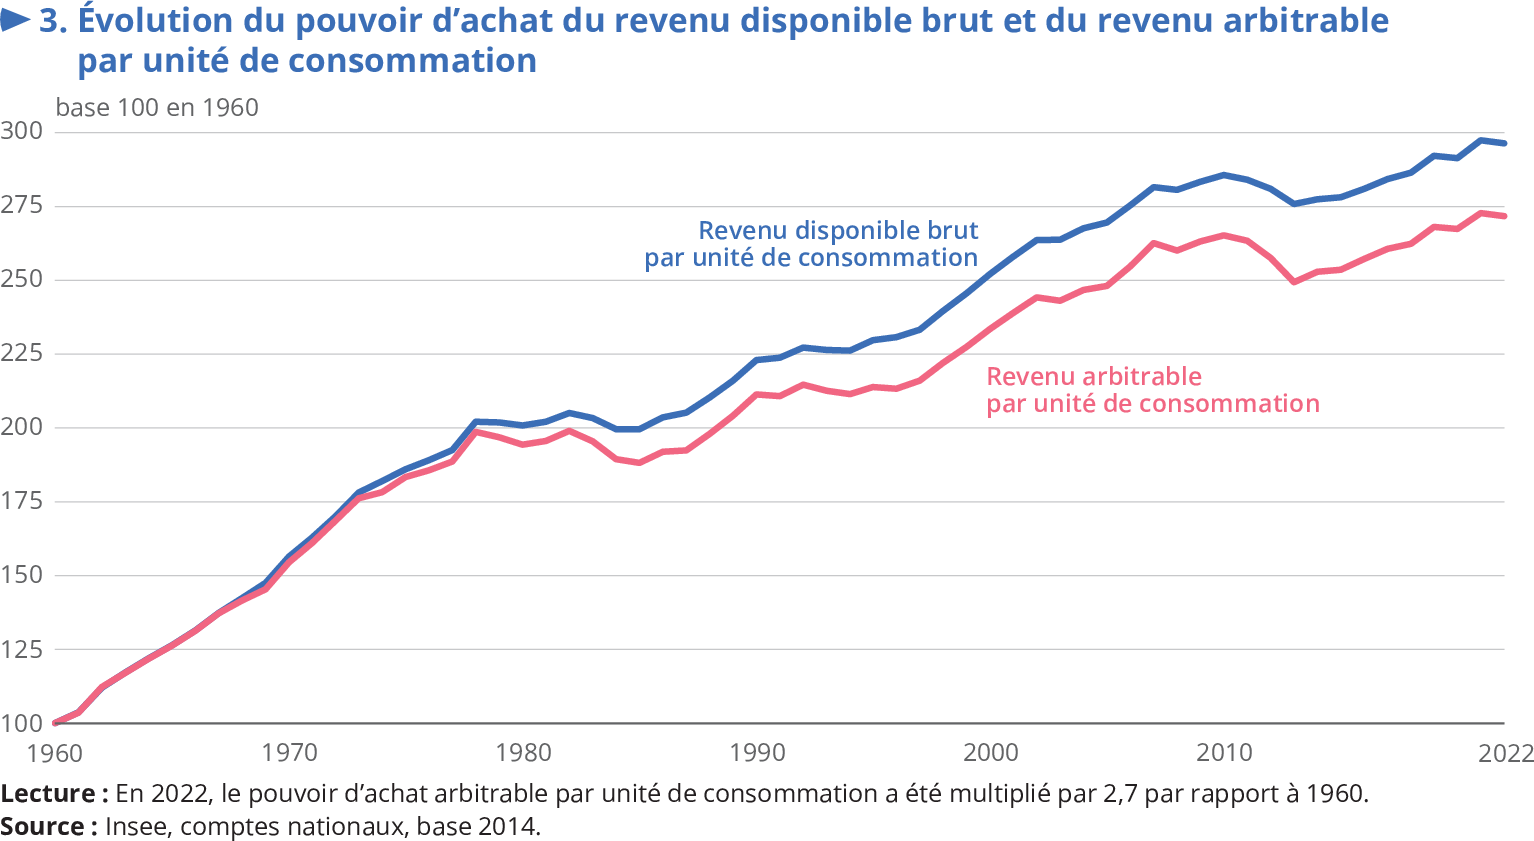
FPORSOC23 %>%
  filter(filename == "F29",
         sheet == "Figure 3",
         variable %in% c("RDB", "RDB_arbitrable")) %>%
  year_to_date2 %>%
  ggplot + geom_line(aes(x = date, y = value, color = variable)) +
  scale_color_manual(values = c("blue", "red")) +
  theme_minimal()  +
  scale_x_date(breaks = as.Date(paste0(seq(1960, 2022, 5), "-01-01")),
               labels = date_format("%Y")) +
  theme(legend.position = c(0.25, 0.85),
        legend.title = element_blank()) +
  xlab("") + ylab("Revenu disponible brut par unité de consommation") +
  scale_y_log10(breaks = seq(0, 7000, 25))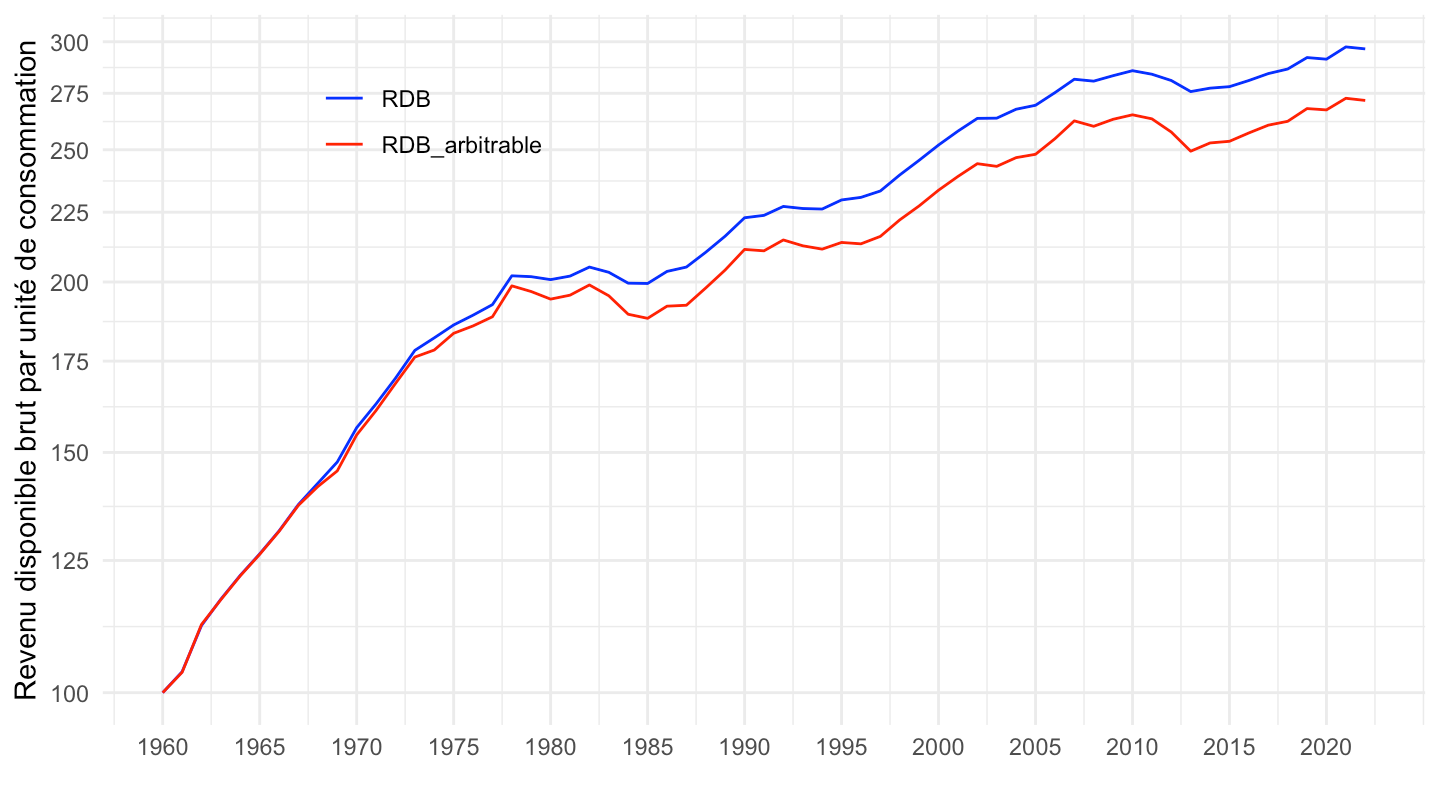
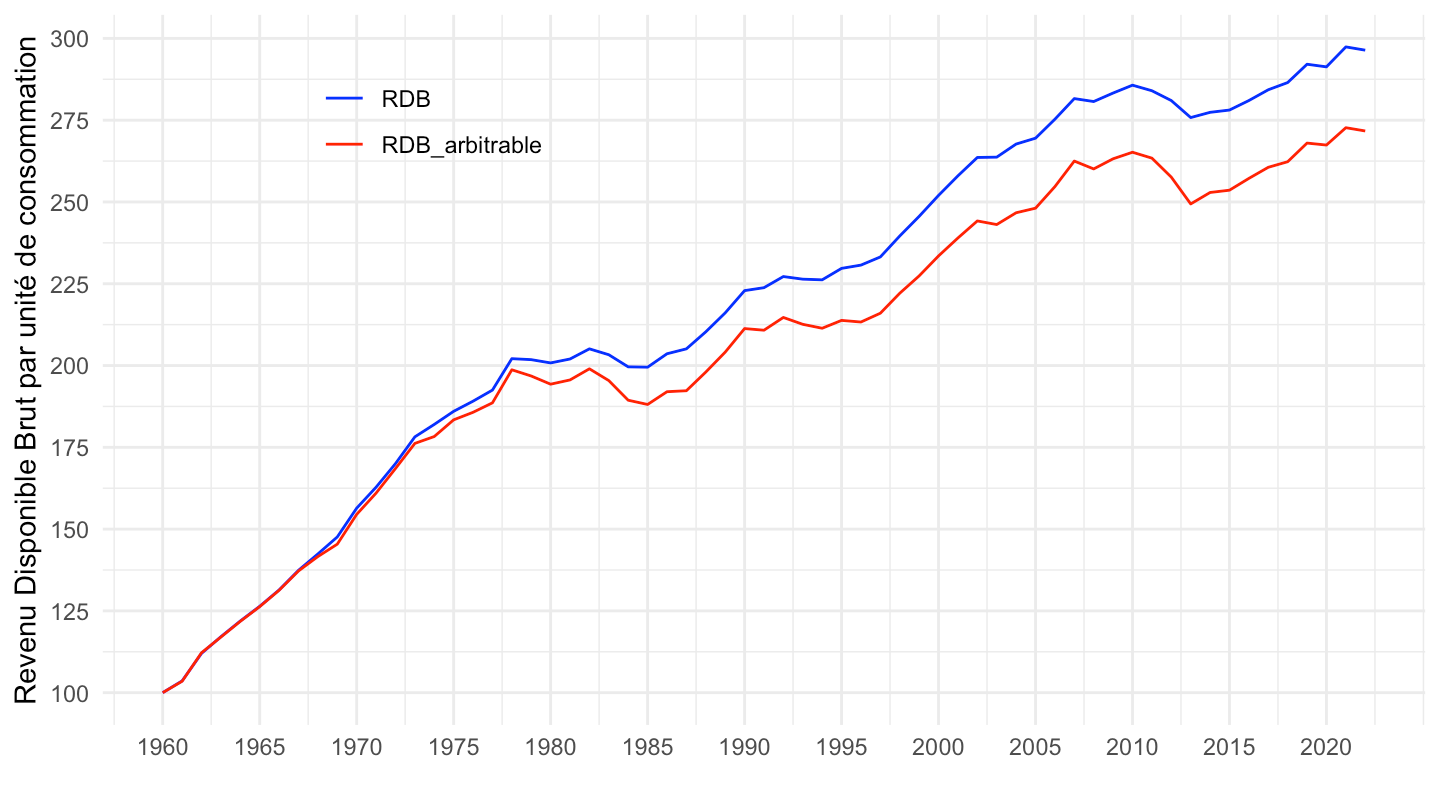
FPORSOC23 %>%
  filter(filename == "F29",
         sheet == "Figure 3",
         variable %in% c("RDB", "RDB_arbitrable")) %>%
  year_to_date2 %>%
  ggplot + geom_line(aes(x = date, y = value, color = variable)) +
  scale_color_manual(values = c("blue", "red")) +
  theme_minimal()  +
  scale_x_date(breaks = as.Date(paste0(seq(1960, 2022, 5), "-01-01")),
               labels = date_format("%Y")) +
  theme(legend.position = c(0.25, 0.85),
        legend.title = element_blank()) +
  xlab("") + ylab("Revenu Disponible Brut par unité de consommation") +
  scale_y_continuous(breaks = seq(0, 7000, 25))